The effects of practice with MP3 players on driving performance
←
→
Page content transcription
If your browser does not render page correctly, please read the page content below
Accident Analysis and Prevention 40 (2008) 704–713

                                      The effects of practice with MP3 players
                                              on driving performance
                                             S.L. Chisholm 1 , J.K. Caird ∗ , J. Lockhart 2
                                 Cognitive Ergonomics Research Laboratory, Department of Psychology, University of Calgary,
                                                 2500 University Drive N.W., Calgary, AB T2N 1N4, Canada
                                Received 27 February 2007; received in revised form 9 August 2007; accepted 7 September 2007

Abstract
   This study examined the effects of repeated iPodTM interactions on driver performance to determine if performance decrements decreased with
practice. Nineteen younger drivers (mean age = 19.4, range 18–22) participated in a seven session study in the University of Calgary Driving
Simulator (UCDS). Drivers encountered a number of critical events on the roadways while interacting with an iPod including a pedestrian entering
the roadway, a vehicle pullout, and a lead vehicle braking. Measures of hazard response, vehicle control, eye movements, and secondary task
performance were analyzed. Increases in perception response time (PRT) and collisions were found while drivers were performing the difficult
iPod tasks, which involved finding a specific song within the song titles menu. Over the course of the six experimental sessions, driving performance
improved in all conditions. Difficult iPod interactions significantly increased the amount of visual attention directed into the vehicle above that of
the baseline condition. With practice, slowed responses to driving hazards while interacting with the iPod declined somewhat, but a decrement still
remained relative to the baseline condition. The multivariate results suggest that access to difficult iPod tasks while vehicles are in motion should
be curtailed.
© 2007 Elsevier Ltd. All rights reserved.

Keywords: Driver distraction; Practice effects; MP3 players; Eye movements; Driving simulation

1. Introduction                                                                  istic study by Stutts et al. (2005), using audio/music devices
                                                                                 while driving their own vehicles. Interaction with these systems
   Driver distraction from a variety of in-vehicle sources, includ-              has resulted in crashes. Music system use (i.e., adjusting the
ing car radios, has been cited since the 1930s as potential                      radio/cassette/CD) was a contributor to about 11% of all dis-
crash contributors (Caird and Dewar, 2007; Goodman et al.,                       traction crashes compared to 1.7% of crashes when using a
1997). In particular, the progression of in-vehicle audio enter-                 cell phone (i.e., talking/listening/dialing) (Stutts et al., 2001).
tainment systems has included radio, 8-track, cassette, CD,                      Interacting specifically with CD players was associated with a
and now MP3 players, which is the focus of this study. The                       several fold increase in crash risk (Klauer et al., 2006). Cell
overwhelming majority of drivers use music systems while                         phone use while driving, which has been the focus of the major-
driving. Almost 92% of drivers were observed, in a natural-                      ity of research on driver distraction, has been associated with
                                                                                 approximately a fourfold increase in crash risk (McEvoy et al.,
                                                                                 2005; Redelmeier and Tibshirani, 1997).
 ∗  Corresponding author. Tel.: +1 403 220 5571; fax: +1 403 282 8249.               Relatively few studies have systematically examined the
    E-mail addresses: Susan.Chisholm@calgaryhealthregion.ca
(S.L. Chisholm), jkcaird@ucalgary.ca (J.K. Caird),
                                                                                 impact of more recent technologies on driver performance,
jlockhar@engineering.uiowa.edu (J. Lockhart).                                    including MP3 players. For example, the effects of e-mail
  1 Present address: Calgary Health Region, Northwest II, Quality, Safety and    (Jamson et al., 2004; Lee et al., 2001), text messaging (Hosking
Health Information, 4520 16th Avenue N.W., Calgary, Alberta T3B 0M6,             et al., 2005) and MP3 players (Donmez et al., 2006) on driver
Canada. Tel.: +1 403 944 2531.                                                   performance are less common than studies of cell phones and
  2 Present address: Human Factors and Statistical Modeling Laboratory,

Department of Mechanical and Industrial Engineering, University of Iowa,
                                                                                 driving (Caird et al., 2004; Horrey and Wickens, 2006). Perfor-
2440 Seamans Center for the Engineering Arts and Sciences, Iowa City, IA         mance decrements associated with distractive tasks have been
52242-1527, USA. Tel.: +1 319 335 5322; fax: +1 319 335 5669.                    found in significant increases in reaction time during cell phone

0001-4575/$ – see front matter © 2007 Elsevier Ltd. All rights reserved.
doi:10.1016/j.aap.2007.09.014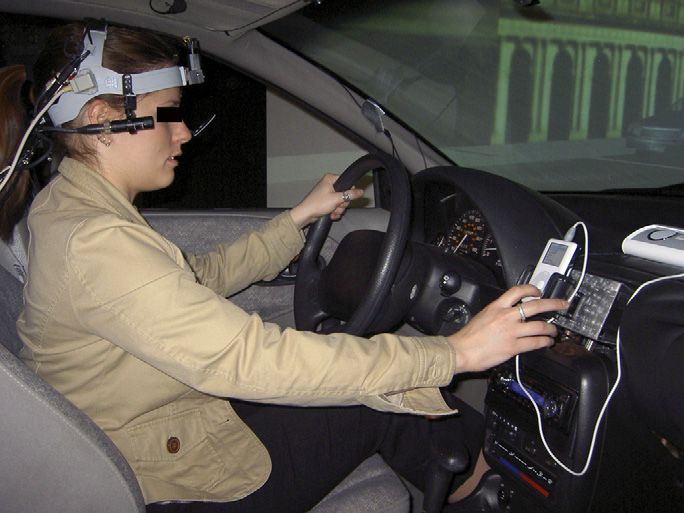
S.L. Chisholm et al. / Accident Analysis and Prevention 40 (2008) 704–713                             705

tasks (Ålm and Nilsson, 1994, 1995; Brookhuis et al., 1991;                unteer for a preliminary screening session plus six simulator
Strayer and Drews, 2004) and speech based e-mail interactions               sessions conducted weekly over a 2-month period. Participants
(Jamson et al., 2004). Lateral vehicle control, as indicated by             were scheduled to return on the same day each week at the same
measures such as lane positioning, and steering, has not con-               time period. Remuneration for the sessions increased incremen-
sistently been affected by cell phone conversation (Brown et                tally and each participant received a total of $200.00 ($CAN)
al., 1969; Parkes and Hööijmeijer, 2001) or speech based email            for the successful completion all seven sessions and their
(Jamson et al., 2004). In contrast, text messaging while driv-              names were entered into a prize draw at the completion of the
ing has been found to significantly increase the number of lane             study.
excursions observed (Hosking et al., 2005). Additional research                 All participants were required to hold a valid class 5 driver’s
on more recent technologies that are brought into the vehicle by            license, drive a minimum of 10,000 km per year, be in good
the driver is needed.                                                       physical and mental health, and not be under the influence of
    To determine the allocation of attention to specific sources            medications or drugs that would affect their driving or cogni-
within and outside the vehicle requires the use of eye movement             tive performance. Due to the difficulties of calibrating the eye
measures. Previous research has shown that drivers reduce or                movement system, those who required glasses to drive were not
constrain the breadth of eye movements in the presence of a dis-            permitted to participate in the study.
tractor (Chisholm et al., 2006; Green, 1999a; Recarte and Nunes,                Visual testing was performed using a number of tests to ensure
2000, 2003) such as a cell phone. However, while interacting                participants met the minimum acuity requirements mandated by
with a visual secondary device, increased visual sampling into              law for licensure, which is 20/40 acuity in Alberta (Casson and
the vehicle is required and may affect eye movement behaviours.             Recette, 2000). Corrected visual acuity was tested for both long
Hosking et al. (2005) found a 400% increase in eyes off road                and short distances, using the Snellen Visual Acuity chart and
time while sending or receiving text messages in a simulator.               Landolt C tests, respectively. Contrast sensitivity was measured
From a practical point of view, eyes off the roadway and the fre-           with the Vistech Contrast Sensitivity Chart (Scialfa et al., 1991)
quency of glances to a device have been used to suggest that eye            and color vision was assessed with the Ishihara Test for Color
movements that are too long or too frequent are unsafe (Green               Blindness (plates no. 3 and 27) (Ishihara, 1993). Those who did
and Shah, 2004). When the eyes are focused into the vehicle                 not meet the minimum requirements for visual acuity, contrast
the probability of missing critical external events while driving           sensitivity, or had color vision deficits were not allowed to par-
increases, thereby increasing the potential for collisions (Green,          ticipate in the study (N = 2). During the initial screening and
2007; Klauer et al., 2006).                                                 testing session, participants drove a practice drive, to become
    To address the lack of empirical studies on MP3 player                  familiar with the handling characteristics of the simulator and
interaction, the present study examined the effects of iPod                 screen out those who experienced simulator sickness (N = 3).
interactions over multiple sessions to determine the effects of
distraction on different event types and glance measures. The               2.2. Apparatus and materials
addition of the distraction task was expected to cause decre-
ments on a number of measures of driving performance relative               2.2.1. The University of Calgary Driving Simulator
to baseline. Specifically, the more difficult iPod interactions were        (UCDS)
expected to degrade perception response times to critical haz-                 The following brief description of the UCDS and eye move-
ards and increase the number of collisions observed. Whereas                ment system is abridged from Caird et al. (2006). The UCDS
the easy iPod interactions would be executed with little disrup-            consists of three Epson 703C projectors that display the simu-
tion and be less distracting than the difficult interactions while          lated images onto three (86.5 in. wide by 65 in. height) screens
driving. The complexity of the difficult iPod task was expected             positioned approximately 230 cm from the drivers head posi-
to increase the frequency and duration of fixations made into               tion. The total projected forward field-of-view from the drivers
the vehicle to complete the task. Over the sessions participants            seated position is 150◦ .
were expected to become more efficient in their interactions with              Traffic environments and experimental scenarios for the driv-
the iPod, leading to a decrease in task completion time. Some               ing simulator are developed and run in HyperDriveTM (v. 1.9.25).
increased efficiency in task sharing was expected over sessions,            Tiles can be selected from an extensive pallet of intersections,
which will lead to decreases in perception response time and                freeway sections, streets, and so forth, all of which adhere to
the number of collisions as performance improved. Although                  the Manual on Uniform Traffic Control Devices (MUTCD). The
improvement equal to or beyond that of the baseline measures                placement of dynamic objects, such as vehicles and pedestri-
was not expected to occur.                                                  ans, require iterative testing and development using a variety of
                                                                            Tcl/Tk scripts.
2. Methods                                                                     The SimObserver system records participant and experi-
                                                                            menter activities and integrates multiple visual and auditory
2.1. Participants                                                           inputs into a single display. Three black and white “lipstick”
                                                                            cameras are mounted inside the Saturn and provide views of
   Nineteen participants (10 Females, 9 Males) between 18 and               the driver’s face, hands on the steering wheel, and feet on the
22 years of age were recruited from the University of Calgary               brake and accelerator. A fourth color camera records the center
and surrounding community. Participants were asked to vol-                  screen of the simulated traffic environment. Video analysis is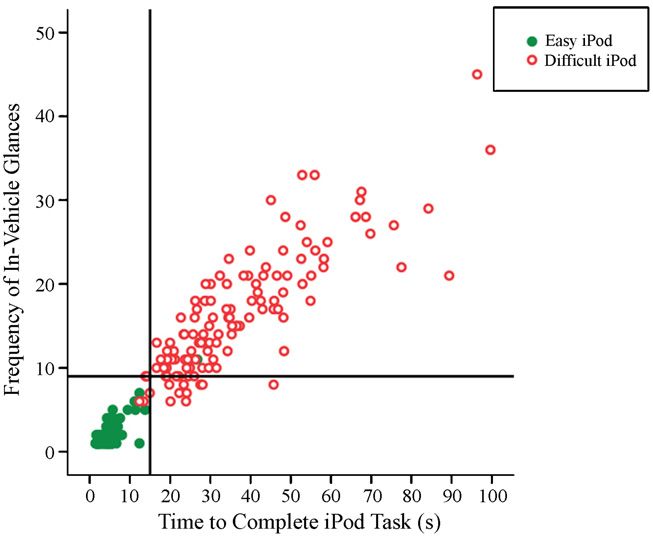
706 S.L. Chisholm et al. / Accident Analysis and Prevention 40 (2008) 704–713
performed using Data Distillery, which is an offline data review the experimental sessions (3 easy and 3 difficult tasks) for a
and reduction analysis program. total of 36 iPod interactions over the six sessions.
2.2.2. ASL-501 eye tracking system 2.3.2. Experimental sessions
Eye movements were captured during half of the experimen- The first experimental session included training on the iPod
tal sessions (i.e., sessions 2, 4, and 6) using an Applied Science functions and the tasks. During each of the six experimen-
Laboratory (ASL) 501 eye tracking system. The ASL 501 uses tal sessions, participants drove a total of three drives. The
a lightweight, head-mounted, infrared corneal reflection sys- first was a practice drive to familiarize participants each week
tem that allows data collection while head and body movements with the handling characteristics of the simulator. The sec-
occur. Eye position is sampled at a rate of 60 Hz with a spatial ond and third drives were counterbalanced for presentation
error of 1◦ at the center of the plane of view (Applied Sciences and included a drive interacting with the iPod and a base-
Laboratory, 2001). line drive with no secondary task, each lasting approximately
12 min.
Occasionally, participants were required to respond to three
2.3. Procedure
different types of critical events during iPod interactions as well
as baseline drives (see Fig. 2). The first event involved a pedes-
2.3.1. Secondary tasks
trian who emerges from between two parked cars and “walks”
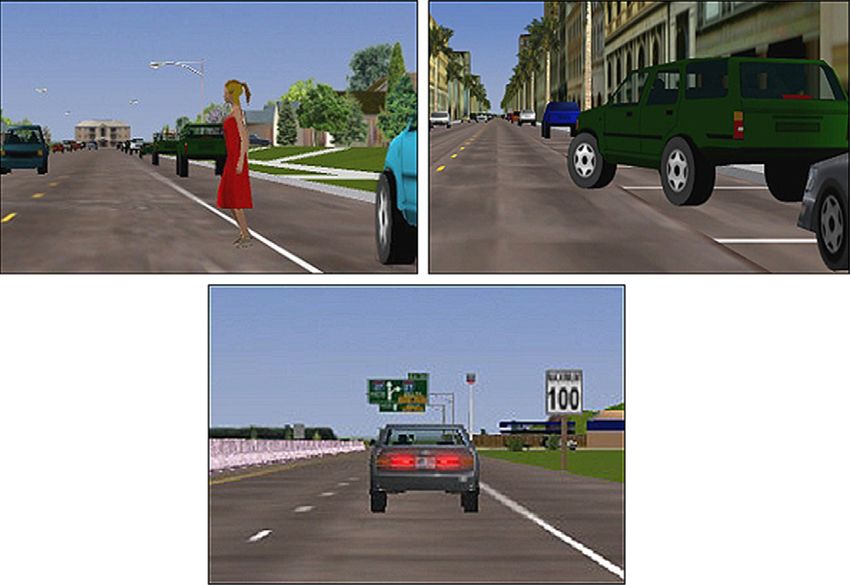
During each session, the participants interacted with a 20GB
into the path of the driver on the road. The second event involved
Apple iPodTM while driving (see Fig. 1). The iPod was mounted
a parked vehicle that pulled out from the side of the roadway into
on the center console of the Saturn, and connected to a portable
the path of the participant. Both the pedestrian and pullout events
speaker system (i.e., JBL on tour). For a person 5 8 tall, the iPod
occurred on the 50 km/h residential or urban roadways. The
was positioned 37◦ down and 53◦ to the left of road center. Both
third event involved a lead vehicle traveling 1.5 s (approximately
easy and difficult iPod tasks were performed during each session.
40 m) in front of the participant on the 100 km/h freeway that
Easy tasks were defined as having one or two steps, represent
brakes suddenly. All three events required braking, steering, or a
common tasks (i.e., achieved frequent goals), and took less than
combination therein to avoid a collision and have been developed
5 s to accomplish when tested alone. These included turning off
and used previously (Caird et al., 2008; Chisholm et al., 2006).
the iPod, pausing, and skipping ahead a couple of songs. Difficult
A total of three occurrences of each event type were encountered
tasks required five to seven steps, are used to accomplish more
within the easy iPod, difficult iPod, and baseline secondary task
complex or specific tasks, and took about 20–30 s to complete
conditions. Event placement during the iPod tasks varied ran-
when tested alone. Difficult interactions required participants
domly; some were encountered early in the task performance
to turn on the iPod and find a specific song in the song titles
while others were delayed further into the task. All events were
menu. A total of 900 songs were programmed into the iPod
counterbalanced across the six experimental sessions, with no
and were arranged alphabetically by song title. All iPod task
one event iPod combination occurring more than once within
instructions were presented in green writing on the center screen
a single session, to reduce anticipation on the part of the
during the drives and informed participants of the tasks they were
driver.
to perform immediately. For example, difficult iPod instructions
included the song title they had to play, i.e., “Play: Jack and
2.3.3. Experimental drive descriptions
Diane”. Six iPod interactions were performed within each of
Eighteen experimental drives were created and used during
the six experimental sessions. Parked cars and commercial build-
ings lined the urban route and parked cars and single-family
homes with attached garages lined the residential routes. The
freeway roads consisted of six-lanes of traffic, three in each
direction, separated by a grassy median. The volume of ambient
traffic encountered in the scenarios varied depending on road
type, and consisted of a mix of cars, trucks, and SUV’s.
3. Results
3.1. Participants
All 19 young drivers successfully completed the screening
and six experimental sessions. A summary of the demographic,
driving experience and visual acuity test measures for the sample
of participants is shown in Table 1. In our sample, 15 participants
owned MP3 players, eight of whom reported owning a model
Fig. 1. Participant with eye movement apparatus and the 20 GB iPod mounted of the Apple iPod player. Six of the 15 owners reported having
on the center console in the simulator. used their MP3 players while driving.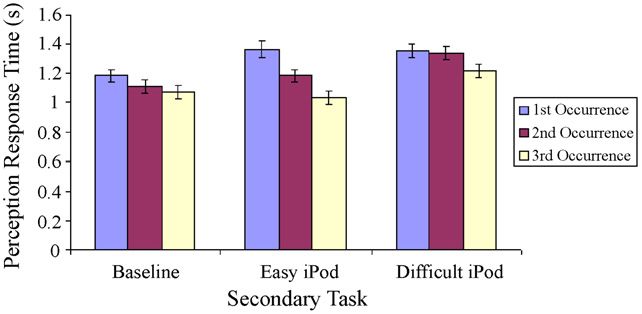
S.L. Chisholm et al. / Accident Analysis and Prevention 40 (2008) 704–713                                              707

          Fig. 2. Pedestrian event in residential roadways (top left), pullout event in urban roadways (top right), and lead vehicle braking event (bottom).

3.2. Experimental design                                                                 The results are organized by hazard response (i.e., PRT and
                                                                                      collisions), lateral control (SD of steering wheel angle), eye
   Hazard response data were analyzed using repeated mea-                             movements (glance frequency, glance duration), and secondary
sures ANOVA with secondary task (easy iPod, difficult iPod,                           task performance (task completion time). Definitions of each of
baseline), event type (pedestrian, lead vehicle braking, and pull-                    these dependent variables precede the results of each analysis.
out vehicle), and occurrence of the event (3 per secondary task
condition) as within-subjects variables. To reduce expectancy,                        3.3. Hazard detection and response
each combination of event and secondary task condition were
not encountered within each session. Over the six sessions                            3.3.1. Perception response time
each event and secondary task combination was presented 3                                Perception response time (PRT) was calculated in seconds
times, occurrence denotes the order across sessions. Overall                          from the immediate onset of an event to a braking response
analyses examined the larger design with all events, secondary                        (Olson and Farber, 2003). The longest PRT was found while
tasks and occurrences included to determine the pattern of                            drivers were performing the difficult iPod tasks (M = 1.30 s,
results.                                                                              S.E. = .03), than in the easy iPod (M = 1.17 s, S.E. = .03) and
   Variation in steering wheel angle data was analyzed using                          baseline (M = 1.12 s, S.E. = .03) conditions, F(2, 37) = 9.76,
repeated measures ANOVA with secondary tasks (difficult iPod                          p < .001, which is illustrated in Fig. 3. Post hoc analyses showed
and baseline), and road type (residential, urban, and freeway) as                     significant differences between the difficult iPod and baseline
within-subject factors. Eye movement data was analyzed by sec-                        conditions, p < .05, and between the difficult iPod and easy iPod
ondary task (easy iPod, difficult iPod, baseline), areas of interest                  conditions, p < .05.
(on-road, in-vehicle, off road, and rearview mirror), and road                           Drivers’ PRT improved significantly over occurrences, with
type (residential, urban, and freeway). Multiple comparisons                          PRT in the 3rd occurrence being significantly faster (M = 1.10 s,
were made using the Sidak adjustment (Tabachnick and Fidell,                          S.E. = .03) than both the 2nd (M = 1.21 s, S.E. = .03) and 1st
2006).                                                                                (M = 1.29 s, S.E. = .03) occurrences, F(2, 39) = 8.87, p = .001.

Table 1
Gender, number of participants in each group, mean participant age (standard deviation, S.D.), average reported kilometers driven per year, number of reported
crashes in the last 5 years, moving violations reported in the last 5 years, left and right eye visual acuity, and short distance visual acuity with correction (minimum
angle of resolution, MAR)
           N       Mean age (S.D.)      Avg. (km/year)          Crashes         Moving violations       Visual acuity left   Visual acuity right     Short distance VA

Male        9      19.33 (0.87)          22,222 (10,663)        0.11 (0.33)     0.44 (0.73)             1.0 (0.18)           0.99 (0.20)             0.81 (0.15)
Female     10      19.4 (1.35)           18,040 (12,246)        0.60 (0.70)     0.90 (1.29)             1.13 (0.38)          1.17 (0.50)             0.98 (0.10)
Total      19      19.37 (1.12)          20,021 (11,407)        0.37 (0.60)     0.68 (1.06)             1.07 (0.30)          1.08 (0.39)             0.90 (0.15)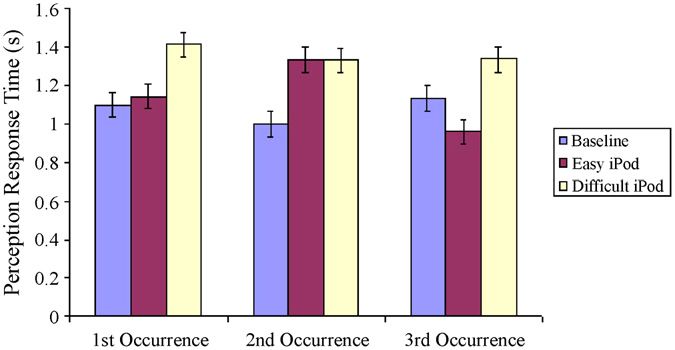
708                                       S.L. Chisholm et al. / Accident Analysis and Prevention 40 (2008) 704–713

                                                                                    Secondary task also significantly affected drivers’ PRT to
                                                                                 the braking event, F(2, 39) = 3.30, p = .048. The fastest PRT
                                                                                 to the lead vehicle braking was observed in the baseline
                                                                                 condition (M = 1.24 s, S.E. = .06), followed by the easy iPod
                                                                                 condition (M = 1.40 s, S.E. = .06), and finally the difficult iPod
                                                                                 condition (M = 1.44 s, S.E. = .06). Only the difference between
                                                                                 the baseline and difficult iPod conditions was significant,
                                                                                 p < .05.

                                                                                 3.3.1.3. Pullout vehicle event. During the pullout vehicle
Fig. 3. Perception response time (PRT) by secondary task and occurrence.         event, PRTs were significantly longer in the difficult iPod
                                                                                 task (M = 1.36 s, S.E. = .04), than the easy iPod (M = 1.15 s,
However, no differences were found between the 1st and 2nd                       S.E. = .04), and the baseline conditions (M = 1.08 s, S.E. = .04),
occurrences in post hoc analyses, p > .05.                                       F(2, 36) = 12.95, p < .001. Significant differences were found
   Event type also significantly affected perception response                    between the difficult iPod and baseline, p < .001, and between
times to hazards, F(2, 368) = 35.78, p < .001. Lead vehicle brak-                the difficult iPod and the easy iPod conditions, p < .001. The
ing events had the longest mean PRT (M = 1.36 s, S.E. = .03)                     two-way interaction between occurrence and secondary task was
followed by the pullout vehicle (M = 1.19 s, S.E. = .03), and the                significant, F(4, 70) = 4.37, p = .003.
pedestrian (M = 1.04 s, S.E. = .03) events. All of which differed                    As can be seen in Fig. 4, for the pullout event over occur-
significantly from each other, p < .001.                                         rences, baseline means remained relatively constant whereas
   The two-way interactions between occurrence and event type,                   in the difficult iPod condition, a decrease in PRT was found
F(4, 368) = 3.56, p = .007, and between secondary task and event                 over occurrence. In the 1st occurrence of the pullout event
type, F(4, 368) = 2.87, p = .023, were also significant. Both inter-             results, as expected, the shortest PRT times occurred in the
actions however, were embedded in a significant three-way                        baseline (M = 1.10 s, S.E. = .05), followed by the easy iPod task
interaction among occurrence, secondary task, and event type,                    (M = 1.14 s, S.E. = .05), and the longest PRT found in the dif-
F(7, 368) = 7.45, p < .001. Follow-up analyses examined each                     ficult iPod condition (M = 1.41 s, S.E. = .05), F(2, 54) = 10.08,
event type separately.                                                           p < .001. No significant differences were found between the
                                                                                 baseline and easy iPod conditions, but both differed signifi-
3.3.1.1. Pedestrian event. Secondary task had a significant                      cantly from the difficult iPod condition, p < .05. During the 2nd
effect on PRT to the pedestrian event, F(2, 36) = 6.27, p = .005.                occurrence of the pullout event, the shortest PRT was observed
The fastest PRT to the pedestrian event was observed with the                    during the baseline (M = 0.998 s, S.E. = .07), followed by the
easy iPod tasks (M = 0.90 s, S.E. = .05), which was significantly                difficult iPod (M = 1.33 s, S.E. = .07), and easy iPod (M = 1.34 s,
faster than the difficult iPod task (M = 1.15 s, S.E. = .04), p < .05.           S.E. = .07) conditions, F(2, 53) = 7.73, p = .001. Comparisons
However, both iPod tasks did not differ significantly from the                   show that PRT for both iPod tasks were significantly longer
baseline condition (M = 1.03 s, S.E. = .04), p > .05.                            than the baseline, p < .05. In the 3rd occurrence of the pull-
   The interaction between occurrence and secondary task type                    out event, PRT was significantly affected by secondary task,
was significant, F(3, 53) = 11.75, p < .001. For the 1st occur-                  F(2, 53) = 4.72, p = .013. However, the easy iPod condition
rence of the pedestrian event, there were no differences in                      resulted in the shortest PRT (M = 0.96 s, S.E. = .07), followed
PRT between the baseline condition or difficult iPod task, F(1,                  by the baseline (M = 1.13 s, S.E. = .07), and the difficult iPod
35) = 2.31, p > .05. In the 2nd occurrence of the pedestrian the                 condition (M = 1.28 s, S.E. = .08). PRT in the difficult iPod con-
fastest PRT was found in the easy iPod condition (M = 0.78 s,                    dition was significantly longer than the easy iPod condition,
S.E. = .07) followed by the baseline (M = 1.05 s, S.E. = .07), and               p < .05.
the longest PRT times were found in the difficult iPod condition
(M = 1.46 s, S.E. = .07), F(2, 54) = 21.07, p < .001. All of which
significantly differed from each other, p < .05. By the 3rd occur-
rence of the pedestrian event, no significant differences were
found between the secondary task conditions, F(2, 54) = 0.58,
p > .05.

3.3.1.2. Lead vehicle braking event. Perception response time
(PRT) for the braking event indicated steady improvement in
performance between the 1st occurrence (M = 1.54 s, S.E. = .06),
and decreasing on the 2nd (M = 1.34 s, S.E. = .06), and 3rd occur-
rences (M = 1.20 s, S.E. = .06), F(2, 39) = 8.61, p = .001. The
difference between the 1st and 3rd occurrence was significant,                   Fig. 4. Perception response time (PRT) to the pullout vehicle by secondary task
p < .05.                                                                         and occurrence.
S.L. Chisholm et al. / Accident Analysis and Prevention 40 (2008) 704–713 709
3.3.2. Collisions of glances into the vehicle made during iPod interactions was
A total of 513 event occurrences were included in this anal- examined to determine the average number of glances needed
ysis, which represents all the experimental combinations of to complete the required tasks. Obviously the difficult iPod task
the independent variables (i.e., pedestrian, lead vehicle brak- required significantly more glances into the vehicle (M = 16.70,
ing, and pullout vehicle), for each of the secondary tasks (i.e., S.E. = .42) than the easy iPod interactions (M = 1.98, S.E. = .47),
baseline, easy iPod, and difficult iPod). Of the 513 events F(1, 18) = 190.45, p < .001.
encountered by participants over the course of the six sessions, The number of glances to the rearview mirror could not be
a total of 115 collisions resulted. Secondary task had a sig- compared using parametric statistics because too few partici-
nificant effect on collision frequency, χ2 (2) = 11.67, p = .003. pants in the iPod tasks glanced at the rearview mirror. Chi-square
Twenty-eight collisions occurred during the baseline drives, analyses revealed that there was a significantly higher frequency
34 during the easy iPod interactions, and 53 in the difficult of glances to the rearview mirror in the baseline condition (76
iPod interactions. Significant differences in collision frequency of the events out of 95 generated a look to the mirror) com-
were found between the difficult iPod and baseline condi- pared to the easy iPod condition (where 11 out of 171 events
tions, χ2 (1) = 10.35, p = .001, and between the difficult iPod elicited a look to the rearview mirror), χ2 (1) = 150.18, p < .001;
and easy iPod conditions, χ2 (1) = 5.60, p = .018. Frequency of and difficult iPod condition (27/171), χ2 (1) = 106.12, p < .001.
collisions also decreased significantly from the 1st occurrence
(52) to the 2nd occurrence (39) and finally the 3rd occurrence 3.5.2. Mean glance duration
(24), χ2 (2) = 8.98, p = .011. Significant differences were found Glance duration was calculated as the time (in seconds) from
between the 1st and 3rd occurrences, as well as between the 2nd first looking at an AOI until gaze was moved off that area.
and 3rd occurrences, p < .05. The mean duration of each glance in seconds was extracted
and categorized into various AOIs (i.e., in-vehicle, on-road,
3.4. Standard deviation of steering wheel angle off-road) for each secondary task (i.e., baseline, easy iPod,
hard). The duration of glances significantly differed depend-
Steering angle variation was used to determine steering cor- ing on the AOI, F(2, 43) = 22.18, p < .001. Specifically, longer
rections made while interacting with the iPod and comparable glances were made into the vehicle (M = 0.78 s, S.E. = .02) than
baseline measures on matched roadways. Collected data com- on the road (M = 0.67 s, S.E. = .02), and off the road (M = 0.42 s,
menced at the beginning of the iPod task and excluded any event S.E. = .03), all of which significantly differed from one another,
response data, curve navigation, or turns. Due to the short time p < .05.
needed to complete the easy iPod task, only the difficult iPod Mean glance durations differed by secondary task, F(2,
and baseline analyses were performed. 49) = 14.04, p < .001. Significantly longer glance durations were
The difficult iPod tasks had larger variation in steering found in the difficult iPod condition (M = 0.73 s, S.E. = .02)
wheel adjustments (M = 2.11◦ , S.E. = .05) than during the base- compared to the easy iPod (M = 0.55 s, S.E. = .03) and base-
line (M = 1.17◦ , S.E. = .05), F(1, 18) = 62.02, p < .001. Roadway line conditions (M = 0.60 s, S.E. = .02), p < .05. The three-way
type showed a significant effect on deviation of steering wheel interaction among AOI, secondary task, and road type was also
angle, F(2, 36) = 85.96, p < .001. The significantly larger varia- significant, F(8, 613) = 2.76, p = .005. Follow-up analyses exam-
tion occurred on the freeways (M = 2.20◦ , S.E. = .07) compared ined each AOI (i.e., on road, in-vehicle, and off road) separately
to the residential (M = 1.38◦ , S.E. = .06), and urban (M = 1.33◦ , to determine the effects of secondary task on glance duration.
S.E. = .07) roadways, p < .05.
3.5.2.1. On-road. Glance duration to the roadway differed
3.5. Eye movement variables depending on secondary task, F(2, 43) = 5.37, p = .008. Longer
glances to the roadway were found in the baseline condition
Eye movements were collected on the even numbered ses- (M = 0.82 s, S.E. = .05) followed by the difficult iPod (M = 0.64 s,
sions (sessions 2, 4, and 6) in both the iPod and baseline S.E. = .04) and easy iPod (M = 0.54 s, S.E. = .05) conditions.
conditions. Video data analysis of eye movements was analyzed Only the glances to the roadway during the easy iPod task
using SimObserver and Data Distillery hardware and software. were significantly shorter than the baseline, p < .05. Signifi-
A glance was defined as consecutive fixations to an area of cantly longer glances to the road were also found on the freeway
interest (i.e., in the vehicle, on road) not including saccade transi- (M = 0.76 s, S.E. = .04) compared to the residential (M = 0.61 s,
tion time and blinking behaviour (International Organization of S.E. = .04) roads, F(2, 176) = 4.18, p = .017.
Standards, 2002). In-vehicle, on road, off road (which included Mean glance duration to the roadway significantly differed
any signs, buildings, parked cars that are not in the central road- depending on the two-way interaction between secondary task
way), and rearview mirror were the areas of interest (AOI) that and road type, F(4, 176) = 4.42, p = .002. On the residential
were extracted. roadways, significantly longer glances were made during the
baseline condition (M = 0.81 s, S.E. = .08) than the difficult iPod
3.5.1. Mean glance frequency (M = 0.54 s, S.E. = .05), and easy iPod (M = 0.47 s, S.E. = .06)
Glance frequency is defined as the number of glances to conditions, F(2, 39) = 5.89, p = .006. No difference was found
a target during the task where each glance is separated by at between the iPod conditions, p > .05, but both means differed
least one glance to a different target (ISO, 2002). The number significantly from the baseline, p < .05. There was no significant710 S.L. Chisholm et al. / Accident Analysis and Prevention 40 (2008) 704–713
three sessions: session 1 (M = 37.90 s, S.E. = 2.99), ses-
sion 2 (M = 45.20 s, S.E. = 2.27), and session 3 (M = 42.50 s,
S.E. = 2.19) did not differ significantly, p > .05. As well, TCT
in session 4 (M = 30.88 s, S.E. = 2.90), session 5 (M = 27.57 s,
S.E. = 2.63), and session 6 (M = 28.67 s, S.E. = 2.11) did not
differ significantly from each other, p > .05. However, TCT in
sessions 2 and 3 were significantly longer than the last three
sessions, p < .05.
3.6.1.2. Easy iPod interactions. Time to complete task dif-
fered depending on the session, F(5, 87) = 12.42, p < .001.
Essentially, only session 2 (M = 6.80 s, S.E. = .45) had signif-
Fig. 5. Mean duration of glances (s) made into the vehicle by secondary task
icantly longer TCT times than all other sessions: session 1
and road type.
(M = 4.05 s, S.E. = .36), session 3 (M = 3.94 s, S.E. = .45), session
4 (M = 4.38 s, S.E. = .36), session 5 (M = 3.76 s, S.E. = 2.05), and
differences between the secondary task conditions on the urban session 6 (M = 3.54 s, S.E. = .43), p < .05.
(F(2, 29) = 2.71, p > .05), or freeway (F(2, 37) = 2.09, p > .05)
roads (Fig. 5). 4. Discussion and conclusion
3.5.2.2. In-vehicle. The in-vehicle AOI was defined as any This study examined the effects of repeated iPod interactions
glances that were made into the vehicle, whether at the iPod on driver performance to determine if performance decrements
device, center console, or speedometer. Mean glance durations decreased with practice. A multi-measure approach was used to
made into the vehicle, ostensibly at the iPod or speedome- understand the range of driver performance dimensions includ-
ter differed depending on secondary task, F(2, 38) = 52.46, ing hazard detection and response, lateral vehicle control, eye
p < .001. Longer glances were made in the difficult iPod condi- movements, and secondary task performance. A comprehen-
tion (M = 1.15 s, S.E. = .03) compared to the baseline (M = 0.54 s, sive and convergent view of the effects of distraction on driver
S.E. = .04) and easy iPod (M = 0.66 s, S.E. = .03) conditions, all performance with practice is evident.
of which differed significantly from each other, p < .05. Glances
made into the vehicle did not differ significantly depending on 4.1. Hazard detection
road type F(2, 220) = 2.20, p > .05.
iPod interactions impaired drivers’ ability to respond to
3.5.2.3. Off road. The off-road AOI was defined as any area sur- hazards on the roadway and maintain safe vehicle control.
rounding the roadway; including signs, buildings, parked cars, The difficult iPod interactions resulted in decrements to PRT.
and grass medians. Task difficulty did not have a significant Over the events and occurrence, PRT increased by 0.18 s or
effect mean glance durations made off road, F(2, 61) = 0.96, 16% over the baseline when performing the difficult iPod
p > .05. Nor did road type have an effect on off-road glances, task, depending on event type. During the difficult iPod inter-
F(2, 148) = 2.58, p > .05. actions, a 0.42 s increase in perception time was found for
the first occurrence over that of the baseline for the braking
3.6. Secondary task performance events.
Overall, a 16% increase in PRT was found for braking events
3.6.1. Task completion time (TCT) in the present study. However, a 26% increase in PRT during the
Time needed to complete each task was analyzed using difficult iPod interactions over the baseline was found for the first
SimObserver and Data Distillery and began when participants occurrence of the lead vehicle braking events. iPod interactions
made their first movement toward the device to begin the task are both cognitively and visually absorbing, requiring attention
until the task was completed. Because various songs were to be directed away from the roadway and to the interface.
required for each difficult iPod interaction, they differed in Second, when an event occurs, attention must be disengaged
their position in the menu system. Therefore, song position from the iPod back to the roadway. Many argue that prolonged
in the menu system was used as a covariate to account for glances away from the road pose increase crash risk (Dingus
differences in task time due to distance in the menu system. et al., 1989; Green, 2007; Klauer et al., 2006). Support for this
All analyses were performed on each of the secondary tasks argument is provided in this study by the higher frequency of
separately. Adjustments for violations of sphericity using the collisions while interacting with the difficult iPod tasks (53)
Greenhouse–Geisser correction are indicated with a GG next to than during either the easy iPod (34) or the baseline drives
certain results (Tabachnick and Fidell, 2006). (28).
During the easy iPod tasks, no consistent detrimental effects
3.6.1.1. Difficult iPod interactions. Task completion time were found. The easy iPod task took very little time to com-
(TCT) for the difficult iPod task differed by session, F(5, plete (M = 4.39 s). The average time to complete difficult iPod
270) = 9.94, p < .001. Task completion time in the first tasks was approximately 35 s. This difference in task completionS.L. Chisholm et al. / Accident Analysis and Prevention 40 (2008) 704–713 711
time had varying effects on driving performance. Specifically,
the longer difficult iPod tasks exhibited consistent detrimental
distraction effects, whereas the detrimental effects of the easy
iPod task were brief and transient.
While iPod interactions had a consistent detrimental effect on
hazard detection, vehicle control, however, was affected by the
difficult iPod task. Previous studies on cell phones (Shinar et al.,
2005) and speech-based e-mail (Jamson et al., 2004) found a sig-
nificant decrease in steering wheel variation while drivers were
engaged in conversations or e-mail, respectively. Participants in
this study had greater amounts of steering angle variability in
the difficult iPod condition than in the baseline. Cell phone con-
versations and speech based e-mail tasks do not require a driver
to physically manipulate something, and thus may not affect
steering per se. Therefore, the driver is able to focus on the road
and control the vehicle. Completion of the difficult iPod task,
however, required attention to be directed into the vehicle and
physical manipulations to be made. In particular, iPod interac- Fig. 6. Frequency of glances made into the vehicle and task completion time (s)
tions required attention to be focused, in a serial fashion, between for the easy iPod and difficult iPod interactions.
the iPod and the roadway to accomplish both tasks. On average,
it took approximately 17 glances into the vehicle to complete a
difficult iPod task. Multiple session studies do provide information with which
The largest eye movement effects occurred between the dif- to determine the practical effects of in-vehicle distractions over
ficult iPod and baseline conditions. Glance durations toward the time compared to single session designs. For instance, Shinar et
roadway during the difficult iPod task were 0.27 s shorter. Fur- al. (2005) found repeated trials of conversation with a cell phone
thermore, average duration of glances into the vehicle during lessened the performance decrement on the vehicle control mea-
difficult iPod tasks was 1.16 s compared to 0.54 s in the baseline. sures of speed maintenance, lane positioning, and steering wheel
This increase in glance duration is similar to previous findings deviations. Shinar et al. (2005) did not measure PRT or eye
(Green and Shah, 2004). Normal glances into the vehicle are movements in their study.
shorter in duration than glances towards the center of the road,
0.41 s and 0.73 s, respectively (Olson et al., 1989). Attention to 4.3. Distraction metrics
in-vehicle tasks caused other sources of driving information to
be dropped from scan patterns (i.e. off road objects and rearview Two metrics have been suggested to quantify distraction
mirror). A serial sampling between in-vehicle task and immedi- potential of in-vehicle devices. These include number of glances
ate forward roadway resulted (cf., Horrey et al., 2006; Wierwille, to the device and task completion time (Blanco et al., 2005;
1993). Green, 1999b). Tasks that require more than nine glances or
greater than 15 s to complete statically represent problematic
4.2. Prolonged experience tasks that should not be engaged while the vehicle is in motion.
As illustrated in Fig. 6, using the suggested metrics of task com-
The purpose of a multiple-session approach was to deter- pletion time and glance frequency, the easy iPod tasks (filled
mine if repeated practice of the secondary task while driving circles) conform to the suggested criteria of less than nine
in demanding contexts would lessen the detrimental impact of glances and 15 s completion time. However, the difficult iPod
the distraction on driver performance. The present study used results (open circles) took, on average, 17 glances and 35 s to
an event-based paradigm to examine the impact of a common complete the task. The difficult iPod interactions are clearly not
MP3 player on distraction. Although decreases in PRT were appropriate to perform while the vehicle is in motion.
found with practice, performance with the difficult iPod task
never achieved the same level of performance as in the base- 4.4. Conclusion
line condition. Even after additional practice, drivers were still
unable to improve their dual-task performance to a safe level. Complex multi-interaction tasks such as the difficult iPod task
This study found improvements in performance over the six in the present study impaired perception and response to hazards
sessions. However, it did not determine the extent of experience and increased the frequency of collisions. Difficult interactions
over which participants might continue to improve. Presumably also require numerous glances to be made into the vehicle and
a plateau or “ceiling” would be reached and no additional prac- prolonged interactions to complete.
tice would affect performance. Single session or cross-sectional Actual iPod use in-vehicles is likely to produce greater per-
studies may not provide an accurate picture of cumulative formance decrements than those recorded in this study. iPods
distraction effects. Results are likely to differ with driver are frequently placed in the lap of the driver or in the center
practice. cup holder. Interaction with it is accomplished by holding and712 S.L. Chisholm et al. / Accident Analysis and Prevention 40 (2008) 704–713
looking at it. These results are conservative estimates of actual Caird, J.K., Dewar, R.E., 2007. Driver distraction. In: Dewar, R.E., Olsen, R.
behaviour as task times did not include the time to pick up the (Eds.), Human Factors in Traffic Safety, 2nd ed. Lawyers & Judges Publish-
iPod or glances further into the vehicle. ing, Tucson, AZ, pp. 195–229.
Caird, J.K., Scialfa, C.T., Ho, G., Smiley, A., 2004. Effects of Cellular Tele-
Many vehicle manufacturers have made integration of iPods phones on Driving Behaviour and Crash Risk: Results of Meta-analysis.
into vehicles a necessary “lifestyle enhancement” capability. The CAA Foundation for Traffic Safety, Edmonton, AB.
multivariate results of this study suggest that access to difficult Casson, E.J., Recette, L., 2000. Vision standards for driving in Canada and the
iPod tasks while vehicles are in motion should be curtailed. United States. A review for the Canadian Opthalmological Society. Can. J.
Vehicle manufacturers and Apple, in cooperation, should lock Ophthalmol. 35, 192–203.
Chisholm, S., Caird, J.K., Teteris, E., Lockhart, J., Smiley, A., 2006.
out these functions, while the vehicle is in motion before legisla- Novice and experienced driver performance with cell phones. In: Pro-
tion to address this problem is required. Future research should ceedings of the 50th Annual Human Factors and Ergonomics Meeting.
identify related device functions (e.g., on other MP3 players, Human Factors and Ergonomics Society, Santa Monica, CA, pp. 2354–
Blackberries, iPhones, and so forth) that produce prolonged 2358.
glance behaviour and tasks interactions. Dingus, T.A., Antin, J.F., Hulse, M.C., Wierwille, W.W., 1989. Attentional
demand requirements of an automobile moving-map navigation system.
Transport. Res.: A 23A (4), 301–315.
Donmez, B., Boyle, L., Lee, J.D., Scott, G., 2006. Assessing differences in young
Acknowledgments
drivers’ engagement in distractions. In: Papers of the 80th Annual Trans-
portation Research Board Meeting [CD-ROM]. Transportation Research
Bill Horrey and another anonymous reviewer provided valu- Board, Washington, DC.
able guidance about the focus and clarity of this manuscript. Goodman, M.J., Bents, F.D., Tijerina, L., Wierwille, W., Lerner, N., Benel,
A debt of gratitude is owed to Elise Teteris and Lisa Fern for D., 1997. An Investigation of the Safety Implications of Wireless Commu-
nications in Vehicles (DOT HS 806-635). National Highway Transporta-
their assistance in the development, recruitment and running
tion Safety Administration, Washington, DC, http://www.nhtsa.dot.gove/
of participants, and data reduction. Don Kline, Saul Green- people/injury/research/wireless/.
berg and Chris Edwards keenly edited earlier versions of this Green, P., 2007. Where do drivers look while driving (and for how long)? In:
manuscript. Mike Boyle programmed several real time and data Dewar, R.E., Olson, R. (Eds.), Human Factors in Traffic Safety, 2nd ed.
reduction modules. Tak Fung provided statistical consultation on Lawyers & Judges Publishing, Tucson, AZ, pp. 57–82.
Green, P., 1999a. Visual and task demands on driver information systems
several aspects of the experimental design. Funding for scenario
(UMTRI Tech. Rep. No. 98-16). University of Michigan, Transportation
development, experimental execution, participant payment, data Research Institute, Ann Arbor.
reduction, and statistical analyses was provided by the AUTO21 Green, P., 1999b. The 15-second rule for driver information systems. In: Pro-
Network of Centres of Excellence (NCE) and the University of ceedings of the ITS America 9th Annual Meeting. ITS America, Washington,
California at Berkeley/PATH. An abstract of this paper was pre- DC.
Green, P., Shah, R., 2004. Safety Vehicles Using Adaptive Interface Technology
sented at the 4th International Driving Symposium on Human
(Task 6): Task Time and Glance Measures of the Use of Telematics: A
Factors in Driving Assessment, Training, and Vehicle Design in Tabular Summary of the Literature. University of Michigan, Transportation
Stevenson, WA. Research Institute, Ann Arbor, MI.
Horrey, W.J., Wickens, C.D., 2006. Examining the impact of cell phone con-
versations on driving using meta-analytic techniques. Hum. Factors 48 (1),
References 196–205.
Horrey, W.J., Wickens, C.D., Consalus, K.P., 2006. Modeling drivers’ visual
Ålm, H., Nilsson, L., 1994. Changes in driver behaviour as a function of attention allocation while interacting with in-vehicle technologies. J. Exp.
handsfree mobile phones—a simulator study. Accid. Anal. Prev. 26 (4), Psychol.: Appl. 12 (2), 67–78.
441–451. Hosking, S.G., Young, K.L., Regan, M.A., 2005. The effects of text messaging
Ålm, H., Nilsson, L., 1995. The effects of a mobile telephone task on driver on young novice driver performance (Final Rep.). The National Roads and
behaviour in a car following situation. Accid. Anal. Prev. 27 (5), 707–715. Motorists’ Association Motoring Services, Melbourne, Australia.
Applied Sciences Laboratory, 2001. Eyenal Manual (v. 2.0). Applied Sciences International Standards Organization, 2002. Road Vehicles—Measurement
Laboratory, Bedford, MA. of Driver Visual Behaviour with Respect to Transport Information
Blanco, M., Hankey, J.M., Chestnut, J.A., 2005. A taxonomy for secondary in- and Control Systems. Part 1. Definitions and Parameters, ISO Com-
vehicle tasks based on eye glance and task completion time. In: Proceedings mittee Standard 15007-1. International Standard Organization, Geneva,
of the 49th Annual Meeting of the Human Factors and Ergonomics Soci- Switzerland.
ety. Human Factors and Ergonomics Society, Santa Monica, CA, pp. 1975– Ishihara, S., 1993. Ishihara’s Test for Colour-blindness. Kanehara, Tokyo.
1979. Jamson, A.H., Westerman, S.J., Hockey, G.R., Carsten, M.J., 2004. Speech
Brookhuis, K.A., De Vries, G., De Waard, D., 1991. The effects of based e-mail and driver behaviour: effects of an in-vehicle message system
mobile telephoning on driving performance. Accid. Anal. Prev. 23 (4), interface. Hum. Factors 46 (4), 625–639.
309–316. Klauer, S.G., Dingus, D.R., Neale, T.A., Sudweeks, J., Ramsey, D.J., 2006.
Brown, I.D., Tickner, A.H., Simmonds, D.C.V., 1969. Interference between The impact of driver inattention on near-crash/crash risk: an analysis using
concurrent tasks of driving and telephoning. J. Appl. Psychol. 53 (5),419– the 100-car naturalistic study data (Rep. No. DOT HS 810 594). National
424. Highway Traffic Safety Administration, Washington, DC.
Caird, J.K., Chisholm, S., Lockhart, J., 2008. The effect of in-vehicle advanced Lee, J.D., Caven, B., Haake, S., Brown, T.L., 2001. Speech based interaction
signs on older and younger drivers’ intersection performance. Int. J. Human with in-vehicle computers: the effect of speech based e-mail on drivers’
Comput. Stud. 66, 132–144. attention to the roadway. Hum. Factors 43, 631–640.
Caird, J.K., Chisholm, S.C., Lockhart, J., Vacha, N., Creaser, J.I., Edwards, C.J., McEvoy, S.P., Stevenson, M.R., McCartt, A.T., Woodward, M., Haworth, C.,
et al., 2006. In-vehicle intelligent transportation system (ITS) countermea- Palamara, P., Cercarelli, R., 2005. Role of mobile phones in motor vehicle
sures to improve older driver intersection performance (Rep. No. 14610e). crashes resulting in hospital attendance: a case-crossover study. Br. Med. J.,
Transportation Development Centre, Transport Canada, Montreal. bmj.com.S.L. Chisholm et al. / Accident Analysis and Prevention 40 (2008) 704–713 713
Olson, P.L., Battle, D.S., Aoiki, T., 1989. Driver eye fixations under different Shinar, D., Tractinsky, N., Compton, R., 2005. Effects of practice, age, and task
operating conditions (Tech Rep. No. UMTRI-89-3). University of Michigan demands on interference from a phone task while driving. Accid. Anal. Prev.
Transportation Research Institute, Ann Arbor. 37 (3), 315–326.
Olson, P.L., Farber, E., 2003. Forensic Aspects of Perception and Response, 2nd Strayer, D.L., Drews, F.A., 2004. Profiles in driver distraction: effects of cell
ed. Lawyers and Judges Publishing, Tucson, AZ. phone conversation on younger and older drivers. Hum. Factors 46 (4),
Parkes, A., Hööijmeijer, V., 2001. Driver situational awareness and car phone 640–649.
use. In: Proceedings of the 1st Human-Centered Transportation Simulation Stutts, J., Feaganes, J., Reinfurt, D., Rodgman, E., Hamlett, C., Gish, K., et al.,
Conference. University of Iowa, Iowa City, IA (ISSN 1538-3288). 2005. Driver’s exposure to distractions in their natural driving environment.
Recarte, M.A., Nunes, L.M., 2000. Effects of verbal and spatial imagery tasks Accid. Anal. Prev. 37, 1093–1101.
on eye fixations while driving. J. Exp. Psychol.: Appl. 6, 31–43. Stutts, J.C., Reinfurt, D.W., Staplin, L., Rodgman, E.A., 2001. The
Recarte, M.A., Nunes, L.M., 2003. Mental workload while driving: effects on Role of Driver Distraction in Traffic Crashes. AAA Foundation for
visual search, discrimination, and decision making. J. Exp. Psychol.: Appl. Traffic Safety, Washington, DC, http://www.aaafoundation.org/projects/
9 (2), 119–137. index.cfm?button=distraction.
Redelmeier, D.A., Tibshirani, R.J., 1997. Association between cellular- Tabachnick, B.G., Fidell, L.S., 2006. Using Multivariate Statistics, 5th ed. Allyn
telephone calls and motor vehicle collisions. New Engl. J. Med. 336 (7), and Bacon, Boston, MA.
453–458. Wierwille, W.W., 1993. An initial model of visual sampling of in-car displays
Scialfa, C.T., Adams, E., Giovanetto, M., 1991. Reliability of the Vistech contrast and controls. In: Gale, A.G., et al. (Eds.), Vision in Vehicles IV. Elsevier
test system in a life-span sample. Optom. Vis. Sci. 68, 270–274. Science, Amsterdam, pp. 271–279.You can also read