The El Niño event of 2015-2016: climate anomalies and their impact on groundwater resources in East and Southern Africa - HESS
←
→
Page content transcription
If your browser does not render page correctly, please read the page content below
Hydrol. Earth Syst. Sci., 23, 1751–1762, 2019
https://doi.org/10.5194/hess-23-1751-2019
© Author(s) 2019. This work is distributed under
the Creative Commons Attribution 4.0 License.

The El Niño event of 2015–2016: climate anomalies and their
impact on groundwater resources in East and Southern Africa
Seshagiri Rao Kolusu1 , Mohammad Shamsudduha2,3 , Martin C. Todd1 , Richard G. Taylor2 , David Seddon2 ,
Japhet J. Kashaigili4 , Girma Y. Ebrahim5 , Mark O. Cuthbert2,6 , James P. R. Sorensen7 , Karen G. Villholth5 ,
Alan M. MacDonald8 , and Dave A. MacLeod9
1 Department    of Geography, University of Sussex, Brighton, BN1 9QS, UK
2 Department    of Geography, University College London, Gower Street, London, WC1E 6BT, UK
3 Institute for Risk and Disaster Reduction, University College London, Gower Street, London, WC1E 6BT, UK
4 Sokoine University of Agriculture, Morogoro, Tanzania
5 International Water Management Institute, Pretoria, South Africa
6 School of Earth and Ocean Sciences, Cardiff University, Main Building, Park Place, Cardiff, CF10 3AT, UK
7 British Geological Survey, Maclean Building, Crowmarsh Gifford, Wallingford, Oxfordshire, OX10 8BB, UK
8 British Geological Survey, The Lyell Centre, Research Avenue South, Edinburgh, EH14 4AP, UK
9 Atmospheric, Oceanic and Planetary Physics, University of Oxford, Oxford, OX1 3PU, UK

Correspondence: Seshagiri Rao Kolusu (s.kolusu@sussex.ac.uk, seshukolusu@gmail.com)

Received: 3 October 2018 – Discussion started: 8 October 2018
Revised: 16 January 2019 – Accepted: 13 March 2019 – Published: 29 March 2019

Abstract. The impact of climate variability on groundwater      SPEI drought event. These surface water balance deficits
storage has received limited attention despite widespread de-   suppressed groundwater recharge, leading to a substantial
pendence on groundwater as a resource for drinking water,       groundwater storage decline indicated by both GRACE satel-
agriculture and industry. Here, we assess the climate anoma-    lite and piezometric data in the Limpopo basin. Conversely,
lies that occurred over Southern Africa (SA) and East Africa,   over EASE during the 2015–2016 El Niño event, anoma-
south of the Equator (EASE), during the major El Niño event     lously wet conditions were observed with an estimated return
of 2015–2016, and their associated impacts on groundwater       period of ∼ 10 years, likely moderated by the absence of a
storage, across scales, through analysis of in situ groundwa-   strongly positive Indian Ocean zonal mode phase. The strong
ter piezometry and Gravity Recovery and Climate Experi-         but not extreme rainy season increased groundwater stor-
ment (GRACE) satellite data. At the continental scale, the      age, as shown by satellite GRACE data and rising ground-
El Niño of 2015–2016 was associated with a pronounced           water levels observed at a site in central Tanzania. We note
dipole of opposing rainfall anomalies over EASE and South-      substantial uncertainties in separating groundwater from to-
ern Africa, north–south of ∼ 12◦ S, a characteristic pattern    tal water storage in GRACE data and show that consistency
of the El Niño–Southern Oscillation (ENSO). Over South-         between GRACE and piezometric estimates of groundwater
ern Africa the most intense drought event in the histori-       storage is apparent when spatial averaging scales are com-
cal record occurred, based on an analysis of the cross-scale    parable. These results have implications for sustainable and
areal intensity of surface water balance anomalies (as rep-     climate-resilient groundwater resource management, includ-
resented by the standardised precipitation evapotranspiration   ing the potential for adaptive strategies, such as managed
index – SPEI), with an estimated return period of at least      aquifer recharge during episodic recharge events.
200 years and a best estimate of 260 years. Climate risks are
changing, and we estimate that anthropogenic warming only
(ignoring changes to other climate variables, e.g. precipita-
tion) has approximately doubled the risk of such an extreme

Published by Copernicus Publications on behalf of the European Geosciences Union.
1752                                                  S. R. Kolusu et al.: The El Niño event of 2015–2016: climate anomalies

1   Introduction                                                   locations and domains that represent the rainfall anomaly
                                                                   gradient over EASE and SA associated with characteristic
The El Niño–Southern Oscillation (ENSO) phenomenon is              El Niño response, exemplified by the event of 2015–2016.
the dominant single driver of inter-annual climate variability     Beyond a few site-specific studies, the impacts of larger-scale
and large-scale extremes across the tropics, including much        climate extremes on groundwater remain substantially unre-
of Africa. Few studies have investigated the hydrological im-      solved. This hinders our ability to determine acceptable lev-
pacts of ENSO events on groundwater. Here, we quantify cli-        els of groundwater abstraction and depletion. This study aims
mate anomalies and groundwater resources over East Africa,         to quantify and understand the responses, during the 2015–
south of the Equator (EASE), and Southern Africa (SA) dur-         2016 El Niño of (i) the surface or terrestrial water balance
ing the recent major El Niño event of 2015–2016, which was         and (ii) groundwater storage over EASE and SA from re-
one of the strongest on record in the Pacific sector. El Niño is   gional to local scales. Further, it seeks to place the 2015–
typically associated with wet and dry anomalies over EASE          2016 El Niño event statistically in the historical context.
and SA, respectively (Ropelowski and Halpert, 1987), but
with considerable diversity in this response among El Niño
events, in part related to the many other drivers of variabil-     2     Data and methods
ity active over EASE and SA (Sect. S1 in the Supplement).
Much of SA experienced extreme drought in 2015–2016,               2.1    Climate data and analysis
with severe impacts on local food security, livelihoods and
key sectors of the economy (SADC, 2016a, b; Archer et al.,         We analyse data over the broad region of Africa that lies to
2017; Siderius et al., 2018; Sect. S1).                            the south of the Equator and over an extended austral summer
   Groundwater is the dominant source of safe water for ru-        wet season of October–April, which encompasses the full
ral populations and many expanding cities in EASE and SA           wet season over SA (excluding the Cape region) and those
(MacDonald et al., 2012); in drylands, groundwater is often        parts of EASE (south of ∼ 5◦ S) which experience a similarly
the only perennial source of water. Although relatively un-        annual unimodal rainfall regime (Dunning et al., 2016), and
derdeveloped to date, groundwater resources are being de-          will accommodate the response time of groundwater systems
veloped rapidly in Africa (Taylor et al., 2009; Calow et al.,      to climate. This region also experiences a coherent ENSO
2010; Villholth, 2013) and are featured prominently in na-         signal (Sect. 3.1).
tional development plans, especially to satisfy the need for          We use the standardised precipitation evapotranspiration
increased access to safe water and agricultural intensification    index (SPEI; Vicente-Serrano et al., 2010), which is a simple
under rapidly growing populations and economic develop-            representation of surface water balance anomalies, derived
ment. Groundwater is especially important in Africa, where         over this 7-month season (SPEI-7) over the period from 1901
surface runoff efficiency is lower than elsewhere (McMahon         to present using precipitation data from the Global Precip-
et al., 1987) and drinking untreated surface water is associ-      itation Climatology Centre (GPCC) monthly product ver-
ated with poor health (Hunter et al., 2010). The long-term         sion 7 (Schneider et al., 2011, 2014) at 1.0◦ resolution. To
viability of groundwater withdrawals and the livelihoods and       account for uncertainty in estimation of potential evapotran-
ecosystems that groundwater sustains depend on recharge.           spiration (PET), we use three parameterisations of varying
   Unlike surface water, research evaluating associations be-      complexity: the Penman–Monteith equation, based on net ra-
tween groundwater storage and ENSO, or indeed other                diation, temperature, wind speed and vapour pressure); the
modes of climate variability, is rather limited (e.g. Hol-         Hargreaves equation, based on mean, minimum and maxi-
man et al., 2011; Kuss and Gurdak, 2014), despite evidence         mum temperature, and extraterrestrial solar radiation; and the
that climate variability and extreme rainfall preferentially       Thornthwaite equation, which is based solely on surface air
drive or restrict groundwater recharge. Several studies have       temperature. The variables required for the various PET esti-
shown recharge to be episodic in semi-arid regions of Africa       mates are obtained from the CRU TS3.24.01 dataset (Harris
(Meyer, 2005; van Wyk et al., 2011; Taylor et al., 2013;           et al., 2014). Note that some findings will be sensitive to this
Cuthbert et al., 2017) and elsewhere (Jasechko and Tay-            choice of drought index.
lor, 2015; Cuthbert et al., 2016), highlighting the need to           SPEI-7 anomalies are analysed for two large subdomains,
understand patterns and drivers of climate variability, both       specifically EASE (4–12◦ S, 30–40◦ E) and SA (10–35◦ S,
temporally and spatially, that influence recharge. Bonsor et       10–40◦ E), which encompass the anomalous wet and dry
al. (2018) analysed recent (2002–2016) trends in, and sea-         dipole conditions, respectively, that are typically experienced
sonality of, groundwater storage within 12 African sedimen-        during El Niño events (Fig. S1b in the Supplement) and were
tary basins implied from Gravity Recovery and Climate Ex-          specifically experienced in 2015–2016 (Fig. 1a). For each do-
periment (GRACE) satellite data. Here, we employ evidence          main, the areal extent and intensity of SPEI-7 in each year
from both in situ observations (piezometry) and GRACE              of the record was characterised using intensity–areal-extent–
satellite data to examine the effect of large-scale inter-annual   frequency (IAF) curves of Mishra and Cherkauer (2010). IAF
climate anomalies on groundwater across spatial scales for         curves show the mean SPEI-7 value of grid cells lying within

Hydrol. Earth Syst. Sci., 23, 1751–1762, 2019                                    www.hydrol-earth-syst-sci.net/23/1751/2019/
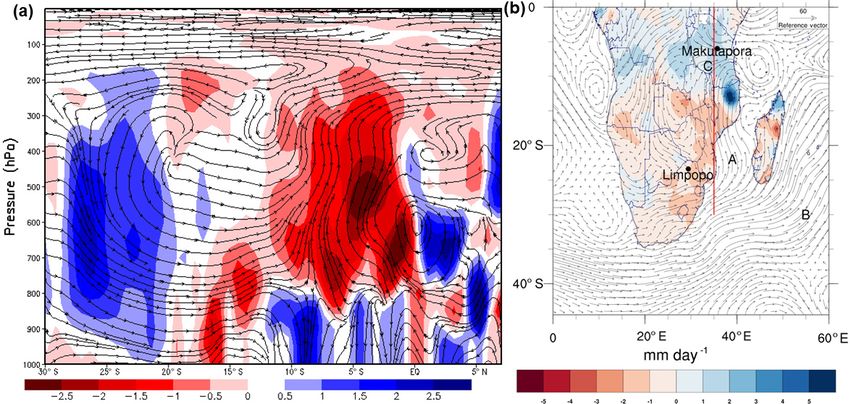
S. R. Kolusu et al.: The El Niño event of 2015–2016: climate anomalies                                                               1753

Figure 1. Large-scale climate anomalies over the study region for October–April 2015–2016. (a) SPEI-7. (b) Anomalies of the 80th percentile
of daily TRMM rainfall (mm day−1 ). Boxes in (a) show the EASE (small box) and SA (large box) domains used in the SPEI-7 IAF analysis
(see Sects. 2.1 and S2). The piezometer observation locations are also shown.

various areal extent intervals: the areas covered by the lowest         Tropical Rainfall Monitoring Mission (TRMM) 3B42 prod-
(for SA) or highest (for EASE) 5th, 10th, 20th . . . 100th areal        uct during the October–April season (1997–2016). In the ab-
percentiles of SPEI-7 grid cell values within the domain area,          sence of robust knowledge of actual rainfall thresholds as-
i.e. when all grid cells are ranked. The SPEI-7 IAF curves              sociated with groundwater recharge, and the likelihood that
allow comparison between years, irrespective of the precise             such thresholds are highly variable in space and time, we de-
spatial location of dry and wet anomalies within the domain.            rive the 80th percentile of daily rainfall within the season, at
This comparison includes estimating the return period of the            each grid cell, as a coarse proxy for rainfall events likely to be
SPEI-7 IAF curve observed during the 2015–2016 El Niño                  associated with recharge. Our results (Sect. 3.1.1) are largely
and other El Niño events. This is achieved by comparing                 insensitive to the choice of percentile value (not shown).
these observed SPEI-7 IAF curves to curves representing var-            We derived the value of the 80th percentile from all the
ious benchmark return periods, derived using a block maxi-              October–April data and then just for the 2015–2016 season
mum method applied to SPEI-7 data from a large ensemble                 and show the anomalies. Finally, information on the large-
of climate model runs (see Sect. S2).                                   scale atmospheric circulation is diagnosed from the hori-
   It is likely that anthropogenic climate change is, and will          zontal and vertical winds and specific humidity from ERA-
continue to, affect large-scale hydrology (Bindoff et al.,              Interim reanalysis data (Dee et al., 2011). Sea surface tem-
2013). Here we estimate the effects purely of anthropogenic             perature (SST) data are obtained from the Extended Recon-
temperature trends on drought risk over SA through a sim-               structed Sea Surface Temperature (ERSST) version 4 from
plified attribution experiment. The SPEI-7 IAF return period            the National Oceanographic and Atmospheric Administra-
analysis above is repeated, but with respect to benchmark re-           tion (NOAA; Smith et al., 2008) on a 2◦ grid.
turn period IAF curves for which the temperature data, used
in calculating PET, have the signal of anthropogenic climate            2.2   Groundwater storage estimates from GRACE
change removed (see Sect. S2). As such, the return period                     satellite data
of the SPEI-7 IAF curve for 2015–2016 is estimated in the
context of the “real historical” world and for comparison in            Regional-scale changes in groundwater storage (GWS;
the context of a counterfactual climate with only natural vari-         2002–2016) are estimated from GRACE satellite measure-
ability in temperature.                                                 ments of total terrestrial water storage (TWS) anomalies by
   There is evidence to indicate that recharge is preferen-             subtracting changes in the other terrestrial stores, which, in
tially driven by intense rainfall (see references in Sects. 1           our tropical region, comprise soil moisture (SMS) and sur-
and 3.1.1). To examine the nature of rainfall intensities over          face water (SWS) stores (Eq. 1), estimated from land surface
EASE during the El Niño 2015–2016 event we derive per-                  model (LSM) simulations, in the absence of in situ 1SMS
centiles of the daily rainfall probability distribution from the        and 1SWS data in the study areas:

www.hydrol-earth-syst-sci.net/23/1751/2019/                                           Hydrol. Earth Syst. Sci., 23, 1751–1762, 2019
1754 S. R. Kolusu et al.: The El Niño event of 2015–2016: climate anomalies
an aquifer comprising deeply weathered granite overlain by
1GWS = 1TWS − (1SMS + 1SWS), (1) alluvium (Taylor et al., 2013). Data from three sites in the
well field met the data quality criteria and are averaged
where 1 refers to the anomaly with respect to the long- together; mean groundwater-level time series records were
term data series. To help with interpretation of the mean converted to monthly anomalies in GWS using an in situ de-
1GWS signals, we also present the total uncertainty in es- rived specific yield (Sy ) value of 0.06 (Taylor et al., 2013).
timates of 1GWS, which results from the uncertainty in We estimate that these data are representative of groundwa-
estimates of 1TWS, 1SMS and 1SWS. Regarding un- ter levels across an area of ∼ 60 km2 . (ii) In the Limpopo
certainty in 1TWS associated with different GRACE pro- basin in Southern Africa (∼ 28 to 32◦ E, 22.5 to 25◦ S),
cessing strategies, we apply an ensemble mean of three groundwater-level records from 40 stations within weathered
GRACE 1TWS estimates, namely the CSR land (ver- hard-rock (“basement”) aquifers in sub-basins A6 (Mogalak-
sion RL05.DSTvSCS1409; Swenson and Wahr, 2006; Lan- wena), A7 (Sand), A8 (Nzhelele) and A9 (Luvuvhu) of the
derer and Swenson, 2012) and JPL Global Mascon (ver- Limpopo basin were collated from the Department of Wa-
sion RL05M_1.MSCNv01; Watkins et al., 2015; Wiese ter and Sanitation (Directorate: Surface and Groundwater In-
et al., 2015) solutions from NASA’s GRCTellus data dis- formation), South Africa. The data were first standardised
semination site (http://grace.jpl.nasa.gov/data, last access: then averaged together and represent an area estimated to be
27 March 2019) and a third GRGS GRACE solution ∼ 47 000 km2 . For both sites, daily to monthly groundwater-
(CNES–GRGS release RL03-v1; Biancale et al., 2006) from level records within our common study period from Au-
the French governmental space agency, Centre National gust 2002 to July 2016 were checked for consistency (miss-
d’Études Spatiales (CNES). Further information on the pro- ing data less than 10 %) and selected for groundwater storage
cessing involved in each product is provided in Sect. S3. analysis. Mean groundwater-level time series records were
The monthly GRACE 1TWS data are interpolated to a ∼ 1◦ converted to monthly anomalies in GWS using an Sy value
grid for analysis in Eq. (1). For analysis of GRACE 1TWS that produced the lowest root-mean-square error between in
data at the locations of the two groundwater-level monitoring situ and GRACE GWS; the applied value (0.025) is consis-
sites of interest (Makutapora and Limpopo; see below), the tent with that estimated for basement aquifers in Africa by
monthly 1TWS time series are generated by averaging over MacDonald et al. (2012).
a 200 km radial buffer (i.e. area equivalent of ∼ 120 000 km2 ) We acknowledge that our estimates of GWS from piezom-
around each location. etry may be influenced by abstractions, and we provide data
Further, to account for uncertainty in 1SMS and 1SWS, on pumping rates from Makutapora (Fig. 5c). A numerical
we use data from four LSMs within NASA’s Global Land method to remove the effects of pumping is currently the
Data Assimilation System (GLDAS) and provide the asso- subject of ongoing research by the authors, so in this case
ciated uncertainty ranges for each term. GLDAS is an un- we infer the effect of pumping on GWS only in only relative
coupled land surface modelling system that includes multiple qualitative terms. Equivalent direct data on direct pumping
global LSMs driven by surface meteorology from the NCEP rates are not available at Limpopo. However, we note that Cai
data assimilation system, CMAP-disaggregated precipitation et al. (2017) mapped the spatial extent of irrigation across the
and the Air Force Weather Agency satellite-derived radiation Limpopo basin in South Africa using satellite data and esti-
fields (Rodell et al., 2004). The four GLDAS LSMs are as mated that irrigation from groundwater provides about 50 %
follows: the Community Land Model (CLM, version 2; Dai of the irrigated areas over 2 % of the land area, which likely
et al., 2003), NOAH (version 2.7.1; Ek et al., 2003), the Vari- influences groundwater storage locally.
able Infiltration Capacity (VIC) model (version 1.0; Liang
et al., 2003) and MOSAIC (version 1.0; Koster and Suarez,
1992). Further discussion of the uncertainty in these individ- 3 Results and discussion
ual water balance components (Fig. S2), and further informa-
tion on the LSMs, is provided in Sect. S3. 3.1 Climate anomalies over EASE and SA during the
2015–2016 El Niño event
2.3 Groundwater storage estimates from piezometric
observations 3.1.1 EASE and SA climate anomalies
Groundwater-level time series records were compiled in two The 2015–2016 El Niño was the second strongest event
areas situated at the heart of the EASE and SA ENSO rain- within the available ∼ 165-year Pacific Ocean SST record,
fall dipole centres of action (Fig. 1a). (i) In the Makuta- with SST anomalies exceeding 2 ◦ C for 6 months from Oc-
pora well field (35.75◦ E, 5.90◦ S) site in central Tanzania tober 2015 (Fig. S1d). By some measures 2015–2016 was
in East Africa, groundwater records were collated from the the strongest El Niño since 1950 (Sect. S1). Many of the ob-
Ministry of Water and Irrigation and the Dodoma Urban Wa- served climate anomalies around the world were typical of
ter Supply, Tanzania. Here, groundwater is abstracted from El Niño years (Blunden and Arndt, 2016). Over our study
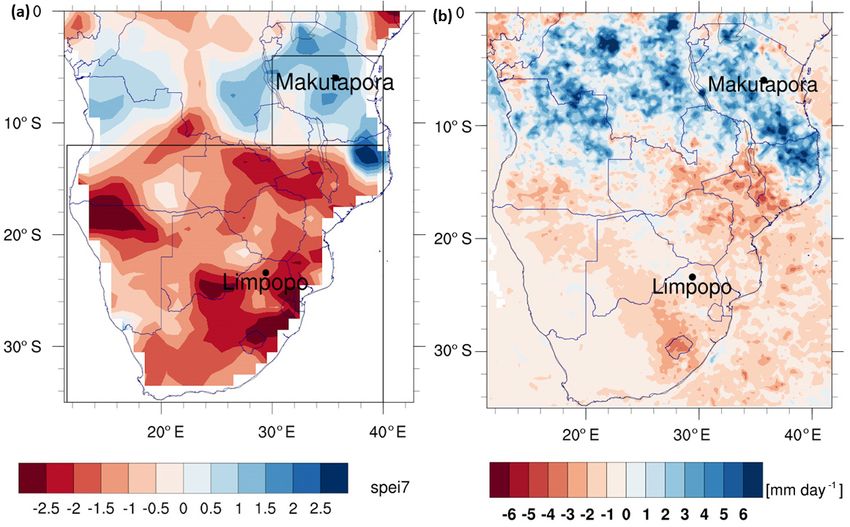
Hydrol. Earth Syst. Sci., 23, 1751–1762, 2019 www.hydrol-earth-syst-sci.net/23/1751/2019/S. R. Kolusu et al.: The El Niño event of 2015–2016: climate anomalies 1755 Figure 2. Circulation anomalies for October–April 2015–2016. (a) Latitude versus height transect plot of anomalous meridional overturning circulation (streamlines of vertical and meridional wind) and vertical velocity anomalies (m s−1 ; shaded) averaged over the 35–37◦ E. This latitude transect is shown as a red line on the map in (b). (b) Vertically integrated moisture flux anomalies (g kg−1 m s−2 ; vectors) and rainfall anomalies (mm day−1 ; shaded). region, a pronounced north–south dipole in SPEI-7 anoma- vection, with compensating descent over SA throughout the lies was observed (Fig. 1a), indicating intense and exten- depth of the troposphere, which acts to suppress convection. sive drought over SA (negative SPEI-7) and the wetter-than- The low-level horizontal circulation (Fig. 2b) indicates key normal conditions over EASE (positive SPEI-7). In detail, features associated with the SPEI-7 dipole, notably (i) an most of SA south of 10◦ S experienced a substantial water anomalous southerly flow from the southern Indian Ocean balance deficit: exceptional drought (SPEI < −2) conditions into continental SA (feature A in Fig. 2b), which weakens were experienced over extensive parts of northern South the transport of water vapour from the humid tropical In- Africa and northern Namibia, southern Botswana and Zam- dian Ocean, leading to a decrease in moisture flux conver- bia, and most of Zimbabwe and southern Mozambique and gence over SA. This is associated with a weakening of the Malawi (Fig. 1a). Most of EASE experienced above-average mean “Mascarene” subtropical high over the Southern In- rainfall during this period, with SPEI values > 1 across most dian Ocean (feature B in Fig. 2b). (ii) Over EASE there of Tanzania and a localised exceptionally wet region over are anomalous low-level westerlies over Tanzania (feature C the northernmost part of Mozambique. The Makutapora and in Fig. 2b), which weaken the mean easterlies and enhance Limpopo sites (Fig. 1a) are located in areas representative of convergence over Tanzania, a structural characteristic of wet the large-scale north–south rainfall dipole. spells (Berhane and Zaitchik, 2014; Nicholson, 2017). This spatial dipole pattern is very similar to the character- Groundwater recharge in the semi-arid tropics is favoured istic pattern of anomalies during El Niño across the region, by high-intensity rainfall events (Owor et al., 2009; Jasechko as represented by the leading empirical orthogonal func- and Taylor, 2015) within wet seasons, which may be modu- tion (EOF) of inter-annual variability (Fig. S1b; Sect. S1), lated by climate anomalies during El Niño conditions. Dur- which correlates strongly with ENSO and Indian Ocean SSTs ing 2015–2016, the intensities of the 80th percentile of daily (Fig. S1c). Indeed, the EOF coefficient value for 2015–2016 rainfall, a simple proxy of potential groundwater-recharge- is the second highest within the entire 1901–2016 period. relevant rainfall, increased by ∼ 1–5 mm day−1 across much As such, across our study region, 2015–2016 represents an of EASE (Fig. 1b), representing a 100 %–150 % increase extreme exemplar of the characteristic El Niño climate re- in many places. Whilst the association of rainfall intensity sponse. Of course, a complex set of processes on the plan- and enhanced recharge across large and heterogeneous re- etary, regional and local scale related to, and independent gions remains to be resolved, this intensification of rainfall of, El Niño are fully responsible for the observed anomalies is consistent with greater groundwater recharge. Across SA (e.g. Blamey et al., 2018). The structure of the atmospheric the magnitude of the 80th percentile reduced by ∼ 1– anomalies, specifically the mean meridional overturning cir- 2 mm day−1 , potentially reducing groundwater recharge. culation associated with the large-scale SPEI-7 anomalies (Fig. 2a), shows large-scale anomalous ascent over EASE between ∼ 0 and 10◦ S, indicative of enhanced deep con- www.hydrol-earth-syst-sci.net/23/1751/2019/ Hydrol. Earth Syst. Sci., 23, 1751–1762, 2019
1756 S. R. Kolusu et al.: The El Niño event of 2015–2016: climate anomalies
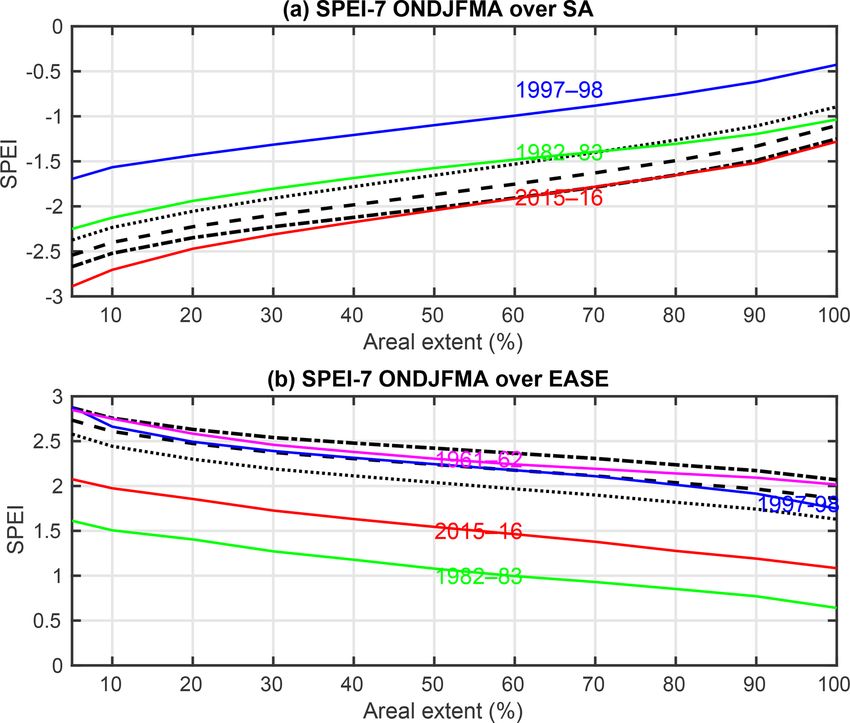
3.1.2 The 2015–2016 event in the historical context
SPEI-7 IAF curves represent water balance anomalies across
all spatial scales. For the SA region, 2015–2016 experi-
enced the most extreme SPEI-7 drought within the histor-
ical period, with an estimated IAF curve return period of
∼ 260 years (range 190–290 years; Fig. 3a). The 2015–
2016 drought was of greater intensity than those during
previous El Niño events of comparable magnitude, 1997–
1998 and 1982–1983, whose SPEI-7 IAF curve return pe-
riods are estimated to be only ∼ 6 years (range 4–9 years)
and ∼ 43 years (range 35–47 years), respectively. The con-
trasting intensity of SA drought between these events high-
lights the diversity in responses over EASE and SA to
El Niño, related to both the different character of the events
in the Pacific sector (2015–2016 was strongest in the central
rather than eastern Pacific as in 1997–1998; see Sect. S1)
and the specific regional circulation features during these
events which modulate the diverse ENSO teleconnections Figure 3. Intensity–areal-extent–frequency (IAF) curves (see
to SA (Ratnam et al., 2014; Blamey et al., 2018). More- Sects. 2.1 and S2 for details of method) estimated from the sea-
sonal mean SPEI-7 (derived with Penman–Monteith PET; see text
over, the 2015–2016 drought followed a moderate drought
for uncertainty ranges) over (a) the Southern Africa domain (10.5–
in 2014–2015 (Blamey et al., 2018), which had important 35.5◦ S; see box in Fig. 1a) and (b) the East Africa domain (30–
implications for groundwater levels (Sect. 3.2.2), and sta- 40◦ E, 4–12◦ S; see box in Fig. 1a). On the x axis is the areal extent
tistically this 2-year drought event is remarkably unlikely. over which the SPEI is averaged, and on the y axis is the SPEI-
The extreme SPEI-7 anomalies over SA in 2015–2016 result 7 drought intensity. Solid coloured lines show the IAF curves for
from low rainfall and extremely high temperatures (Blunden the study El Niño event years: 2015–2016 (red), 1997–1998 (blue),
and Arndt, 2016; Russo et al., 2016), potentially related to 1982–1983 (green) and (in b only) the 1961–1962 Indian Ocean
land–atmosphere feedback processes (e.g. Seneviratne et al., zonal mode event (purple). Black lines are the IAF curves for se-
2010), through reduced vegetation and soil moisture, perhaps lected benchmark return periods (from top to bottom in a and bot-
persisting from 2014–2015. Uncertainty in the strength of tom to top in b): 50 years (dotted), 100 years (dashed) and 200 years
land–atmosphere coupling over SA remains high with con- (dotted–dashed).
tradictory results from model analyses (e.g. Koster et al.,
2006) and combined observation–model analysis (Ferguson
itive IOZM event, unlike that of 2015–2016, in which the
et al., 2012), suggesting weak and strong coupling, respec-
IOZM was weakly positive. Indeed, the wettest EASE year
tively. Further, warming across SA in recent decades can
on record, 1961–1962, experienced a very strongly positive
be attributed substantially to anthropogenic radiative forcing
IOZM event but no El Niño event (Nicholson, 2015).
(Bindoff et al., 2013). As such climate risks are changing.
We estimate that the risk of a 2015–2016 magnitude SPEI-7 3.2 Impact of 2015–2016 climate anomalies on
drought over SA increased by approximately 2 times due to groundwater storage
the effects purely of anthropogenic warming. Note that this
estimate does not include any anthropogenic changes in any 3.2.1 Large-scale estimates of 1TWS, 1SMS, 1SWS
of the other climate variables which determine SPEI, most and 1GWS
notably precipitation, nor changes in variability of climate
(see Sect. S2). Further, other drought indices may have dif- Regionally, GRACE ensemble-mean 1TWS anomalies
fering sensitivities to anthropogenic temperature trends. (Fig. 4a), and estimated 1GWS (Eq. 1; Fig. 4d), for 2015–
Over the EASE domain as a whole, the 2015–2016 event 2016 reflect the north–south dipole over EASE and SA asso-
was wet but not extreme, with an return period estimated ciated with the SPEI-7 climate anomalies related to El Niño
by the SPEI-7 IAF curve (Fig. 3b) of only ∼ 10 years (Fig. 1a). Positive 1TWS and 1GWS anomalies exist north
(range: 5–12 years). The anomalies were far weaker than of ∼ 10◦ S across EASE (including the Makutapora site),
those during the 1997–1998 El Niño (Fig. 3b). These dif- the central Democratic Republic of the Congo (DRC) and
ferences may be associated with the state of the Indian northern Angola. Negative 1TWS and 1GWS anomalies
Ocean zonal model (IOZM), an east–west structure of cou- occur over an extensive region of eastern SA including
pled ocean-atmosphere circulation, influencing convection the Limpopo site. However, despite broad-scale structural
and rainfall over East Africa (Saji et al., 1999, Sect. S1). similarity, there are some apparent inconsistencies between
The 1997–1998 El Niño coincided with a very strong pos- 1TWS (and other components of the water budget, includ-
Hydrol. Earth Syst. Sci., 23, 1751–1762, 2019 www.hydrol-earth-syst-sci.net/23/1751/2019/S. R. Kolusu et al.: The El Niño event of 2015–2016: climate anomalies 1757
longer time period from different rainfall data than those used
in the GLDAS system. Consequently, these measures may
be expected to diverge across mean rainfall gradients. Fur-
ther, SPEI-7 reflects potential rather than actual evapotran-
spiration. (ii) Over the northern sector of Zambia, Zimbabwe
and Malawi, the strongly negative 1TWS anomaly is almost
equally shared between modelled reductions in 1SMS and
1GWS. (iii) To the south, over South Africa, however, the
(rather weaker) 1TWS deficits are effectively accounted for
by 1SMS anomalies such that 1GWS anomalies are actually
close to zero or indeed slightly positive. The Limpopo study
site lies at a transition zone between regions with apparently
strongly reduced 1GWS to the northeast and close to zero
or slightly positive 1GWS to the southwest. As geology is
broadly continuous across the region, the transition is largely
related to uncertainty in the estimation of modelled 1SMS.
Further, considering the anomalous wet region over EASE
to the north of ∼ 10◦ S, 1GWS broadly mirrors the structure
of 1TWS, but the detailed picture is complex. Over most of
Tanzania and Angola, positive 1TWS anomalies are largely
partitioned into the 1GWS rather than 1SMS, whereas over
the southern DRC, the reverse is the case. Moreover, there
are interesting apparent contradictions between the climate
SPEI-7 and GRACE 1TWS data. Over Namibia and south-
ern Angola, a negative SPEI-7 (Fig. 1a and 1SMS; Fig. 4b)
Figure 4. Water storage anomaly components (cm) over the study
coincides with positive 1TWS anomalies (Fig. 4a), leading
domain for the wet season (October–April) of 2015–2016 minus
long-term annual mean from 2003–2015. (a) GRACE ensemble- to very strong positive 1GWS anomalies (Fig. 4d) that are
mean total water storage anomaly (1TWS; from CSR, JPL Mas- therefore inconsistent with climate anomalies from SPEI-7.
cons and GRGS GRACE products). (b) GLDAS ensemble-mean Conversely, and more locally, over northern Mozambique, a
soil moisture storage anomaly (1SMS; four land surface mod- positive 1SMS anomaly, resulting from the driving rainfall
els: CLM, NOAH, VIC and MOSAIC). (c) GLDAS ensemble- data (see the SPEI-7 wet anomaly; Fig. 1a) is not reflected in
mean surface runoff or surface water storage anomaly (1SWS; a strong 1TWS signal, which leaves a counter-intuitive, neg-
from four land surface models: CLM, NOAH, VIC and MO- ative residual response in 1GWS. As such, GRACE 1GWS
SAIC), and (d) GRACE–GLDAS-derived ensemble-mean ground- exhibits inconsistent responses to both apparent anomalous
water storage anomaly (1GWS; from three estimates of 1GWS dry and wet conditions. These are likely to be a result of
from three GRACE products).
(i) limitations in observational precipitation data, (ii) un-
certainties in GRACE TWS retrievals (as well as unwanted
artefacts from surface and tectonic deformation), (iii) uncer-
ing 1GWS) and the SPEI-7 climate signal that we consider tainties in estimation of the individual components of water
below. storage from LSMs and (iv) differing timescales of response
Viewed more closely, the partitioning of large-scale across the various data. Such issues have been noted and as-
1TWS anomalies between the modelled 1SMS, 1SWS and sessed elsewhere (Hassan and Jin, 2016; Zhao et al., 2017;
residual 1GWS is spatially complex. First, we note that Rodell et al., 2018; Scanlon et al., 2018). Resolving these
1SWS (Fig. 4c) plays only a minor role across the domain. issues is challenging, but recent studies have sought to con-
Further, the coherence of the spatial structure in anomalies in strain the uncertainty in the modelled components of water
1SMS (Fig. 4b) is much less clear than for 1TWS, reflect- storage through assimilation of GRACE TWS into hydrolog-
ing uncertainties in soil moisture among individual LSMs, ical models (Khaki et al., 2018; Schumacher et al., 2018).
as highlighted by Scanlon et al. (2018). Then, considering
the drought region over SA, a number of features emerge. 3.2.2 In situ and GRACE-derived estimates of 1GWS
(i) The relative magnitude of 1TWS deficits over South at the Makutapora and Limpopo basins
Africa are less than those of the SPEI-7, compared to the
northern more humid parts of SA (compare Figs. 4a and 1a). Piezometry for the two observatory sites and changes in
This difference may be expected, since 1TWS is an abso- GWS estimated from GRACE and LSMs are shown in Fig. 5.
lute measure of water volume, whereas SPEI-7 is a stan- First, we note that uncertainty in the mean GRACE 1GWS
dardised anomaly relative to climate, derived over a much estimate (blue shading around blue line in Fig. 5a and b),
www.hydrol-earth-syst-sci.net/23/1751/2019/ Hydrol. Earth Syst. Sci., 23, 1751–1762, 20191758 S. R. Kolusu et al.: The El Niño event of 2015–2016: climate anomalies
only 2002–2003 has a lower seasonal increase in GWS. The
2015–2016 drought is preceded by negligible recharge in the
dry year of 2014–2015 (Fig. 5a) such that GWS as of mid-
2016 was lowest in the 14-year record. As such, the major
drought of 2015–2016 compounded weak recharge in the
previous year, leaving GWS at historically low levels. This
may have been compounded by increased abstractions dur-
ing these dry years.
Comparison of piezometry and GRACE-derived GWS at
Limpopo (Fig. 5a) suggests a broad correspondence when
seasonally averaged, (r = 0.62, significant at the 0.01 prob-
ability level). The prolonged decline over 2014–2016 is ob-
served in both GRACE and piezometry. When averaged over
all years, the mean annual cycle is similar in phase and mag-
nitude (not shown). As such, at least for broad temporal av-
eraging scales, GRACE is corroborated by piezometry at the
Limpopo site, where the scales of spatial averaging are sim-
ilar. However, within seasons, the uncertainty in GRACE
1GWS leads to a much “noisier” mean signal at Limpopo
which cannot resolve the annual sawtooth pattern (Fig. 5a);
in GRACE 1GWS, individual years have a rather variable
annual cycle despite a clear cycle in rainfall. Notably, a
strong rise in the ensemble-mean GRACE 1GWS during
early season 2015–2016 is not corroborated by piezometry or
rainfall. This period coincides with the greatest uncertainty
in GRACE 1GWS among the three GRACE products (see
blue shading around ensemble-mean GRACE estimates in
Fig. 5a). There is some indication from Fig. S2 that during
Figure 5. (a) Time series of estimates of monthly 1GWS such periods of greatest 1GWS uncertainty, it is the uncer-
anomaly (cm) at Limpopo from August 2002 to July 2016 de- tainty in GRACE 1TWS that makes most important contri-
rived from GRACE and averaged over an area of approximately ∼ bution, rather than uncertainty in the GLDAS components.
120 000 km2 (bold blue line is the mean of CSR, JPL Mascons and From the individual GRACE 1TWS products (Fig. S3) we
GRGS products; light blue shading represents uncertainty across
note that the mean GRACE vs. piezometry 1GWS discrep-
the three products and four LSMs) and piezometry (red line, mean
of all stations; red shading represents uncertainty). Monthly rainfall
ancies in late 2015 result largely from the GRGS product,
(from GPCP product; cm) shown as bars, with mean monthly rain- which shows a non-corroborated increase in 1TWS.
fall indicated by a dashed line; (b) as in (a), but for Makutapora. At the EASE Makutapora site, observed piezometric GWS
(c) Monthly groundwater abstraction at Makutapora. (Fig. 5b) shows little regular inter-annual variability, with
long periods of GWS recessions, e.g. 2002–2006 and 2012–
2016, interrupted by irregular and infrequent GWS in-
whilst often large, is generally smaller than the signals of creases, which are, in declining order of magnitude, 2006–
inter-annual variability which are the main focus of our anal- 2007, 2009–2010 and 2015–2016, all El Niño years. The
ysis. However, variability in mean GRACE 1GWS within wet conditions in 2015–2016 produced a major recharge
recharge seasons is small relative to uncertainty, such that event, though observed piezometric responses are smaller
we cannot confidently draw inferences at these timescales. than in 2006–2007 and 2009–2010, despite higher rainfall
Specifically, at the SA Limpopo site, observed piezometry (Fig. 5b). Under highly dynamic pumping regimes (Fig. 5c),
(Fig. 5a) shows an annual cycle in GWS in most years, with GWS changes are only a partial proxy for groundwater
a “sawtooth” pattern representing steady recessions in GWS recharge; the sharp increase (∼ 50 %) in well field pumping
during the dry season from May to October followed by rapid in May 2015 served to diminish the response in piezometric
increases typically starting in December in response to the GWS to the 2015–2016 El Niño. Overall, however, the find-
onset of the wet season to the peak post wet season in April ings are consistent with the analysis of Taylor et al. (2013),
(lagging peak rainfall by ∼ 1–2 months). GWS in 2015–2016 who note highly episodic recharge at Makutapora over the
is well below average, with a seasonal but subdued GWS period since the 1960s, associated with years of heavy rain-
rise being delayed (until March) due to the highly anoma- fall. The 2015–2016 El Niño event represents a major event
lous early wet season drought. The GWS rise in March–April driving GWS at the Makutapora well field, despite moderate
following rains in March is the second smallest on record; rainfall anomalies over EASE.
Hydrol. Earth Syst. Sci., 23, 1751–1762, 2019 www.hydrol-earth-syst-sci.net/23/1751/2019/S. R. Kolusu et al.: The El Niño event of 2015–2016: climate anomalies 1759
There is only a rather general association between GRACE that the event was associated with a pronounced north–south
and piezometric estimates of groundwater storage variabil- dipole pattern of positive or negative rainfall and water bal-
ity at the Makutapora site. However, the episodic recharge ance anomalies over EASE and SA, typical of the ENSO
events in the piezometry data of 2006–2007, 2009–2010 and teleconnection to the region. It was the second largest such
2015–2016 are matched quite well by the magnitude of ma- dipole event on record since 1900. Considerable diversity
jor GRACE increases in 1GWS, although the second largest nevertheless exists in climate anomalies over Africa between
GRACE 1GWS increase occurs in 2014–2015 with no re- El Niño events.
sponse apparent in piezometry. Overall, the seasonal correla- The response of the water balance including GWS to
tion of GRACE 1GWS and piezometric GWS of 0.51 is only ENSO is marked. Over EASE, total rainfall and daily in-
moderate (significant at the 0.05 probability level) but clearly tensities were higher than normal, and we estimate the re-
reflects the low-frequency multi-annual trends (at least up turn period for the SPEI-7 water balance metric, over the
to 2013) as well as inter-annual variability. domain as a whole, to be ∼ 10 years. Wet anomalies over
However, stark differences between GRACE and piezome- EASE were actually moderated by the occurrence of a rather
try are apparent. In contrast to piezometry, GRACE (Fig. 5b) weak IOZM event. Nevertheless, the anomalously wet con-
shows increases in 1GWS in most years (with lag of ∼ ditions led to strong groundwater recharge over the EASE
1 month after the rainfall annual peak), suggesting that domain, as evidenced from GRACE. At the Makutapora well
recharge occurs annually. Further, GRACE 1GWS replicates field in Tanzania, in 2015–2016 the strong rainfall related to
the low-frequency recessionary trend over the period 2002– El Niño acted to reverse a long-term decline in observed in
2007 but diverges substantially from piezometric observa- situ groundwater storage associated with a rise in intensive
tions after 2012. Resolving these contradictions is problem- pumping rates. Changes in GWS estimated from an ensemble
atic, but two likely explanations emerge: (i) incommensurate of GRACE and LSMs also reflect the occurrence of substan-
scales of observation from piezometry (area ∼ 60 km2 ) and tial groundwater recharge in 2015–2016 and indicate annual
GRACE (∼ 200 000 km2 ) and (ii) errors in GRACE 1GWS groundwater recharge across the region. Broadly, the anal-
resulting from inaccurate accounting of 1SMS and 1SWS, ysis reinforces the importance of large-scale climate events
which leave a residual artefact of an annual positive 1GWS in driving episodic recharge, critical in replenishing heavily
signal (see Sect. 3.1; Shamsudduha et al., 2017, and Scanlon exploited aquifers.
et al., 2018). For the latter, such errors may not be adequately Over SA, the 2015–2016 El Niño was associated with ex-
accounted for in the uncertainty estimates in GRACE 1GWS treme drought, the strongest within the observed 116-year
given, for example, similarities in LSM design and driving record, with an estimated return period of ∼ 260 years, re-
data. Indeed, at both the Limpopo and Makutapora sites, we sulting from exceptionally low rainfall and high tempera-
note stronger correlations between seasonal local rainfall and tures. The drought resulted in groundwater storage declines
piezometric GWS than with GRACE 1GWS (not shown). through most of the wet season at our Limpopo study site,
For the former, more localised processes may dominate the with strongly reduced recharge experienced, the second low-
piezometry record, perhaps including recharge sensitivity to est on record. Furthermore, this followed a dry year in 2014–
contributions from local ephemeral river flow and rainfall. 2015, leading to 2 consecutive years of low recharge and
Further, the effects of local pumping strongly influence the the greatest recession on record. Clearly, groundwater pro-
piezometric record, obscuring recharge events of low magni- vides a valuable buffer for periods of reduced surface water
tude. Specifically, the period 2002–2007 over which the data availability in drought conditions, although as our results at
agree reflects a widespread groundwater recession, follow- Limpopo show, consecutive dry years lead to marked storage
ing the anomalously high recharge during the El Niño event reduction. Climate projections suggest reduced early season
of 1997–1998 (Taylor et al., 2013), whilst the recent accel- rainfall across much of SA (Lazenby et al., 2018) compound-
erated recessionary trend since 2012 reflects the effects of a ing rising temperatures, and the implications of this for cli-
rapid increase in abstraction, which has a more localised ef- mate resilience require a better understanding of these im-
fect apparent only in the piezometric observations. As such pacts on groundwater recharge as well as surface water re-
the piezometric record may only show episodic recharge, sources.
whilst GRACE may indicate annual and episodic recharge GRACE data and LSM outputs are clearly useful in com-
processes. plementing in situ data, but a number of issues emerge. Al-
though at the broadest scale the GRACE 1GWS anomalies
in 2015–2016 are consistent with rainfall anomalies, there
4 Concluding discussion are a number of apparent inconsistencies over quite large ar-
eas. Resolving the underlying reasons for these is problem-
We quantify the climate anomalies and groundwater response atic, but likely candidates include the effects of inadequate
during the major El Niño event of 2015–2016 over South- climate data over Southern Africa, influencing and com-
ern and East Africa, south of the Equator, across a range of pounded by uncertainties in 1SMS and 1SWS estimates
spatial scales, from regional to local. Our analysis confirms simulated by land surface models on which the estimation
www.hydrol-earth-syst-sci.net/23/1751/2019/ Hydrol. Earth Syst. Sci., 23, 1751–1762, 20191760 S. R. Kolusu et al.: The El Niño event of 2015–2016: climate anomalies
of GRACE 1GWS depends. When averaged over compara- opment (DfID): (i) the Unlocking the Potential of Groundwater
ble scales at Limpopo, GRACE and piezometry agree well, for Poverty Alleviation (UpGro) consortium project “GroFutures”
at least for seasonal averages. Comparison with the local ob- (grant numbers NE/M008207/1 and NE/M008932/1; see http://
servations shows that GRACE GWS estimates are consid- grofutures.org/, last access: 27 March 2019), (ii) the Future Climate
erably noisier, especially at Makutapora, where the spatial For Africa (FCFA) consortium project “UMFULA” (grant num-
ber NE/M020258; see http://www.futureclimateafrica.org/, last ac-
averaging scale of in situ data and GRACE differ greatly.
cess: 27 March 2019), and (iii) the Science for Humanitarian Emer-
Local groundwater abstractions are apparent in the Makuta- gencies And Resilience (SHEAR) consortium project “ForPAc”
pora record and very likely at Limpopo. Our results suggest (grant number NE/P000673/1 and NE/P000568/1; see https://www.
that further analysis of the robustness of GRACE estimates forpac.org/, last access: 27 March 2019). Further contribution was
of GWS is advisable and, as such, that these estimates should received from the UK Engineering and Physical Sciences Research
be treated with considerable caution. Council (EPSRC) “Banking the Rain”, grant number 172313, un-
Our results highlight the potential for adaptive strategies, der the Global Challenges Research Fund (GCRF), and the Royal
such as managed aquifer recharge, for optimising the cap- Society Leverhulme Senior Fellowship to Richard G. Taylor (refer-
ture or storage of episodic recharge in East Africa during ence LT170004). Mark O. Cuthbert is supported by a UK NERC In-
El Niño and/or positive IOZM events and by corollary over dependent Research Fellowship (grant number NE/P017819/1). The
Southern Africa during La Niña events (given the opposing Chronicles Consortium (https://www.un-igrac.org/special-project/
chronicles-consortium, last access: 27 March 2019), which coor-
dipole structure of ENSO-related rainfall anomalies across
dinates long-term groundwater in situ observations, was supported
SA/EASE). Of course other modes of climate variability by the UK government under the UPGro programme. This research
driving rainfall extremes are also important. Such interven- used science gateway resources of the National Energy Research
tions can enhance the positive role of groundwater in climate- Scientific Computing Center, a DOE Office of Science user facility
resilient water and drought management. Seasonal climate supported by the Office of Science of the US Department of Energy
prediction may have a potential role in informing such adap- under contract no. DE-AC02-05CH11231. The authors would like
tive water management strategies. At Makutapora, managed to thank the editor and reviewers for their constructive comments
aquifer recharge exploiting El Niño and/or positive IOZM and suggestions which led to substantial improvements in the pa-
events may contribute to resilient urban water supply systems per.
for the city of Dodoma. Our findings strengthen the case for a
greater understanding of the drivers of rainfall extremes over
Africa and their relationship with recharge processes under Review statement. This paper was edited by Shraddhanand Shukla
past, current and future climates and at various temporal and and reviewed by three anonymous referees.
spatial scales. Such knowledge is crucial in informing water
management policies and practices for sustainable and cli-
mate resilient development in a region undergoing rapid de- References
velopment of groundwater resources.
Archer, E. R. M., Landman, W. A., Tadross, M. A., Malherbe, J.,
Weepener, H., Maluleke, P., and Marumbwa, F. M.: Understand-
Data availability. Data are available from the corresponding author ing the evolution of the 2014–2016 summer rainfall seasons in
on request. southern Africa: Key lessons, Clim. Risk Manage., 16, 22–28,
2017.
Berhane, F. and Zaitchik, B: Modulation of daily precipitation over
Supplement. The supplement related to this article is available East Africa by the Madden–Julian oscillation, J. Climate, 27,
online at: https://doi.org/10.5194/hess-23-1751-2019-supplement. 6016–6034, 2014.
Biancale, R., Lemoine, J.-M., Balmino, G., Loyer, S., Bruisma, S.,
Perosanz, F., Marty, J.-C., and Gégout, P.: 3 Years of Geoid Vari-
ations from GRACE and LAGEOS Data at 10-day Intervals from
Author contributions. SRK and MCT conceived the paper. Data
July 2002 to March 2005, CNES/GRGS product data available
analysis was conducted by all authors. MCT and SRK prepared the
on CD-ROM, 2006.
paper with contributions from all co-authors.
Bindoff, N. L., Stott, P. A., AchutaRao, K. M., Allen, M. R.,
Gillett, N., Gutzler, D., Hansingo, K., Hegerl, G., Hu, Y., Jain, S.,
Mokhov, I. I., Overland, J., Perlwitz, J., Sebbari, R., and Zhang,
Competing interests. The authors declare that they have no conflict X.: Detection and Attribution of Climate Change: from Global to
of interest. Regional, in: Climate Change 2013: The Physical Science Basis,
Contribution of Working Group I to the Fifth Assessment Report
of the Intergovernmental Panel on Climate Change, edited by:
Acknowledgements. This project was supported by the following Stocker, T. F., Qin, D., Plattner, G.-K., Tignor, M., Allen, S. K.,
research grant awards, funded by the UK Natural Environment Boschung, J., Nauels, A., Xia, Y., Bex, V., and Midgley, P. M.,
Research Council (NERC) and Economic and Social Research Cambridge University Press, Cambridge, UK and New York, NY,
Council (ESRC) and the UK Department for International Devel- USA, 2013.
Hydrol. Earth Syst. Sci., 23, 1751–1762, 2019 www.hydrol-earth-syst-sci.net/23/1751/2019/S. R. Kolusu et al.: The El Niño event of 2015–2016: climate anomalies 1761
Blamey, R. C., Kolusu, S. R., Mahlalela, P., Todd, M. C., and Rea- Holman, I. P., Rivas-Casado, M., Bloomfield, J. P., and Gur-
son, C. J. C.: The role of regional circulation features in regulat- dak, J. J.: Identifying non-stationary groundwater level re-
ing El Niño climate impacts over southern Africa: A comparison sponse to North Atlantic ocean-atmosphere teleconnection
of the 2015/2016 drought with previous events, Int. J. Climatol., patterns using wavelet coherence, Hydrogeol. J., 19, 1269,
38, 4276–4295, https://doi.org/10.1002/joc.5668, 2018. https://doi.org/10.1007/s10040-011-0755-9, 2011.
Blunden, J. and Arndt, D. S. : State of the Climate in 2016, B. Am. Hunter, P. R., MacDonald, A. M., and Carter, R. C. :
Meteorol. Soc., 98, Si–S280, 2016. Water supply and health, PLoS Medicine, 7, e1000361,
Bonsor, H., Shamsudduha, M., Marchant, B., MacDonald, https://doi.org/10.1371/journal.pmed.1000361, 2010.
A., and Taylor, R: Seasonal and decadal groundwater Jasechko, S. and Taylor, R. G. : Intensive rainfall recharges
changes in African sedimentary aquifers estimated us- tropical groundwaters, Environ. Res. Lett., 10, 124015,
ing GRACE products and LSMs, Remote Sens., 10, 904, https://doi.org/10.1088/1748-9326/10/12/124015, 2015.
https://doi.org/10.3390/rs10060904, 2018. Khaki, M., Forootan, E., Kuhn, M., Awange, J., van Dijk, A. I.
Cai, X., Magidi, J., Nhamo, L., and van Koppen, B.: Mapping J. M., Schumacher, M., and Sharifi, M. A.: Determining Water
irrigated areas in the Limpopo Province, South Africa, Storage Depletion within Iran by Assimilating GRACE data into
IWMI Working Paper 172, International Water Man- the W3RA Hydrological Model, Adv. Water Resour., 114, 1–18,
agement Institute (IWMI), Colombo, Sri Lanka, p. 37, https://doi.org/10.1016/j.advwatres.2018.02.008, 2018.
https://doi.org/10.5337/2017.205, 2017. Koster, R. D. and Suarez, M. J.: Modeling the land surface bound-
Calow, R. C., MacDonald, A. M., Nicol, A. L., and Robins, N. S.: ary in climate models as a composite of independent vegetation
Ground water security and drought in Africa: linking availability, stands, J. Geophys. Res.-Atmos., 97, 2697–2715, 1992.
access, and demand, Groundwater, 48, 246–256, 2010. Koster, R. D., Sud, Y. C., Guo, Z., Dirmeyer, P. A., Bonan, G.,
Cuthbert, M. O., Acworth, R. I., Andersen, M. S., Larsen, J. R., Oleson, K. W., Chan, E., Verseghy, D., Cox, P., Davies, H., and
McCallum, A. M., Rau, G. C., and Tellam, J. H.: Understand- Kowalczyk, E.: GLACE: the global land–atmosphere coupling
ing and quantifying focused, indirect groundwater recharge from experiment. Part I: overview, J. Hydrometeorol., 7, 590–610,
ephemeral streams using water table fluctuations, Water Resour. 2006.
Res., 52, 827–840, https://doi.org/10.1002/2015WR017503, Kuss, A. J. M. and Gurdak, J. J.: Groundwater level response in
2016. US principal aquifers to ENSO, NAO, PDO, and AMO, J. Hy-
Cuthbert, M. O., Gleeson, T., Reynolds, S. C., Bennett, M. R., drol., 519, 1939–1952, 2014.
Newton, A. C., McCormack, C. J., and Ashley, G. M.: Mod- Landerer, F. W. and Swenson, S. C.: Accuracy of scaled GRACE
elling the role of groundwater hydro-refugia in East African terrestrial water storage estimates, Water Resour. Res., 48,
hominin evolution and dispersal, Nat. Commun., 8, 15696, W04531, https://doi.org/10.1029/2011WR011453, 2012.
https://doi.org/10.1038/ncomms15696, 2017. Lazenby, M. J., Todd, M. C., Wang, Y., and Chadwick, R.: Future
Dai, Y., Zeng, X., Dickinson, R. E., Baker, I., Bonan, G. B., precipitation projections over central and southern Africa and the
Bosilovich, M. G., Denning, A. S., Dirmeyer, P. A., Houser, P. adjacent Indian Ocean: What causes the changes and the uncer-
R., Niu, G., and Oleson, K. W., and Oleson, K. W.: The common tainty?, J. Climate, 31, 4807–4826, 2018.
land model, B. Am. Meteorol. Soc., 84, 1013–1024, 2003. Liang, X., Xie, Z., and Huang, M.: A new parameterization
Dee, D. P., Uppala, S. M., Simmons, A. J., Berrisford, P., Poli, for surface and groundwater interactions and its impact on
P., Kobayashi, S., Andrae, U., Balmaseda, M. A., Balsamo, G., water budgets with the variable infiltration capacity (VIC)
Bauer, D. P., and Bechtold, P.: The ERA-Interim reanalysis: Con- land surface model, J. Geophys. Res.-Atmos., 108, 8613,
figuration and performance of the data assimilation system, Q. J. https://doi.org/10.1029/2002JD003090, 2003.
Roy. Meteorol. Soc., 137, 553–597, 2011. MacDonald, A. M., Bonsor, H. C., Dochartaigh, B. É. Ó., and Tay-
Dunning, C. M., Black, E. C., and Allan, R. P.: The onset and ces- lor, R. G.: Quantitative maps of groundwater resources in Africa,
sation of seasonal rainfall over Africa, J. Geophys. Res.-Atmos., Environ. Res. Lett., 7, 024009, https://doi.org/10.1088/1748-
121, 11–405, 2016. 9326/7/2/024009, 2012.
Ek, M. B., Mitchell, K. E., Lin, Y., Rogers, E., Grunmann, P., Ko- McMahon, T. A., Finlayson, B. L., Haines, A., and Srikanthan, R.:
ren, V., Gayno, G., and Tarpley, J. D.: Implementation of Noah Runoff variability: a global perspective, in: IAHS Publ. no. 168,
land surface model advances in the National Centers for Environ- The Influence of Climate Change and Climatic Variability on
mental Prediction operational mesoscale Eta model, J. Geophys. the Hydrologic Regime and Water Resources, Proceedings of the
Res.-Atmos., 108, 8851, https://doi.org/10.1029/2002JD003296, Vancouver Symposium, August 1987, Vancouver, 1987.
2003. Meyer, R.: Analysis of groundwater level time series and the re-
Ferguson, C. R., Wood, E. F., and Vinukollu, R. K.: A global inter- lation to rainfall and recharge, Water Resources Commission
comparison of modeled and observed land–atmosphere coupling, (South Africa), report number 1323/1/05, Water Research Com-
J. Hydrometeorol., 13, 749–784, 2012. mission, Pretoria, 2005.
Harris, I. P. D. J., Jones, P. D., Osborn, T. J., and Lister, D. H.: Mishra, V. and Cherkauer, K. A.: Retrospective droughts in the crop
Updated high-resolution grids of monthly climatic observations growing season: Implications to corn and soybean yield in the
– the CRU TS3.10 Dataset, Int. J. Climatol., 34, 623–642, 2014. Midwestern United States, Agr. Forest Meteorol., 150, 1030–
Hassan, A. and Jin, S.: Water storage changes and balances in Africa 1045, 2010.
observed by GRACE and hydrologic models, Geod. Geodynam., Nicholson, S. E.: Long-term variability of the East African ‘short
7, 39–49, https://doi.org/10.1016/j.geog.2016.03.002, 2016. rains’ and its links to large-scale factors, Int. J. Climatol., 35,
3979–3990, 2015.
www.hydrol-earth-syst-sci.net/23/1751/2019/ Hydrol. Earth Syst. Sci., 23, 1751–1762, 2019You can also read