The European E-commerce market: Digital Single Market
←
→
Page content transcription
If your browser does not render page correctly, please read the page content below
Master’s Degree programme
                           in Accounting and Finance
                           curriculum Business Administration
                                     Second Cycle

                                     Final Thesis

   The European E-commerce market: Digital
                Single Market

Supervisor
Ch. Prof. Giovanni Vaia

Assistant Supervisor
Ch. Prof. Vladi Finotto

Graduand
Tereza Khachatryan
Matriculation Number 983127

Academic Year
2017 / 2018

                                                                1
2
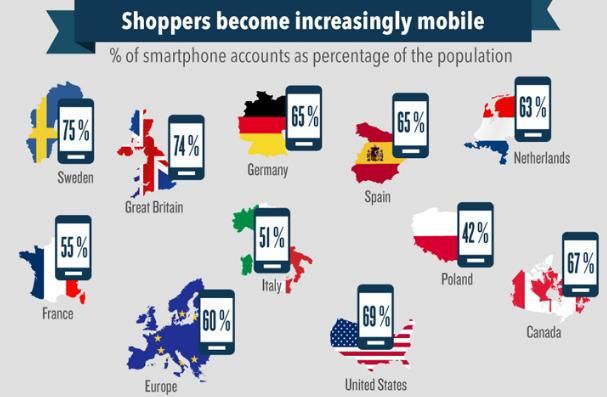
Table of Contents

Abstract .................................................................................................................................................. 6
Introduction ............................................................................................................................................ 8
Chapter One: The European E-commerce market
       1.1 An Overview of the e-commerce in Europe……………………………………………………………………..10
       1.2 The trends of an online market and popular product categories in Europe………………………10
       1.3 Delivery preferences and the process of returns……………………………………………………………..15
       1.4 Payment preferences………………………………………………………………………………………………………16
       1.5 Effects on conventional stores………………………………………………………………………………………..17
       1.6 Mobile E-commerce……………………………………………………………………………………………………….28
       1.7 Impact of E-commerce on economy of the EU……………………………………………………………….31
       1.8 E-shoppers and E-retailers in the EU……………………………………………………………………………...33
              1.8.1 E-shoppers in Europe from 2015 to 2021………………………………………………………………33
              1.8.2 Delivery price ……………………………………………………………………………………………………….35
             1.8.3. Return options……………………………………………………………………………………………………..36
             1.8.4 Speed of delivery…………………………………………………………………………………………………..37
             1.8.5 Delivery Point………………………………………………………………………………………………………..37
             1.8.6 Extra services…………………………………………………………………………………………………………37
             1.8.7 E-retailer’s needs…………………………………………………………………………………………………..38
             1.8.8 European E-retailers………………………………………………………………………………………………39

Chapter Two: Cross-border e-commerce and geo blocking

       2.1 Cross-border B2C e-commerce……………………………………………………………………………………..46
       2.2 Cross –border E-commerce in the UK: What does BREXIT means for online business?...49
       2.3 Geo-blocking in Europe………………………………………………………………………………………………..51

Chapter Three: Digital single market

       3.1 The strategy of “Digital Single Market” ………………………………………………………………………..56
       3.2 1st Pillar – Access………………………………………………………………………………………………………….56
       3.3 2nd Pillar – Environment……………………………………………………………………………………………….61
       3.4 3rd Pillar – Economy and Society………………………………………………………………………………….68
               3.4.1        Address Barriers in European Data Economy…………………………………………………69
               3.4.2        European E-Government Action Plan 2016-2020…………………………………………..73

                                                                                                                                                           3
3.4.3   Common Well
               Project……………………………………………………………………………………………………….78

   3.5 Mid-term review on implementation of DSM strategy…………………………………………….79
   3.6 Questionnaire “Digital single market”………………………………………………………………………86
Conclusion………………………………………………………………………………………………………………………….90

Bibliography……………………………………………………………………………………………………………………….92

                                                                               4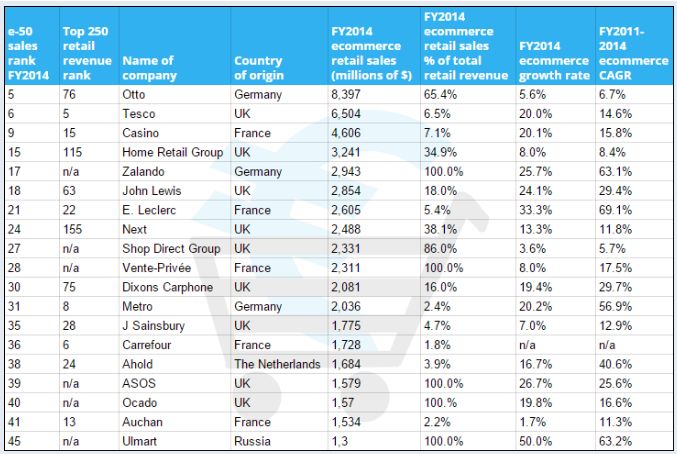
5
Abstract

This study provides an overall insight into the various aspects of the ongoing e-
commerce situation in the territory of European Union simultaneously measuring the
impact of “Digital Single Market” Strategy both on e-commerce sector and on digital
platform in general.

The thesis is composed of three chapters, where the first one is dedicated to the
disclosure and revelation of e-commerce field by making a market analysis, taking
into consideration its trends, growth opportunities, obstacles impeding its expansion
and productivity. This part of the research provides an assessment of obtained
results and gains not only for the EU economy, but also for relationships created
between two main counterparties of the sector: e-shoppers and e-sellers.

The second chapter provides deeper highlights into core issues of nowadays’ e-
commerce sector, namely cross-border delivery and geo-blocking questions. Main
complications are brought into light demonstrating their possible solutions and future
evolution in the framework of “Digital Single Market” Strategy.

Finally, the third chapter is presenting the comprehensive description of Digital
Single Market, changes made till now, new regulations, legislations and their direct
effects on digital economy of the EU. In conclusion, there is provided a questionnaire
which totally reveals the approach of citizens and companies regarding the above
mentioned strategy.

                                                                                     6
7

Introduction

This thesis discusses the topic of European e-commerce market with highlights of
“Digital single market strategy” proposed by Juncker’s commission in 2015. It is
beyond shadow of a doubt that nowadays, the technological progress is pushing
forward the economy providing new opportunities and options both for e-shoppers
and e-retailers.

The first chapter is tackling with such issues as trends of the online market in the
territory of the European Union and the most demanded product categories. As well
as, through numerous researches and reports provided by European Commission it
is the impact of e-commerce on conventional stores and its overall impact on
economy at all. As a matter of fact, being representatives of the generation Z, it was
impossible to discount the influence of mobile technologies in the same sector.
According to PayPal research M-commerce is going to have a 42% of annual growth
in the EU. Additionally, in this part of thesis are presented e-shoppers and e-
retailers, their needs and interconnectivity, which is making the chain of e-commerce
in general.

The second chapter is dealing with questions like cross-border e-commerce and
geo-blocking. 16% of individuals in the 28 countries of Europe purchased goods
and/or services from sellers outside of their residence country. For the sake of
ending the unjustified geo blocking and cancel the barriers, on 29th of November
European Parliament adapted the “Geo-Blocking regulation” with the collaboration of
EU ambassadors. This regulation again is making part of Digital Single Market
Strategy.

The last chapter is describing the nature of “Digital single market”, its characteristics
and impact on each relative sector. The above mentioned strategy is composed of
three pillars and each of them includes particular points touching such important
issues as e-consumers’ rights, privacy, cybersecurity etc. Being in use already a
couple of years, European Commission already provided the mid-term review on the
implementation of DSM and the results achieved during these years. For example,

                                                                                       8
from 15th of June 2017 all the roaming charges are cancelled for the Europeans
travelling in other Member states. From early 2018 Europeans are given the chance
to access freely their subscriptions to films, TV canals, e-books, video games or
music services during their travelling. Another significant achievement can be
considered the end of geo-blocking and discrimination among member states. At the
end of last chapter will be presented the questionnaire spread among companies
having activities connected to e-commerce and/or online services, that in a way are
witnessing the changes in the framework of Digital single market strategy. The
results represent mostly a positive feedback about the project till now, in this way
proving the positive impact of the project.

                                                                                  9
CHAPTER 1

                           THE EUROPEAN ECOMMERCE MARKET

1.1        An Overview of Ecommerce in Europe

With the extensive application of the Internet in 1992, European e-commerce got a
late start started in 1995. In 2005, actively promoting the EU, including each member
state has enacted the relevant electronic commerce including operations, payment,
legal documents and other aspects of the contract and guidance outline.1 European
e-commerce information management has been a very good legal guarantee and
standardization of operations. E-commerce environment has changed dramatically;
the customer's trust in online shopping has also been greatly improved, so that the
European B2C achieved considerable development.
The EU is in prime position when it comes to global trade. The European Union is
one of the most economically developed regions in the world, and the gradual
deepening of economic integration has promoted the further prosperity of the
region's economy. 2013, the EU's 28 member countries GDP reached 12 trillion
euros, per capita gross domestic product was 23100 euros.2 As the world's largest
exporter of goods and services, the European Union is the world's most important
economic force. In 2016, 28 countries with an area of 4 million 380 thousand square
kilometres and a population of 510 million, and the EU's economic strength has
surpassed the United States ranks first in the world. With the enlargement of the EU,
the EU's economic strength will be further strengthened.

1.2 The trends of Online Market and popular product categories in Europe

Because of the development of the market the online shoppers now have much
more opportunities and options for shopping online which is leading to the inevitable

1
    (Schniederjans & Cao 2002)   – “E-commerce Operations Management”
2
    Eurostat 2017

                                                                                  10
increase in the value of goods bought online. For example, for Germany, the United
Kingdome, France, Spain, Poland, Belgium, The Netherlands, Italy, Norway,
Denmark, Norway and Finland the total amount of products purchased online is 170
billion Euros during 2013. One of the conclusions expressed by PostNord, which is
usually managing reports only for Nordic region, this time made a survey for
European market as well, stating the following: “The reason why we are now, for the
first time, publishing an European ecommerce report is the rapid growth in
ecommerce and an increase in interest in the Nordic region and Europe from
ecommerce companies in Asia and the USA”3, says Håkan Ericsson, President and
CEO of PostNord.
Currently, the Northern Europe has the most prominent Internet penetration level in
Europe, in other words 4 out of 5 made an online acquisition. The Figure 1 below is
showing the exact Internet penetration levels in different parts of Europe.
Figure 1. Internet penetration in Europe per region 2016
Source: Eurostat 2016
As a matter of fact, among Nordic region the Norway is demonstrating the highest
level of Internet penetration having 100% Internet access, Iceland and Denmark are
following with a very little difference in percentage.
3
PostNord Ecommerce Report 2015
11Table 1. Internet penetration as share of total population
Countries Internet Access Online population
Europe 77% 631.3 mm
EU28 83% 434mn
Top 12 92% 187.44mn
Norway 100% 5.27mn
Iceland 99% 0.328mn
Denmark 98% 5.57mn
Estonia 96% 1.25mn
Netherlands 95% 16.13mn
Sweden 93% 9.16mn
Finland 93% 5.13mn
United Kingdom 93% 60.6mn
Luxembourg 92% 0.53mn
Switzerland 90% 7.54mn
Germany 89% 71.8mn
Ireland 89% 4.2mn
Source: Worldbank 2016, Eurostat 2016
The most popular product categories in Europe are clothing and footwear, home
electronics and books. In the Nordic region, Spain and Italy home electronics are on
the top of the list. Sport and leisure articles are also a category that has seen an
increasingly rapid level of growth online in recent years. In Germany about 14 million
consumers bought these kinds of goods online last year. In second place was
France, with 5.4 million shoppers.
12Figure 2. Online shoppers per product/service category
Source: Eurostat 2016
According to PostNord “E-commerce report 2015” another product which has
promising growth possibility is cosmetics which is forecasted to have serious growth
rate. Over the last year, it was mainly the ‘big three’ (online shoppers from Germany,
the United Kingdome and France) who bought skin care and cosmetics via the
Internet.
As regards Sport and leisure category, the growth is noticeable especially in
Netherlands. The absolute leader is of course Germany, since at least 1 out of 4
leisure goods and sport items are purchased online.
Nonetheless, it can be noticed as well that some countries like the United Kingdome
and Spain are showing promising results as well.
Another category which is very interesting to put light on is the food sector which is
getting more and more popularity and again we are witnessing the UK being the
leader in the list. British people seem to be more mature making even their daily
grocery spending online.
13Figure 3. Buying food online
Anyway, in the comparison with previous categories this one is still the less trendy
group (after medicine) among people. However, this can mean also that the bigger
potential is achievable especially in this sector.
The results taken from Eurostat show that the less popularity among shoppers on
online platform is has medicine products, which by the way is showing some
increment of 1% compared with 2015.
Figure 4. Money spent € 100 - € 500 in last 3 months
Source: Eurostat 2016
141.3 Delivery preferences and the process of returns
As a matter of fact, the delivery preferences and requirements noticeably alter
among European countries. So, in terms of e-commerce deliveries, the Dutch have
the highest expectations hoping to receive their purchase within 1-2 days4. Whereas
Nordic and Spanish market seems to be more patient since they are willing to wait 6
working days. The most common by far is 3-5 days.
It is well known that nowadays one of the most important and principal criteria for
online shoppers is so called “easy and no trouble returns”. Without doubt, in this part
we are going to have diverse data and levels among EU countries since each of
them is demonstrating various behaviors regarding this issue. In mature markets
(like in Germany, the UK and Netherlands) the proportion of returns are higher.
Among frequently returned items are cloths and footwear, while the second place
takes home electronics.
Figure 5. Number of millions of online consumers who have returned an item
For example DHL Express, which is a well-known German logistic company
providing international courier, parcel and express mail services, has developed an
easy returns labels to make online shoppers’ experience smoother with return
process. B2C distance sellers can manage their return volumes comfortably and
flexibly. They can provide their customers with return labels via the DHL Global
4
Postnord: E-commerce in Europe 2015
15Mail web portal or have customers create and print labels by themselves.
Consumers can post their return shipments easily and usually free of charge at any
local postal outlet in most countries. “DHL Easy Return “provides access to a huge
number of postal outlets as drop-off points, with currently more than 80,000 drop-off
points within Europe.5
1.4 Payment preferences
Credit/debit cards are still the leaders in online market and are considered the most
common way of making payments. But this does not mean that the alternative
methods are not progressing. On the second place definitely comes PayPal, being
common for all Europe, besides Northern region and Belgium, where it takes only 5 th
or even 6th place.
So, in Poland and Germany other payment “habits” are also prevailing. In Poland,
direct payment through banks is the most accepted; followed by cash on delivery
(COD), while German pay for their purchases by invoice in arrears.
Research organization yStats.com published its latest report named “Europe Online
Payment Methods: First Half 2014” and it demonstrates that card account for the
largest share of business-to-consumer ecommerce transactions in Europe, while
digital wallets are second best.
Online payment is the largest contributor to card payment growth in the UK, with
annual growth of over 10%.6 The use of contactless cards in on the rise: in early
2014, the monthly value of payments by contactless cards in the UK exceeded GBP
100million for the first time. In France, credit card remains the most preferred
payment method in B2C E-Commerce, followed by PayPal and similar services. The
year-on-year growth of online credit card payments in France slowed to a single-digit
percentage in early 2014. Online card spending in Italy was growing year-on-year in
5 DHL easy returns – www.dhleasyreturn.com
6 “Europe Online Payment Methods: First Half 2014”
16every month of 2013, while in Spain; the two payment methods most used in online
shopping in 2013 were Bank Credit Card and PayPal.7
Another noteworthy aspect outlined by Ystat.com researchers is that COD (Cash on
delivery) is one of the most used methods Czech Republic. Online shoppers in
Turkey predominately use a credit card for purchases. E-Commerce transaction with
cards in Turkey reached a value of over EUR 10 billion. As well as in Estonia B2C E-
Commerce transactions with bank cards are on serious level, with cross-border
transactions by far outweighing the domestic ones.
Taking a look on Nordic region, it is very interesting to mention that for Sweden
credit cards and almost equally popular both for Ecommerce and M-commerce,
dominating as well in Norway and Denmark. By the way as regards Finland, in this
case bank transfers are the true leaders.
1.5 Effects on Conventional Shops
Evidently the continuous growth of online markets will obviously lead to negative
effects on conventional shops. For example, in Europe during 2017 was expected a
growth of online retailers by 14.2%. Unfortunately, this can lead maybe to fewer
physical stores and reduction of employment rates.
7
“Europe Online Payment Methods: First Half 2014
17Figure 6. Companies selling online
Source: Eurostat 2016
According to Center for Retail Research there are 3 stages in Market Development:8
Maturity - market share of 9.5% or above, 55%+ of the population are internet
shoppers, rapidly developing mobile use (15%+ of all online in 2014), multiple
online providers throughout each sector and 12+ purchases pa by each
shopper.
Examples: US, the UK, Germany and (from 2017) France, are expected to
grow more slowly, recruiting a percentage of non-users but mainly growing
because existing e-shoppers place more orders or buy more expensive items.
However, online growth in Germany is continuing at a very high rate, so
maturity is a tendency rather than a scientific law.
Mid-range - market shares of 6.5% to 9.5%, a wide range of suppliers, more
than ten purchases pa per shopper, 45% are online shoppers and a smaller
mobile use.
8
Center for Retail Research - www.retailresearch.org
18Examples: France, The Netherlands, Sweden, Switzerland and Austria, will
grow by recruiting more users as well as persuading shoppers to buy more
frequently.
Immature - online market share below 6.5%, patchy take up (regionally or
demographically) of online retailing, fewer than ten purchases pa, and some
trade sectors are comparatively less developed.
Examples: as Italy, Spain and Poland, have to overcome structural issues in
the quality of their telecommunication networks, but can be expected to
develop rapidly by increasing the number of e-shoppers in their population
and then inducing them to purchase more regularly.
Below are presented some of European countries demonstrating their main e-
commerce features:
19Population - 9.3 mln 15+
E-commerce share – 4.5%
Belgium
Internet users – 86%, 8.0 mln
VAT – 21%
E-shoppers – 6.9 mln, 74%
1 in 4 Belgians shop online on a
“Belgium is an open multi-language community, with Dutch, French and German regions,
and Brussels as an International European hub; this is why Belgian people are top cross-
border EU e-shoppers. “Carine Moitier, CEO of BeCommerce in Belgium
20f
Population - 9.3 mln 15+
France
Internet users – 87%, 47 mln
VAT – 20%
E-shoppers – 36 mln, 67%
“94% of all French web shops offer a mobile site. It is a must have.
French love click & collect”
Marc Lolivier
Director General FEVAD
21Population - 53.6 mln 15+
The United Kingdom
Internet users – 93%, 49.8 mln
VAT – 20%
E-shoppers – 43.44 mln, 81%
“Black Friday has become huge in the U.K.
Over two-thirds of retail site visits are through mobile devices (smartphones and tablets)”
James Roper, Chairman of IMRG
22Population – 70.7 mln 15+
Germany
Internet users – 89%, 63 mln
VAT – 19%
E-shoppers – 51.6 mln, 73%
“In Germany, free returns are expected amongst most customers; a seller is usually
expected to accept returns as a gesture of goodwill.”
Tim Arlt
CMO of Händlerbund
23Population – 52.5 mln 15+
E-commerce share 2.6%
Italy
Internet users – 68%, 35.7 mln
VAT – 22%
E-shoppers – 17.7 mln, 34%
“Home delivery is the standard, but advanced logistics services such as pickup points and
same day delivery are becoming popular
Mobile is more and more relevant in online purchases.”
Roberto Liscia
President of ConsorzioNetcomm
24Population – 39.3 mln 15+
Spain
E-commerce share 3.6%
Internet users – 80%, 31.4 mln
VAT – 21%
E-shoppers – 16.6 mln, 42%
“The availability of delivery options is more important than price.
Create a good mobile experience, as mobile e-commerce is 26% of total e-commerce”
José Luis Zimmermann
CEO of Adigital
25Population – 4.7 mln 15+
Denmark
E-commerce share 24.0%
Internet users – 97%, 4.6 mln
VAT – 25%
E-shoppers – 3.7 mln, 42%
“Mobile First –Tablets and smartphones account for 15% of all ecommerce purchases in
2016.
Average return rate is 3.8%”
Niels Ralund
CEO of FDIH
26Population – 17 mln 15+
Romania E-commerce share 3.1%
Internet users – 62%, 10.5 mln
VAT – 19%
E-shoppers – 1.9 mln, 11%
“Black Friday in November is the main shopping event
“Cash on delivery is the preferred payment “
Florinel Ioan Chis
Director Armo
271.6 Mobile E-commerce
Day by day the current mobile e-commerce is taking a more solid position in
nowadays e-commerce market having different popularity among different countries.
Compared with usual e-commerce industry in this case we deal with another factor
which is defining the eventual result. Mobile e-commerce intends people who has in
possession a Smartphone and use it for such kind of activities like online shopping.
In most of the cases the mobile is used to look for the product information and price
comparison, as well as to have a look on consumers’ feedbacks and
recommendations. As a matter of fact, the PayPal, an American online payments
system largely recognized and credited in all over the world, decided to make a
research aimed to discover more details. The survey was conducted by IPSOS,
which is a global market research and consulting firm founded in 1975 in Paris.
17,500 consumers were interviewed across 22 markets and here are the main
findings provided for PayPal:9
1 out of 3 online shoppers do their online purchases using their Smartphone
Age group of mobile shoppers is 18-34 years
Forecasted compound annual growth of 42%
More popular among in Eastern and Southern Europe
As it was mentioned before the percentage of mobile shopping is greatly varying
among countries, for instance in Turkey 53% of online shoppers is actively using the
Smartphone, whereas in Netherlands only 17%.
9
“PayPal Cross-border Consumer Research 2016”
28Figure 7. % of online shoppers who made an acquisition using a mobile phone
Source: PayPal 2014. IPSOS global research
In a global image of course China is the leader, followed by United Arab Emirates
and Turkey. As regards the Europe, in Nordic countries mobile shopping is not as
widely accepted, by the way a promising growth is forecasted for those countries.
Another American multinational company named RetailMeNot (founded in 2006,
headquarters in Austin, Texas) dedicated a research to Mobile E-commerce based
on a report carried out by Center for Retail Research in January 2015, which is
revealing a lot of notable facts.
29In Europe the percentage of Smartphone adoption differs significantly, in Sweden
75% of population has a Smartphone, whereas the country with the lowest
percentage is Poland 42%. 10
According to this research another fact is that Americans are visiting ecommerce
websites more often than Europeans. 74% of surveyed Americans have checked the
product webpage, and only 46% of Europeans did. The figure below shows the
detailed results both for the USA and Europe:
Table 2. Users who visited the retail’s website
Great Britain 72% RetailMeNot also focused on the forecasted growth
Sweden 62%
Germany 60% for M-commerce in Europe. It shows that in Europe
Netherlands 59% the biggest growth can be found in Poland
France 49%
Spain 28% (Smartphone: +100%, tablet: +121%), Spain
Poland 24% (Smartphone: +73%, tablet: +132%) and Germany
Italy 15%
Canada 59% (Smartphone: +108%, tablet: +96%).11
Europe 46%
USA 74%
Figure 8. Satisfaction of online consumers by their shopping via mobile.12
Source: IAB “A global perspective of mobile commerce”
10
Centre for Retail Research “Online Retailing in Europe, the U.S. and Canada 2015-2016 ~ A Research Report
for RetailMeNot, Inc.”
11
Ibid
12
IAB “A global perspective of mobile commerce”
301.7 Impact of E-commerce on the Economy
For the sake of understanding how the ecommerce nowadays affects the entire
economy the GDP data (Gross Domestic product) will be a perfect illustration.
Europe’s Gross Domestic Product amounted to approximately 14.6EUR trillion in
2015 and the share of European ecommerce in that number is 2.59% which
according to some estimation is going to be doubled by 2020. Definitely this number
created both new jobs in ecommerce sector and B2C active websites.
+2.5 million jobs created
directly and indirectly
+2.5 million jobs
created directly and Market share of
indirectly Ecommerce in
Europe’s GDP is
750.000 new B2C 2.59%
websites growing 1%-
15% per year.
750.000 new B2C Market share
websites growing
+4.2 Billion per
parcels
of Ecommerce
1%-15% year.
sent across Europe, in Europe’s
estimated to grow GDP is
continuously 2.59%
According to European Ecommerce Report 2017 presented in Brussels by
Ecommerce Europe and Ecommerce foundation, it can be clearly detected the
tendency of turnover increase (15% to 530 EUR billion in 2016).13 As well as, the
forecast for the 2017 are promising the continuous growth reaching around 602 EUR
billion having a 14% growth rate.
13 European Ecommerce Report 2017
31Figure 9. E-commerce growth
Source: Ecommerce Foundation 2017
As stated by Markus Tuschl Global Director of Digital Retail “Ecommerce in Europe
is very dynamic and we observe very distinct stages of this development by country,
impacting on the overall retail environment. E.g. in some South Western European
Countries the early growth phase of online shopping drives the markets. In other
more mature online markets a second impulse can be observed, triggered by the
results of the disruptive impact that ecommerce had during the last decade on the
retail scene”. The statistics collected from Eurostat proves that online shopping
significantly differs from one country to another. The predominant parts of online
shoppers are in the UK composing 87%, whereas the smallest share belongs to
Romania with 18%. Based on this consequently the UK is the one having the highest
E-GDP.
The analysis includes different parts of Europe and it can be clearly outlined that
Western Europe covers the largest Ecommerce sector taking more that 53% of the
total turnover. Later on Central and Southern Europe follows with 20.68% and 11.
20% as illustrated on Figure 10 below.
32Figure 10. Percentage of total e-commerce sale per region, Europe 2016
Source: Ecommerce Foundation 2017
As we can see from Figure 10, Western Europe is the leader in e-commerce market.
By the way, taking into consideration the growth rates of Southern Europe, it is on its
rise and in 2016 demonstrated 15% of augmentation and is forecasted 18% of rise in
2017. Whereas the forecasted increase for Western Europe in 2017 is only 13%.
1.8 E-shoppers’ and E-retailers
1.8.1 E-shoppers in Europe from 2015 to 2021
The statistics done by Statista, one of the leading statistics companies on the
internet, provides not only the number of e-shoppers but also the forecast till 2021.
The increase is quite promising since according to the data the increment will reach
to 377.5 million in 202114.
Nowadays the e-shopping is well spread among different age groups, but of course
the youth is the most active. 15
14
Statista “Number of e-commerce users in Europe from 2016 to 2021”
15
Digital economy and society in EU http://ec.europa.eu/eurostat/cache/infographs/ict/bloc-2a.html
33 16-24 years old – 68% active e-shoppers
25-34 years old – 75% active e-shoppers
35-44 years old- 64% active e-shoppers
Figure 11. Factors driving purchase decisions, 2017
So, as it can be seen from Figure 11, the price and new trends play a crucial role in
making decisions while shopping. Feedbacks also can have a significant effect,
which makes many e-retailers to pay a lot of attentions to the reviews that they are
receiving from their clients. Below, as presented in Figure 12, are demonstrated
most popular platforms for feedbacks.
Figure 12. Feedback and social media
34Source: KPMG, Global Online Consumer Report, 2017
In this section of the study will be demonstrated number of aspects regarding needs
of e-shopper with a special emphasize on each of them. The survey conducted by
Copenhagen Economics “E-shopper survey” among 3,000 e-shoppers in Germany,
Sweden, the UK, Poland, Spain and Estonia shows all the needs of nowadays’ users
on the online platform. 16
1.8.2 Delivery prices
It can be truly considered the aspect having the biggest influence on the decision of
the e-shopper. As a matter of fact, this feature is closely connected to the consumer
fidelity. Once purchasing from an e-retailer who is offering the most convenient
delivery prices, the e-shopper definitely is going to add it in its list for preferred e-
retailers. By the way, it is worth mentioning that in most of the cases delivery prices
are not totally on charge of e-retailers, but on delivery operators. Obviously, each e-
retailer is deciding itself whether to make changes or not in product price for the sake
of not losing clients in future. According to the “E-shopper survey” here are some
other features related to price-delivery scheme:
Figure 13. Importance of delivery features
Source: Copenhagen Economics
16
Copenhagen Economics “E-commerce and delivery”
35As it can be seen, almost half of the users give their preferences to fast and
convenient delivery options, even if more expensive.
However, the overall image is changing while the comparison is done between
delivery options in urban and rural locations. Big cities, where are present numerous
physical stores are offering a variety of products with more or less similar prices,
creating a strong competition for e-retailers. Hence, it is expectable that online stores
eager to deliver the items as soon as possible for the sake of being equal with
physical stores in terms of obtaining the product in shorter terms.
1.8.3 Return options
Each e-retailer is quite aware that online purchases can sometimes delude
consumers’ expectations for a number of reasons, consequently creating a need to
send it back. So, returns are making a significant influence on the purchasing
decision. By the way, return options have their own peculiarities and can be
classified as follows:
Return to a post office/collection point
Tracking a return parcel
Possibility to return immediately at the moment of delivery
Returning to a physical store
According to the “E-shopper survey” which was applied in 5 different EU countries
represent the following level of importance of each return characteristic mentioned
above:
1. Return product immediately at the moment of delivery
2. Take the return parcel back to a physical store
3. Organize a specific pick with the delivery operator
4. Track and trace of return parcel
5. Take the parcel to a post office/collection point
361.8.4 Speed of delivery
Taking into consideration the competition nowadays, e-retailers are making each and
every effort possible to satisfy the e-shoppers’ needs. Currently, it became already a
common thing to have the ordered object in 2-4 working days. E-retailers are offering
a variety options of delivery time: standard, express delivery, evening delivery,
Saturday delivery, etc.
In all 5 countries participating to the survey, express and Saturday deliveries are
preferred more.
1.8.5 Delivery point
In most of the cases, as delivery place is mentioned home or post office. Other
available possibilities are as follows:
1. Delivery to home address
2. Delivery to post office
3. Having the ability to redirect the parcel to a different delivery point
4. Delivery to neighbor in case that no one is home at the time of delivery
5. Delivery to work address
6. Delivery to parcel kiosk
1.8.6 Extra services
There are number of extra services widely offered by online companies in order to
facilitate the purchasing process, as well as to have a control till the last minute. For
example, nowadays in extensive usage we witness the service of “track and trace”
and “electronic notifications”. Besides, a consumer can also order an insurance for
his/her order, hence being sure that in case of damages he/she will get a
reimbursement. The figure below illustrates the main preferences of e-shoppers for
existing services:
37Figure 14. Preferences of e-shoppers
Source: Copenhagen Economics, E-shoppers’ survey
Another interesting fact can be cited from another research conducted among
10.000 international e-shoppers by Pitney Bowes, 2011, where 21% of respondents
definitely highlight the possibility to check the itinerary of their order as the most
important service. In a study about cross-border e-commerce in 2010, done by
International Post Corporation, it was found that e-shoppers in six Member States
consider delivery notifications important when shopping online. However, the relative
17
importance of delivery notifications was found to differ across countries.
1.8.7 E-retailers’ needs
In this section each and every features described for e-shopper is converted and
presented from the e-retailers’ point of view.
All the characteristics of delivery having a serious effect on e-retailers’ activity are as
follows:
Delivery to home address
Tracking the order
Electronic notification of delivery
Delivery within 2-4 days
So, as it can be seen the features are equal with those presented in the section of e-
shoppers’ needs. By the way, in their case it is very important to take into
17
International Post Corporation, IPC (2010, p.28) https://www.ipc.be/
38consideration the domestic and cross-border delivery features. So, as we can
witness from the figure below, e-retailers pay more attention on their home country
delivery processes rather than cross-border.
Figure 15. Delivery price – domestic vs cross-border delivery
Source: Copenhagen Economics: E-retailer survey
This behavior is usually explained by the fact that they know better their home
consumers, their requirements and especially expectations. Additionally, they tend to
attract their domestic users, in this way not letting them to use cross-border e-retailer
services.
1.8.8 European E-Retailers
Based on different researches it is defined that most of the shoppers prefer more to
buy online rather than the traditional method. Of course, significant aspects making
them to choose online shopping is the easiness of choice and time saving.
Consequently, online retailing is becoming more attractive some a large number of
products. Everyday growing and developing mobile technology is on the center of
online retailers.
The Study
The Center for Retail Research has conducted a study which was funded by
“RetailMeNot” as a contribution to discussion on trends within the sector.
RetailMeNot is a leading digital savings destination, providing hundreds of thousands
of digital coupons and offers on its websites. There were more than 675 mn visits to
39its websites in y/e 30 September 2016 and 19.2 mn unique mobile visitors in
2016,Q2. The portfolio of coupon and deal websites includes RetailMeNot.com
(U.S.), VoucherCodes.co.uk (UK), Ma Reduc (France) and the French cashback
service Poulpeo.18 The Centre for Retail Research has forecast the trends in online
retail sales for Europe (and the US for more than ten years).
Here are the parameters of the research:
First of all, the definition used as a being “online” by Center for Retail Research is as
follows: the final transaction is made over the internet or at a distance, irrespective
of whether the internet has been used for browsing and price comparisons.
Project Details:
Calculation based on the sales of goods (excluding fuel for vehicles and sales
of prepared food in cafes and restaurants).
Excluded tickets, holidays, gambling and insurance (because they are not
classed as retailing). Sales made using mobile phones and tablets are
included in figures.
One thousand shoppers in each country (a representative demographic cross
section)
100 online traders in each country (although 600 consumers and 60 retailers
in the smaller countries)
Main Findings:
Europe Growth Rates
2015 – 18.2% 2017-14.2%
2016-15.6% 2018-13.8% expected growth
Dominating countries: the UK, Germany and France responsible for £152bn
online sales, equivalent to 75.1% of European online sales.
18
Center for Retail Research - www.retailresearch.org
40Table 3. Online Retail Sales and growth rates 2016 and 2017
As it can be concluded from above stated numbers the regular and unceasing
growth is noted starting from 2015.
The annual growth rates for all types of retailing (from stores and online) have
ranged between an average of 1.5% and 3.5%.
Market shares
Since this study included also the USA, it is worth mentioning that anyway the United
States are prevailing in the online market and are considered true leaders of the
current situation. There are 11 countries in the European Union composing all
together 414mn, whereas in the US there are 316mn. In average every European
spends annually €1,062.02 compared to €1,702.43 in the US (during 2016).
Global Retail Index and The Largest E-Retailers in Europe
The Global retail development Index has started its investments since 2002. Annual
reports are being published by AT Kearney which is an American global
management and consulting firm founded in 1926 by Andrew Thomas Kearney. The
41company has 60 offices in more than 40 countries over the world generating $1.1
billion of revenue.
To rank the countries, the company is using 4 main categories:
Online Market Size
Consumer Behavior
Growth Potential
Infrastructure
Making an accent only on European countries evidently the United Kingdom and
Germany are the true leaders (after USA and China). Below is presented the table of
Global E-Retail Development Index 2015 with all abovementioned categories.
The Belgian and Danish markets are progressing in leaps and bounds having a
positive change in global rank by 15 and 13 points correspondingly. This positive
position change is providing countries with high growth potential scores as presented
on the table.
Figure 16. Global Retail E-commerce Index (global online market attractiveness)
Source: A.T. Kearney 2015
Another study regarding e-retailers is conducted by British company Deloitte which is
one of “Big Four” accounting organizations and the largest network for professional
services. According to their research, in all over the world there are 50 big online
retailers and 19 of them are from Europe. Deloitte listed them in the report conducted
42in the framework of 20th annual Global Powers of Retailing which identified the 250
largest retailers around the world based on publicly available data for FY2015
(encompassing companies' fiscal years ended through June 2016).
In the report Deloitte analyzed the ranking of top 50 e-retailers and as stated in the
same report the passage to online platform makes retailers to think twice about their
future development and enlargement strategies.
For FY2015, e-commerce sales information was available for 182 of the Top 250
retailers (either as reported by the company or estimated by Planet Retail, Internet
Retailer, or other sources).19
Below are presented the highlights from the report which outline the most crucial and
critical points relative to e-retailers:
Rapidly increasing number of retailers establishing online stores for their
companies. Around 220 out of 250 big retailers have their online website
providing their services. The others are mostly operating in the sector of
supermarket, convenience stops, etc.
18.3% growth rate of online sales. This compares with e-commerce growth of
20.3% in 2014 and 21.1 % 2013. If Amazon.com, JD.com, and Vipshop—the
three web-only retailers among the Top 250—are excluded from the analysis,
2015 e-commerce growth drops to 15.5% and total growth falls to 3.5%.
In 2015 online sales guaranteed 35.3% of revenue growth for 151 companies
out of 250 (excluding 22.5% of Amazon, JD and VipShop). That’s why
nowadays for majority e-commerce is strongly considered as a unique engine
to accelerate the growth process.
Only for 41 companies the newly established websites have brought negative
retail results. For 33 companies it obviously assisted to offset contracting
sales. For 12, it saved them from having negative retail revenue.
Dominating E-50
As it was mentioned before, Deloitte listed the top 50 e-retailers among 250 retailers,
and some interesting facts are following:
80% of e-50 companies are among Top 250 retailers
19
Deloitte “Global Powers of Retailing 2017. The art and science of customers”
43 19 companies are based in Europe, 26 in the USA, the remaining 5 from China
and Brazil (third-party marketplaces are excluded from the e-50)
12 of top 50 are non-store companies, not having any physical representation.
Such as Wayfair and Bluestem Group.
Because of currency depreciation in dollar-denominated ranking some
companies (5 from top 50) dropped from the high ranked e-retailers list. Such
as French Auchan, and Russian Ulmart
In 2015 e-50 retailers provided pace growth of 19.6% (compared to 2011 it
was 22.0%)
Taking into account the arguments highlighted in the analysis done by Deloitte,
uncompromisingly it is leading to the conclusion that the majority of retailers are
contemplating about their status in online landscape and making efforts to have a
solid presence in e-commerce market.
Table 3. Top 19 European e-retailers
Source : Deloitte Touche Tohmatsu Limited. Global Powers of Retailing 2017. Analysis of financial performance
and operations for fiscal years ended through June 2016 using company annual reports, Planet Retail database
and other public sources.
44The most popular company is the UK, where 9 companies are based. By the way,
the 1st e-retailer in Europe by the sales ranking is Germany with the company “Otto”,
following by Tesco from the UK and Casino from France.
Illustrations below fully reveal the current situation in each EU country, highlighting
the peculiarities and important data about each of them.
45CHAPTER 2
CROSS-BRODER E-COMMERCE AND GEO BLOCKING
2.1. Cross-border B2C E-commerce
If speaking about e-commerce globally, it should be mentioned that in a global scale
cross-border trading has matured and increased quite enough. According to
Payvision’s report 2016 cross-border e-commerce makes up for 21% of total Global
Online Trade.20 Payvision is one of the fastest expanding global acquiring networks
in the world, offering banks, PSPs, ISOs and merchants one global acquiring
platform which significantly simplifies the complexity of cross-border ecommerce.
Cross-border ecommerce is a percentage of е-commerce obtained on overseas
sites, which is getting more and more popular among e-shoppers in EU. 18% of
them are making a cross-border purchase from another European country.
Figure 17. Cross-border purchases
Source: Payvision Report 2016
20
Payvision Report 2016 “Key Business Drivers and Opportunities Cross-Border Ecommerce 2016”
https://www.payvision.com/sites/all/themes/payvision/images/key_business_drivers_and_opportunities_2016_c.pdf
46By the way, there are still some barriers which prevent e-shoppers to trust totally to
cross-border and to shop lot. One of those reasons is that compared to national
markets, in case of returns it will be much complicated and time consuming, the
troublesome procedures hamper cross-border e-shopping. The figure below shows
some main reasons which in some way impede the boosting of cross-border e-
commerce.
Figure 18. Main problems of cross-border e-commerce
Source: Eurostat 2016
Two biggest obstacles are the speed of delivery and technical failure.
Evidently the United Kingdome is the most preferred country for cross-border
shopping followed by Germany and France21. Nordics and France notably are
mostly inclined to shop from German online market. As mentioned in the report of
Research and Markets 2017, the Germans mostly spend their money for British,
American and Chinese markets, whereas in Austria more than 78% of online
shoppers make orders outside from their country.
International Post Cooperation (IPC) is an association including 24 national postal
offices (in Europe, Asia Pacific and North America) who offers services helping to
manage businesses who include parcel, express, mail, retail, etc. Every year IPC is
publishing the survey regarding the global e-commerce presenting the main findings
21
Research and Markets (The world’s largest market research store), Europe Cross-Border B2C E-commerce
report 2017
47and tendencies. In “Cross-border E-commerce Shopper Survey 2017” 28,892 cross-
border consumers participated from 31 countries.22 The study was done on a global
level and demonstrates the global view of e-commerce around the world. So,
particularly here are the main cross-border purchase countries among European
countries:
UK Germany Denmark
China 40% China 33% China 28%
USA 24% UK 17% Germany 21%
Germany 10% USA 13% UK 18%
Netherlands Slovenia France
China 47% China 40% China 31%
Germany 17% Germany 19% Germany 19%
USA 9% UK 14% UK 15%
Switzerland Austria Hungary
Germany 46% Germany 77% China 60%
China 19% China 10% Germany 9%
France 13% USA 3% USA 7%
China is having a great popularity among EU countries, followed by the USA and the
UK.
The delivery process and its stages are considered crucial for e-shoppers and make
a huge part of consumer satisfaction while evaluating the provided service.
According to IPC results there are six stages of delivery which were surveyed and
asked about their importance. The figure below illustrated the results:
22 International Post Cooperation (IPC) “Cross-border E-commerce Shopper Survey 2017”
48Figure 19. Stages of delivery and their importance
Source: IPC “Cross-border E-commerce Shopper Survey 2017”
2.2 Cross –border E-commerce in the UK: What does BREXIT mean for online
business?
In June of 2016 by a small difference 52% to 48% The United Kingdome decided to
leave the European Union, which was quite a surprising decision both for pollsters
and voters. Obviously this couldn’t leave its impact on the overall economy. As it is
known, the UK was the absolute leader in Europe’s ecommerce for a long period of
time (more than USD 150 billion of revenue). Moreover, on the global image the UK
was the third largest contributor to ecommerce after China and the USA, whose
share is expected to rise up to 19.3% by 2019.23
After the Brexit the opinions of retailers fall out into two big categories. Over half of
retailers are inclined to believe that after the Brexit cross-border e-commerce (and
generally trading) will become more complicated and complex, whereas the
23
“Key Business Drivers and opportunities in cross-border e-commerce 2016” - Payvision
49remaining 44% is convinced that it will not have any significant impact on their
activity. And only 23% is planning to start a new business outside of the UK.
As far as all the world is concerned and interested about the future of retailers in the
UK, the Global-E conducted a research to uncover retailers’ expectations and
feelings about their future development and enlargement after the Brexit. Almost half
(48%) of retailers questioned said they expected the economy to weaken after the
UK triggers Article 50, but 62% feel confident or very confident that their businesses
will flourish.24
“As the Brexit bill moves through Parliament, retailers are facing up to the reality of
what Britain’s exit from the EU might mean, although some retailers have revised
their plans, our research suggests that most are taking a wait-and-see approach,
before considering whether to change course. In the months since the EU
referendum took place, most retailers have already felt some impact, with many of
those that operate internationally seeing an increase in sales from online shoppers
worldwide due to the weakened pound and growing trend for cross-border
ecommerce.” said Nir Debbi, co-founder and CMO, at Global-e, which works with UK
retailers including WoolOvers, Prezzybox, and Crabtree and Evelyn.
As well, two other attitudes are noticed among retailers: preference for “hard” Brexit
or “soft” Brexit. Those who are willing for “soft” solution (46%) are hoping for at least
some access to single market, whereas “hard” Brexit supporters (36%) are in favor
of being totally distracted from the European Union and think that it will be noticeably
better for British retailers.
According to Global-E findings only 16% of retailers will be considering setting their
headquarters outside of the UK for the purpose of having access to single market.
Surveyed decision makers (71%) are assured that in the UK consumers will be
impacted significantly after triggering Article 50. 43% of them is convinced that
British consumer will reduce his/her expenses, whereas 23% is thinking totally vice-
versa.
24 Global-E (Europe’s leading provider of comprehensive cross-border solutions) –internetretailing.net
50You can also read