The Farmland Market - GB farmland market Land use change to 2050 Rural property as an investment - Savills
←
→
Page content transcription
If your browser does not render page correctly, please read the page content below
UK Rural - January 2019

S P OT L I G H T
                        The Farmland
Savills Research
                           Market

  GB farmland market   Land use change to 2050           Rural property as an investment
Foreword

                                                                                 Amenity farms and those with, or the
                                                                                 potential for, a variety of income streams
                                                                                 will continue to be in demand

Farmland values
– a mixed forecast
Land use at home and overseas is heading for significant
changes — diversity and quality will underpin performance
Economic change and uncertainty continue                                         businesses are already evaluating their                 environment/natural capital,
to have an impact on the farmland market in                                      business strategy and succession plans.                 strategic development commercial
Great Britain. Alongside the traditional core                                       On the farmland supply side we expect                and leisure enterprises
drivers of this market some new influences are                                   the overall long term trend of constrained              n There is always a degree of overseas
on the horizon including regulatory change, a                                    activity to remain, but we do predict an                demand, which is currently buoyed by the
shift towards public money for public goods,                                     increase in liquidity in three to five years’           weak pound
enforcement of the polluter pays principle and                                   time. This increased activity is likely to be           n The availability of rollover cash alongside
an increased scrutiny on land value capture.                                     debt driven following interest rate rises, the          increased house building targets
All these will amplify the importance of                                         phasing out of BPS in England from 2021                    Amenity farms and those with, or the
nurturing natural capital, non-farm income                                       and agricultural policy pressures across the            potential for, a variety of income streams will
streams, economic AgTech and innovation                                          devolved governments.                                   continue to be in demand. In contrast, demand
take up.                                                                            We predict that while these events will              for commercial units in need of investment,
   Our forecasts in the graph below are                                          bring more land to the market than has been             without the scope to diversify, is more likely to
average scenarios in a market where there are                                    the case recently, an oversupply is highly              weaken, unless there are neighbouring farmers
a variety of influences and demand profiles.                                     unlikely. Increased supply could adversely              looking to expand.
There will continue to be a wide range of                                        affect average land values, but it is important            In the longer term, there are likely to be
prices achieved either side of the averages with                                 to note there are some underlying strengths to          some very significant changes in land use (see
factors including location, quality and size of                                  the market including:                                   pages 4 and 5) driven by environmental and
holding, as well as neighbouring interest often                                  n In a global context the UK economy is                 climate change targets. We do not anticipate
coming into play.                                                                relatively stable                                       a repeat of the significant price increase
   The regulatory reform position has                                            n Underlying domestic demand for land is                recorded in the decade to 2014, but we do
announced the end of the Basic Payment                                           supported by amenity and lifestyle buyers,              expect the market to return to its long term
Scheme (BPS) by 2027 in England and we                                           as well as those looking to exploit the multiple        historical real-term growth of around 1% per
know, in the light of this, that many rural                                      opportunities for land use; food, energy,               annum (i.e. 1% above inflation).

                                   GB farmland forecasts 2019-2023 Diversity and quality will underpin performance

                                                                                                                                                                                                    250k
                                   8k

                                   7k
                                                                                                                                                                                                    200k
 Average farmland value (£/acre)

                                   6k
                                                                                                                                                                                                           GB farmland supply (acres)

                                   5k
                                                                                                                                                                                                    150k

                                   4k

                                                                                                                                                                                                    100k
                                   3k

                                   2k
                                                                                                                                                                                                    50k

                                   1k

                                   0                                                                                                                                                                0
                                        2007   2008    2009      2010     2011      2012     2013       2014     2015     2016      2017      2018     2019     2020     2021        2022    2023

                                           GB supply          Average value UK farmland             Diversified/amenity farms forecast          Straight commercial farms forecast

Savills data and analysis of the farmland market is for Great Britain only as comparative data from Northern Ireland is difficult to acquire.                                          Source Savills Research

savills.com/research                                                                                               2
Market update
189,000 acres
Amount of farmland in Great Britain marketed during 2018
compared with 152,500 acres in 2017; an increase of 24%
AT A GLANCE
-1.8%
Average value of ‘all
types’ of GB farmland
-2%
Average value of
prime arable land
24%
The farmland market 2018
Muted average value growth and significant price
Supply in GB
variations characterised the market last year
Values to December 2018 publicly brought to the market. investment. Although the overall 31%
Farmland value growth continued During 2018 supply in England proportion is small, there is an
to be muted during 2018, with (132,500 acres) rose by 29%, while indication that the presence of
significant price differences for in Scotland supply (43,000 acres) these buyers in the market has
both land types and regions. Our increased by 6% and in Wales weakened slightly possibly due to
Farmland Value Survey shows 11,000 acres were marketed – an uncertainty in the public subsidy
that during 2018 the average value increase of 23%. Supply in 2018 was regime for farmland and a refocus
of all types of farmland in Great boosted by two large portfolios of investment into alternative
Britain fell by -1.8% to £6,700 per coming to the market, of which asset classes, which are currently
acre. The average value of prime the farmland amounted to around performing better than farmland.
arable land fell by -2.0% to £8,760 20,000 acres. In addition to farms Sales data shows the proportion
per acre. Average values for all advertised publicly there continues of farmers selling has fallen each
land types in Scotland remained to be a healthy private market for year since the EU Referendum in
unchanged, whereas average values farms and estates. 2016. In 2018 farmers represented
in England and Wales fell -1.8% and 39% of all sellers; the lowest figure
-3.9% respectively. Buyer and seller profiles in 2018 recorded for at least 25 years. This is Supply in England
Across England values for arable Analysis of transactions during despite the highest area marketed
land continued to show the widest 2018 where Savills acted for either since 2008 (as noted above) 25%
range of values, but the period of the buyer or seller shows that the suggesting that farmers are adopting
price adjustments of the past four buyer profile has been fairly static a ‘wait and see’ position in the current
years appears to be easing, with over the past five years. Farmers political and agricultural policy
clear signs that values for most represent around 45% of all buyers, climate. This is also supported by a
regions and land types have now with 85% buying to expand current significant fall in the proportion of
stabilised, albeit at a very local, operations. Around half of buyers debt related sales during the past
almost farm by farm level. are private non-farming/lifestyle year; at 14% of all transactions, it was
purchasers, who cite a variety of significantly lower than the 20% Supply in Wales
Supply to December 2018 reasons for buying from residential recorded over the previous three
In Great Britain 187,000 acres and sporting (18%) to investment years. Defra’s estimate of the 2018 6%
of farmland were marketed (23%) and expansion (39%) of Total Income from Farming in the
during 2018, compared with existing land holdings. UK is 15% lower than in 2017, which
152,500 acres in 2017; an increase The remainder are institutional was the highest in real terms for over
of 22%. This was the highest level and corporate buyers, including 20 years. We suspect that we will
Supply in Scotland
of market activity since 2008 conservation organisations, see more debt related sales in the
when over 195,000 acres were who are principally buying for next few years as noted previously. Source Savills Research
3Land use
24.2m
The number of hectares
72%
Agricultural area as a
17.6m
The number of hectares of
of land in the UK proportion of all UK area agricultural land in the UK
Current land use
across the UK
The total agricultural area
in the UK is around 17.6
million hectares, with
40%
an additional 3.2 million Permanent Grass
hectares covered by 9.74 million ha
woodland and forests. The
agricultural area, excluding
woodland, accounts for 72% 6%
Temporary Grass
of the total area of land.
(Under 5 years)
The agricultural area has
1.39 million ha
declined by around 26,000
hectares per year over the
past 20 years. Reasons 2%
for this include transport Green Urban
0.60 million ha
infrastructure, building,
woodland expansion (which
has more than doubled over 5%
the past 20 years), non- Rough Grazing
agricultural use (golf courses, 1.20 million ha
minerals, etc) and some has
been lost to the sea. 6%
Cereals make up 60% Other – marshes,
of the arable land, of rocks, beaches/
which 54% is wheat. The dunes, intertidal
grassland is utilised by: flats
1.48 million ha
1.6 million dairy cows plus
followers with an average
herd size of around 140
cows; 1.4 million breeding
beef cattle plus followers
(average herd is 80 cows);
and 15 million breeding
sheep (average flock is
275 ewes).
There are around
192,000 farms in the UK. 13.1%
Only 20% of these are over Broadleaf Woodland
250 acres. The larger farms 3.17 million ha
cover three quarters of the (broadleaf & conifer)
farmland. Around 50% of
all holdings are under 50 1%
acres, with many farms Non-Agricultural
being family-run units. Land
Soil type, topography, and 0.32 million ha
climate determine the type
of enterprise that is suitable 5.9%
for a particular farm. Built-on
The current structure 1.43 million ha
of agriculture in the UK is
diverse, but it has changed 20%
significantly over the past Arable cropping
30 years. UK agriculture 4.92 million ha
is on the cusp of an era of
significant reform – what
changes will the next 30
years bring? On the opposite
page we look at how land
use might look in 2050.
Source Defra and Savills Research
savills.com/research 4Land use
10m
The number of hectares of agricultural
31%
Percent reduction in
7.5m
Number of hectares ‘released’ from agricultural
production potentially reduced to agricultural area production and available for other uses
Could a third of UK land area change use by 2050?
The diagram below illustrates the potential area of land needed for agricultural
production (grey dots) in 2050 and the areas that might be ‘released’ from current
land uses and available for alternative uses including boosting food production
The next 30 years are likely to see some
significant changes in land use across the
UK that will no doubt impact on the tenure
of farmland and its capital and rental values.
41%
Agricultural
New opportunities will arise from ‘natural production
capital’ – this concept offers a broader range 10.00 million ha
of possibilities, including external private
investment, for landowners than public
money alone. 16%
‘Released’ from
The main driver is clear – agriculture is
Permanent Grass
one of the largest Green House Gas (GHG) 4.00 million ha
emitters at 11% of the UK’s overall figure in
2016 as reported by the Committee on Climate
Change (CCC), which can be accessed at 11%
‘Released’ from
https://www.theccc.org.uk/publications/
Arable cropping
2.70 million ha
Agriculture production area – according
to the CCC this could shrink by 30% by
2050 (see map 2 compared with map 1). This
scenario would make the maximum use of
innovation and technology, need high levels 3%
‘Released’ from
of change in behaviour towards healthy eating
Temporary Grass
guidelines, the willingness to try novel food 0.70 million ha
sources and significantly reduce waste.
The area ‘released’ could be used for
more trees, environmental adaption, 1%
‘Released’ from
renewable energy or indeed to increase
Rough Grazing
agricultural production.
0.20 million ha
1
Trees – inc. commercial forestry,
hedgerows and agroforestry 28%
To meet GHG capture targets up to Other (woodland,
marshes, etc, built-
1.5 million hectares of new woodland
on, green urban)
would be needed to store carbon by
6.68 million ha
2050. In addition, to help mitigate GHG
emissions and increase biodiversity while
maintaining food production there is
3
likely to be an increased area of agroforestry
and hedgerows. Energy The next 30 years
2
Significant planting of second
Environmental adaption generation biomass energy crops
are likely to see some
including reclaiming peatland such as short rotation coppice significant changes
In 2017, 6.8 million hectares or and forestry – up to 1.2 million in land use across
27% of the UK land area were hectares for bioenergy crops by 2050.
under environmental designations. The area occupied by renewable energy
the UK that will no
These include National Parks and Areas of infrastructure – especially ground mounted doubt impact on the
Outstanding Natural Beauty. These are under solar and feedstock for AD plants – is likely tenure of farmland
review and are likely to expand. Peatlands to increase.
and its capital and
4
account for around 12% of the UK land area,
but only around a quarter is in a near-natural Housing and Infrastructure rental values
or re-wetted state. Restoration and rewetting By 2050, 0.3 million hectares
of degraded peatland currently under might be required for housing and
agricultural and forest land use will make a infrastructure. This equates to
significant contribution towards the 2050 2.7% of UK land use and increases
emission targets. the current ‘built–on’ area by 21%. Source Defra, CCC and Savills Research
5Rural property as an investment
Total return annualised over 20 years:
11.4% 10.9% 8.5% 5.9%
Residential Let land Commercial Equities
Comparative investment performance
Farmland and forestry have delivered healthy investment performance over the long term
Let Land Farming Top 25% Forestry Let Residential
1.6% 6.3% 7.6% 10.9% -0.3% 3.7% 8.9% 8.0% 13.9% 13.7% 15.8% 10.2% 7.0% 9.5% 7.2% 11.4%
1yr
1yr 5yrs 10yrs 20yrs 5yrs 10yrs 20yrs 1yr 5yrs 10yrs 20yrs 1yr 5yrs 10yrs 20yrs
Commercial – All Equities Gilts Gold
9.6% 10.9% 5.7% 8.5% 11.8% 9.2% 5.6% 5.9% 1.8% 3.3% 5.9% 6.0% 0.4% -5.5% 6.1% 6.9%
5yrs
1yr 5yrs 10yrs 20yrs 1yr 5yrs 10yrs 20yrs 1yr 5yrs 10yrs 20yrs 1yr 10yrs 20yrs
Let farmland includes farmland, residential and commercial assets on rural estates and farms. Data is from
a variety of sources including Savills own databases and analysis, MSCI, Defra and KITCO. The Farming
Top 25% returns are modelled for high performance arable farming. The model takes into account the
capital value of land and tenant’s capital, but excludes the residential element. Net income and tenant’s
capital is derived from Defra/FBS data and the land value from Savills Farmland Value Survey.
Source Savills Research
savills.com/research 6Rural property as an investment
the prime attraction for holding
agricultural land is the long
term capital appreciation
WHY INVEST
IN FARMLAND?
There are strong reasons to own
and/or invest in farmland including:
n Investment performance – driven
by capital growth (over the past
10 years, the value of GB farmland
has, on average, increased by just
over 50%)
n Opportunity to diversify an
investment portfolio. Farmland is
inversely correlated to many other
assets and therefore tends to perform
when other assets are under pressure
n Low-risk investment in a very
transparent market place and in a
relatively stable political, economic
(albeit with a degree of uncertainty
in the short term) and cultural
environment. Entry and exit from the
market is relatively easy to achieve
n Income generation – land-based
opportunities extend beyond
food production and diversified
income sources mitigate exposure
to commodity price volatility and
include:
– Energy
– Forestry
Rural asset performance – Diversification and non-farming
opportunities, including leisure and
tourism enterprises
driven by capital growth – ‘Natural capital’ assets and the
developing market for payments
for ecosystem services from both
Rural property is a comparable investment to alternative public and private buyers
property assets and financial instruments – Property rental from residential
and commercial assets
Rural property, notably let estates, farms and its performance is relatively recession proof. n Lifestyle – ownership provides
forestry, has been a comparable investment This last point results in a low or negative somewhere to live, work and play, and
to alternative property assets and financial correlation with other traditional asset classes fulfils an aspiration ‘to own a piece of
instruments over the past 20 years (see page 6). such as stocks and bonds, giving an interesting the countryside’
It has delivered a healthy annualised total return portfolio diversification. For investors the prime n Taxation advantages – these
of around 10% only beaten by mainstream let attraction for holding agricultural land is the include Inheritance Tax relief and the
residential portfolios with an annualised total long term capital appreciation as income yields rollover of capital gains into farmland
return of 11.4% over the same period. are historically modest compared to commercial n Strategic development potential,
The scenario is pretty similar over the past 10 property. especially where land borders
years albeit at a slightly lower level of return (8% The mix of assets on rural estates is settlements, offering additional
to 9%), but the star performer was forestry with fundamental to its income and investment capital growth
an annualised total return of almost 16%. performance. Although income generation and n Capital availability – assets, such
Short term, the performance of rural assets, retention of the core estate are the key objectives as minerals, residential properties,
mainly because of pressure on capital values of for many estate owners and managers, the off-lying land, can be used to
farmland, has weakened. The exception being Agriculture Bill heralds a new era in the rural release capital
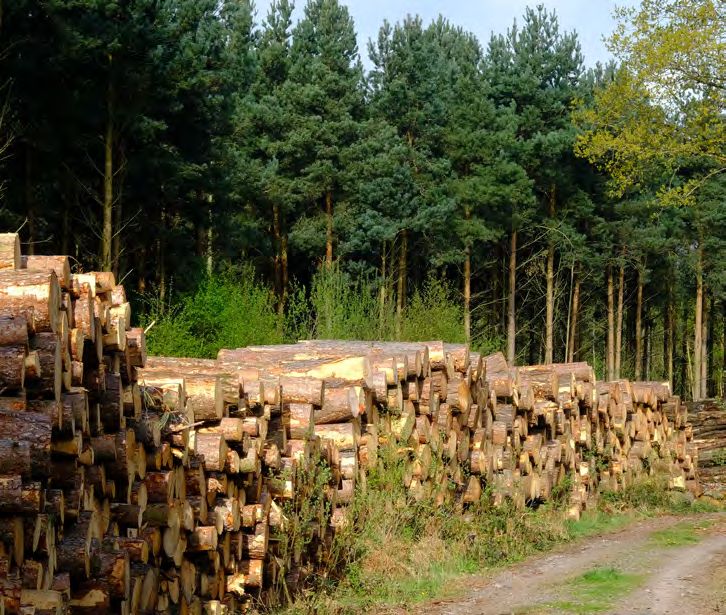
forestry, where the underlying fundamentals are economy, challenging everything from tenancy
based on the growing demand for sustainably arrangements to supply contracts. These attributes outweigh the
produced timber required for house building The key is to spread risk and have a balanced constraints, which include:
around the world. asset portfolio that meets its performance n Limited opportunities to achieve
It is worth noting that rural assets have objectives. Our market intelligence and work farm businesses of scale in the UK
advantages over other assets based around for existing clients shows that finding land and n Relatively low income yields
taxation and ownership benefits. Farmland property in or near towns and cities or overseas n Generally a lack of product in
is a tangible asset, a good inflation hedge and is a clear investment strategy. a constrained market place
7For more information about this report, please contact us Emily Norton Alex Lawson Charles Dudgeon Daniel Rees Rural Research National, Farm & Estate Sales Scotland, Farm & Estate Sales Wales, Farm & Estate Sales 020 7016 3786 020 7409 8882 0131 247 3702 029 2036 8915 emily.norton@savills.com alawson@savills.com cdudgeon@savills.com drees@savills.com Savills plc is a global real estate services provider listed on the London Stock Exchange. We have an international network of more than 600 offices and associates throughout the Americas, the UK, continental Europe, Asia Pacific, Africa and the Middle East, offering a broad range of specialist advisory, management and transactional services to clients all over the world. This report is for general informative purposes only. It may not be published, reproduced or quoted in part or in whole, nor may it be used as a basis for any contract, prospectus, agreement or other document without prior consent. While every effort has been made to ensure its accuracy, Savills accepts no liability whatsoever for any direct or consequential loss arising from its use. The content is strictly copyright and reproduction of the whole or part of it in any form is prohibited without written permission from Savills Research.
You can also read