The fossil fuel end game - A Frontline Vision to Retire New York City's Peaker Plants by 2030 - Clean Energy Group
←
→
Page content transcription
If your browser does not render page correctly, please read the page content below
March 2021

A PEAK Coalition Report

the           A Frontline Vision to
              Retire New York City’s
              Peaker Plants by 2030

fossil
fuel
end
game
                                       New York City Environmental Justice Alliance
                                           New York Lawyers for the Public Interest
                                 THE POINT CDC • UPROSE • Clean Energy Group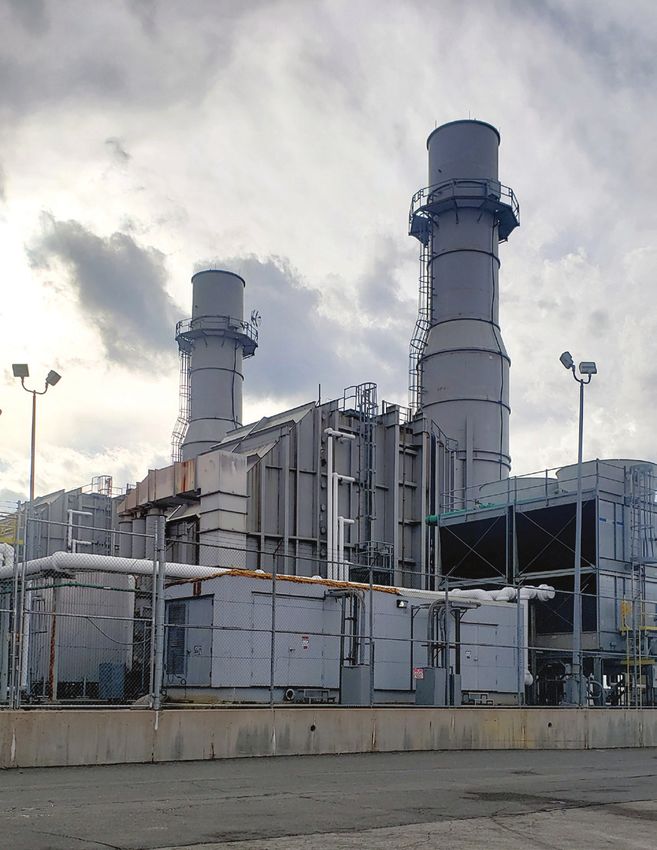
the fossil fuel end game • ii • A PEAK Coalition Report

ABOUT THE PEAK COALITION
The PEAK coalition—UPROSE, THE POINT CDC, New York City Environmental Justice Alliance
(NYC-EJA), New York Lawyers for the Public Interest (NYLPI), and Clean Energy Group (CEG)—
has come together to end the long-standing pollution burden from power plants on the city’s
most climate-vulnerable people. This coalition will be the first comprehensive effort in the US
to reduce the negative and racially disproportionate health impacts of a city’s peaker plants by
replacing them with renewable energy and storage solutions. Our collaboration brings technical,
legal, public health, and planning expertise to support organizing and advocacy led by commu-
nities harmed by peaker plant emissions. Together with communities, we are advocating for a
system of localized renewable energy generation and battery storage to replace peaker plants,
reduce greenhouse gas (GHG) emissions, lower energy bills, improve equity and public health,
and make the electricity system more resilient in the face of increased storms and climate
impacts. This report lays the groundwork to make the case for that transformation.

ACKNOWLEDGEMENTS
The Fossil Fuel End Game was prepared by Strategen Consulting on behalf of and in collabora-
tion with the PEAK Coalition. This report was made possible through the generous support of
The Scherman Foundation’s Rosin Fund, The JPB Foundation, The New York Community Trust,
and the Merck Family Fund. The views reflected in the report are entirely those of the authors.

Cover Photo: Joseph J. Seymour peaker power plant in Sunset Park, Brooklyn. Courtesy of UPROSE
the fossil fuel end game • iii • A PEAK Coalition Report

    The Fossil Fuel End Game
A Frontline Vision to Retire New York City’s Peaker Plants by 2030

                 A P E A K C oalition R eport

                                Prepared by

            Strategen Consulting on behalf of the PEAK Coalition

                               Foreword by

                New York City Environmental Justice Alliance
                  New York Lawyers for the Public Interest
                             THE POINT CDC
                                 UPROSE
                            Clean Energy Group

                            MArch 2021

                           www.peakcoalition.org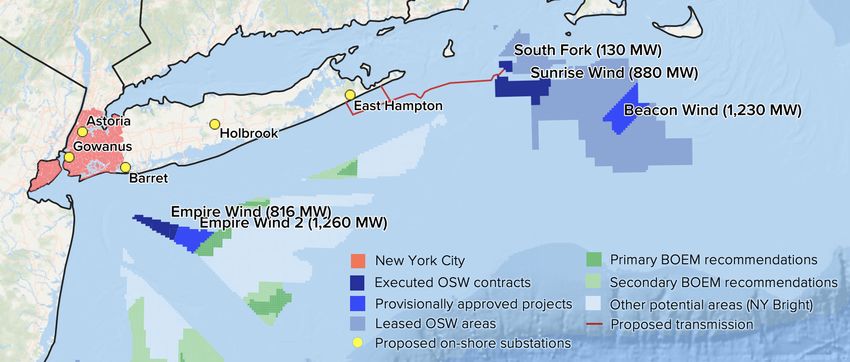
the fossil fuel end game • iv • A PEAK Coalition Report

            Foreword

           L    ast year the PEAK Coalition—a group comprised of environmental justice and clean energy advocates
                that includes New York City Environmental Justice Alliance (NYC-EJA), UPROSE, THE POINT CDC,
            New York Lawyers for the Public Interest (NYLPI) and Clean Energy Group (CEG)—launched a new campaign
            to end the long-standing pollution burden and injustice on low-income communities and communities
            of color from “peaker” power plants in New York City. The campaign is designed to replace the city’s
            entire fleet of fossil-fuel peaker power plants with clean energy alternatives such as renewables and
            energy storage.

            One of the Coalition’s first actions was to release a groundbreaking report in May 2020 investigating
            the economic and environmental costs of New York City’s peaker plants, highlighting the harmful environ-
            mental health impacts of these plants in environmental justice communities. That report, Dirty Energy, Big
            Money, outlined how New York City’s peaker plants—some operating since the 1950s—have perpetuated
            decades of health disparities from long-term exposure to toxic air pollution in the South Bronx, Sunset
            Park, Brooklyn, Queens, and other in low-income communities of color where these plants are predomi-
            nantly located. The report noted the peakers’ nitrogen oxide (NOx) and particulate emissions, linked to

Joseph J. Seymour peaker power
plant in Sunset Park, Brooklyn.
Courtesy of UPROSE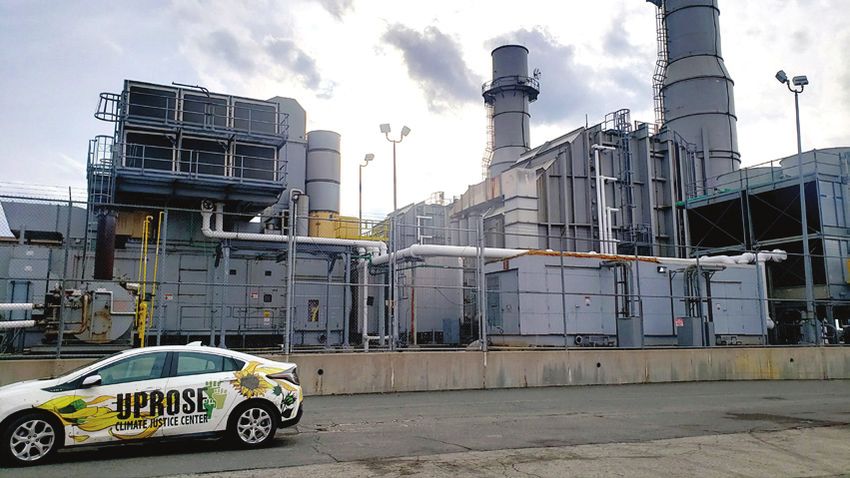
the fossil fuel end game • v • A PEAK Coalition Report

increased serious disease and higher mortality rates from COVID-19 exposure. The report also outlined
how between 2000 and 2019 the public and private owners of these old, inefficient, and polluting power
plants—which sit idle most of the year except when electricity demand is high—took in over $4.5 billion
in revenue through capacity payments.

The Dirty Energy, Big Money report called for commitments from New York City to move away from this
outdated, inequitable, and polluting energy system relying on peaker plants, and to embrace a clean energy
system powered by renewables and energy storage—creating a model for operationalizing New York State’s
landmark Climate Leadership and Community Protection Act (CLCPA) by investing in environmental justice
communities to enhance community resilience, promote equity, and create local clean energy jobs. In 2021,
the PEAK Coalition is laying out a detailed roadmap showing how peakers can be retired and replaced on
a timeline consistent with the energy commitments established in the CLCPA, and developing a plan to
realize the goal of a New York City free of dirty peaker plants.

The Fossil Fuel End Game, prepared by Strategen Consulting on behalf of the PEAK Coalition, is the first
detailed roadmap that sets forth a specific strategy and policies to retire and replace a city’s entire fleet
of fossil-fuel peaker plants—a feat that can be accomplished by 2030 in New York City.

The report accomplishes multiple goals:

First, it characterizes the New York City peaker fleet and digs deeper into the harmful environmental,
health, and economic injustices they cause:
    ●   Environmental justice communities in New York City bear an inequitable burden of pollution
        from fossil fuel power plants. Of power generated in downstate regions like New York City,
        69 percent comes from fossil-fuel burning power plants, relative to nine percent from upstate
        New York, based on estimates by the state system operator.
    ●   The city has 89 peaking units (individual turbines) spread across 19 power plants, with a com-
        bined capacity of 6,093 megawatts (MW). Many of these units are over 50 years old, already
        well past the normal age of retirement for most types of generators, and some still run on
        highly polluting fuel-oil or kerosene.
    ●   In 2019, 79 out of these 89 peaking units operated for less than 5 percent of the time (fewer
        than 500 hours) and 60 of them ran for less than 1 percent of the year (fewer than 100 hours).
    ●   Many of the peakers run for relatively short durations and could be replaced by energy storage
        at competitive costs. In 2018, over 50 percent of the peaking units in the portfolio ran no more
        than eight hours in duration each time they fired up; 28 units, totaling 765 MW of installed
        capacity, had maximum run durations of four hours or less.
    ●   Annually, peakers in New York City emit almost 2.7 million tons of carbon dioxide (CO2),
        constituting almost 5 percent of New York City’s 2019 CO2 emissions. Based on New York
        State Department of Environmental Conservation guidelines on the cost of carbon, the CO2
        emissions of the peaker fleet cost the world more than $300 million each year.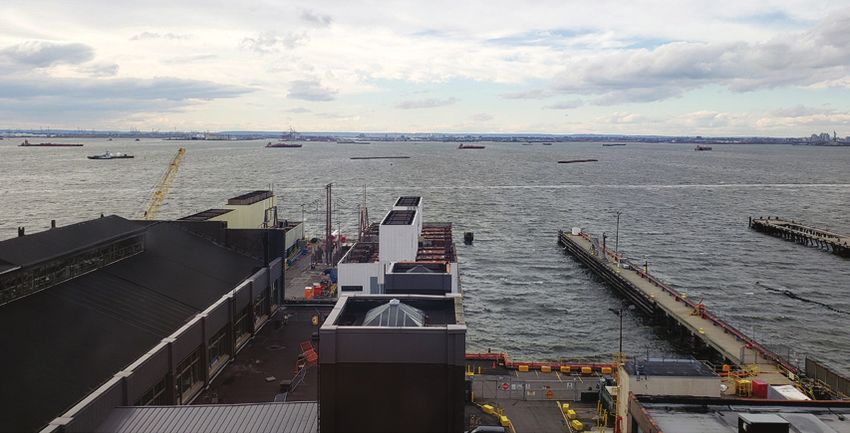
the fossil fuel end game • vi • A PEAK Coalition Report
● 750,000 people in New York City live within one mile of a peaker plant; 78 percent of these
people are either low-income or people of color.
● In New York State, peakers contribute as much as 94 percent of the state’s NOX emissions
on high-ozone days, despite providing as little as 36 percent of the gross energy load. These
disproportionately large emissions occur because many of the older peaker plants do not have
any form of NOX controls and are not compatible with emissions-reducing retrofits.
● Because of expensive capacity payments to peaker plant owners and inefficient equipment,
electricity from peaker plants in New York City is up to 1,300 percent more expensive than the
average cost of electricity in the rest of the state. The owners of these seldom-used power
plants received a staggering $4.5 billion in revenue to operate over the course of ten years—
money that the PEAK Coalition urges should be invested in renewable energy solutions and
green jobs in and near New York City, instead of mostly flowing to out-of-state entities.i
Next, this report lays out a comprehensive strategy to feasibly retire New York City’s entire fleet of fossil-
fuel peaker plants and replace them with renewables and energy storage by 2030, with an equity focus
to prioritize retirement of plants in environmental justice communities.
● In the first phase, by 2025, about 3.2 gigawatts (GW)—approximately half of existing peaker
plants—can be replaced with a combination of offshore wind, rooftop solar, energy efficiency
measures, and battery storage.
● In the second phase, by 2030, all remaining peaker plants in the city, approximately 2.9 GW,
can be replaced using a similar combination of resources.
i As noted in Dirty Energy, Big Money, the PEAK Coalition publicly and specifically asked the plant owners and public officials to correct any mistakes
that might have been made in the multi-billion-dollar capacity payments analysis. As of the date of publication of this report, no one has come
forward to correct or dispute the report’s findings, so they are reiterated here.
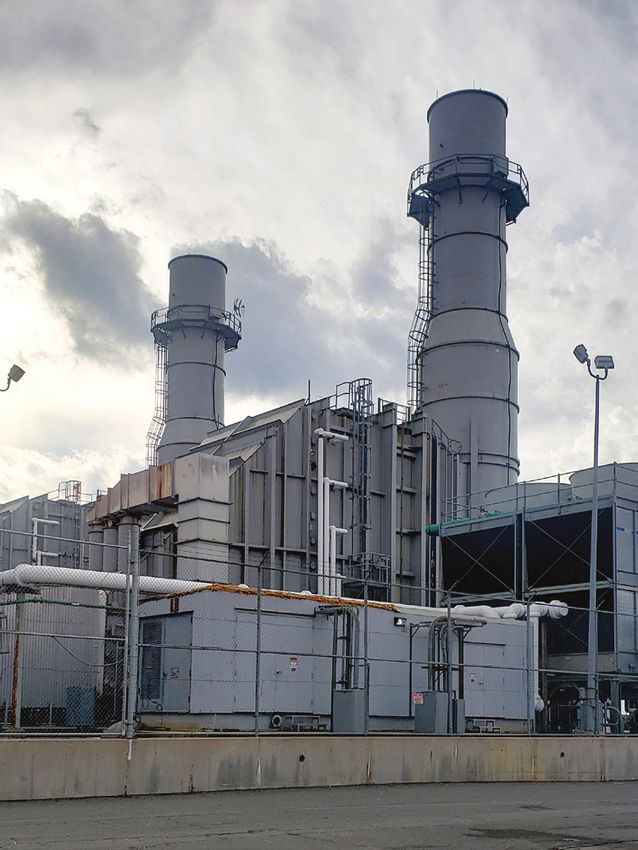
Narrows floating peaker power
plant in Sunset Park, Brooklyn.
Courtesy of UPROSE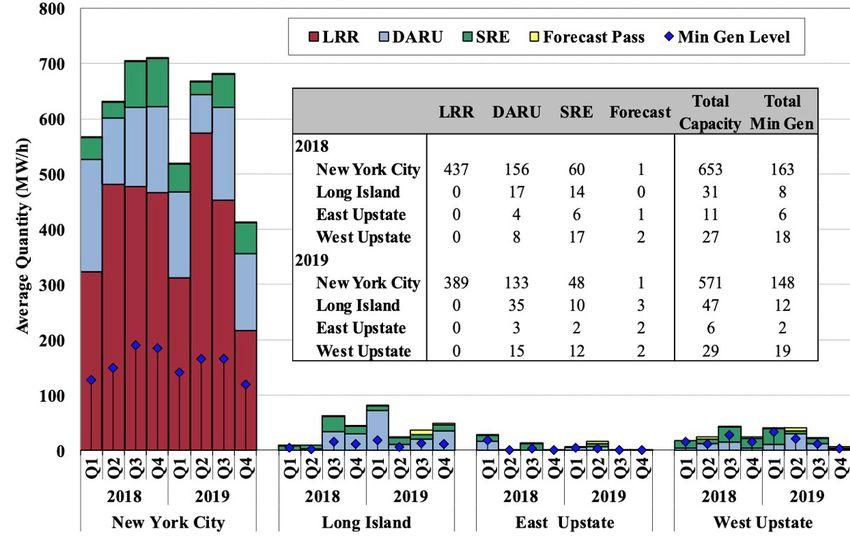
the fossil fuel end game • vii • A PEAK Coalition Report

    ●   The energy services provided by these plants can be replaced by these resources according
        to the following development schedule:
        –    2.8 GW of rooftop solar by 2025, growing to 5.6 GW by 2030
        –    1.5 GW of offshore wind by 2025, growing to 3 GW by 2030
        –    4,100 gigawatt-hours (GWh) of energy efficiency by 2025, growing to 5,400 GWh by 2030
        –    2.4 GW of 4-hour duration energy storage (or equivalent) by 2025, growing to 4.2 GW
             of 8-hour duration storage (or equivalent) by 2030
    ●   The majority of these resources are already required by the CLCPA, which establishes specific
        targets for clean energy development, including 6 GW of rooftop and community solar by 2025,
        3 GW of energy storage by 2030, and 9 GW of offshore wind by 2035.
    ●   The proposed retirement and replacement plan will save customers money, with the potential
        to save $1 billion in energy market costs by 2035.
    ●   Retirement of the city’s peaker plants would reduce annual emissions by 2.66 million tons
        of CO2, 1,655 tons of NOX, and 171 tons of SO2.
    ●   Reduced environmental and health impacts from avoided emissions would be projected
        to create additional savings of more than $1 billion by 2035.

Finally, the report recognizes that this accelerated clean energy transition, while technically feasible and
cost-effective, will require a new era of alignment, coordination, and shared commitment to a renewable
energy framework and policies by public agencies and regulators:
    ●   The New York Independent System Operator (NYISO), in coordination with the Federal Energy
        Regulatory Committee (FERC), must establish market rules and mechanisms that support the
        competitive and cost-effective deployment of energy storage and other clean resources.
    ●   The New York State Energy Research and Development Authority (NYSERDA) and other state
        government agencies must continue to advance clean energy solutions like offshore wind,
        energy storage, energy efficiency, distributed solar, and local and regional transmission and
        connectivity infrastructure, all of which must be focused on ensuring equitable deployment
        of these resources in New York City.

Local and state legislators will need to help advance innovative options to site and develop clean resources
(specifically rooftop solar and battery storage) within the city while reducing waste and energy demand
through efficiency measures. As solar technology has become far more cost-effective, New York City
installations have continued to lag, partly due to elevated installation costs and construction restrictions.
In fact, distributed solar in the city, supported by the state’s solar incentive program, accounts for only
6% of the total capacity installed in the state, while New York City accounts for one-third of the state’s
energy consumption.

To replace New York City’s peaker plants with clean energy solutions, local and state legislators must:
    ●   Fully implement the benchmarking, building retrofit, and distributed energy mandates of the
        Climate Mobilization Act (Local Law 97 of 2019), while rejecting recent attempts by the real
        estate industry to bypass these measures with renewable energy credits. Retrofits of public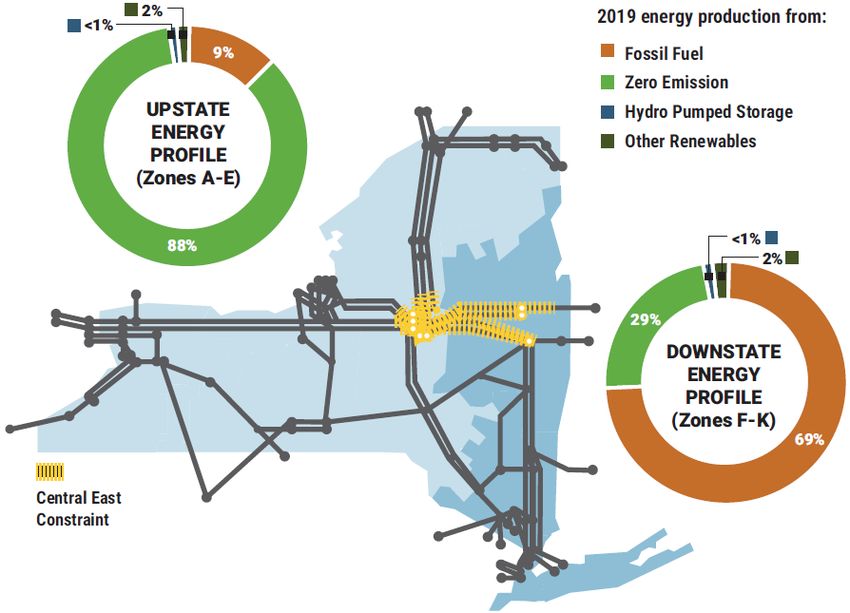
the fossil fuel end game • viii • A PEAK Coalition Report

         buildings (such as schools) in environmental justice communities, including those burdened
         by peaker plants, must be prioritized.
    ●    Advance and accelerate the installation of solar, battery storage, and other clean energy
         technologies at publicly owned buildings and land, including Rikers Island and public schools.
         Prioritize solar and battery installations on buildings such as K-12 schools in environmental
         justice communities.
    ●    Ensure that New York City receives an equitable share of state and federal renewables and
         energy efficiency funding through agencies such as NYSERDA in accordance with the CLCPA,
         with priority given to deploy efficiency measures and distributed energy resources in
         environmental justice communities.

The PEAK Coalition presents this report as a roadmap to end the long-standing toxic burden of peaker
power plants on the city’s most climate-vulnerable and pollution-impacted communities. This path prioritizes
investment in local communities and creation of local jobs and economic growth. The plan lays out a strategy
for New York City to take leadership in achieving the vital climate and equity goals enacted through the
CLCPA.

In 2020, NYC-EJA and its member organizations published the city’s climate agenda, calling for creating
community-based renewable energy programs, replacing peaker power plants, generating clean energy
jobs, and preparing more adequately for recurrent extreme weather events, among other climate justice
objectives. The agenda highlights that “achieving true climate justice requires more than drawing down
emissions and creating jobs—it also requires supporting the health and resilience of every community
in our city and honoring the rights of communities to articulate their own climate solutions.”

The Fossil Fuel End Game underscores specific clean energy strategies embraced by the PEAK Coalition
and its allies in this peaker replacement campaign. Replacement and retirement options, as confirmed
by the report, would require a full range of aggressive state and local strategies to accelerate adoption of
rooftop solar, energy efficiency, offshore wind, and energy storage technologies. While the PEAK Coalition
recognizes this is not a trivial undertaking, advances in clean energy technologies have created a path
forward to achieve this critical energy transition.

For too long, communities of color have borne the burden of power plant emissions to keep the lights
on for everyone else. With strong leadership from state and city government, in close partnership with
impacted communities, New York City can serve as a model to the state and the entire country through
its commitment to develop local renewable energy and battery storage systems, while investing in
the communities historically harmed by existing fossil fuel infrastructure.

The PEAK Coalition looks forward to the collaborations and innovations ahead to make this clean
energy vision a reality.
The Fossil Fuel End Game:
A Frontline Vision to Retire New York City's Peaker Plants by 2030

 Prepared for:                                                        Prepared by:

 THE PEAK COALITION
 Clean Energy Group                                                   Strategen Consulting, LLC
 New York City Environmental Justice Alliance
 New York Lawyers for the Public Interest                             2150 Allston Way, Suite 400
 THE POINT Community Development Corporation                          Berkeley, California 94704
 UPROSE                                                               www.strategen.com

                                                                      Erin Childs
                                                                      Eliasid Animas
                                                                      Darcy Jones
                                                                      Jennifer Gorman
                                                                      Austin Maciey

Disclaimers
Client Disclaimer
This report does not necessarily represent the views of PEAK Coalition member organizations or their
employees. PEAK Coalition, its member organizations and their employees, contractors, and subcontractors
make no warranty, express or implied, and assume no legal liability for the information in this report; nor does
any party represent that the uses of this information will not infringe upon privately owned rights. Reference
herein to any specific commercial product, process, or service by trade name, trademark, manufacturer, or
otherwise does not necessarily constitute or imply its endorsement, recommendation, or favoring by PEAK
Coalition member organizations. Stakeholders and subject-matter experts consulted during this study did not
necessarily review the final report before its publication. Their acknowledgment does not indicate
endorsement or agreement with the report’s content or conclusions.

Strategen Disclaimer
Strategen Consulting LLC developed this report based on information received by the PEAK Coalition. The
information and findings contained herein are provided as-is, without regard to the applicability of the
information and findings for a particular purpose. References herein to any specific commercial product,
process, or service by trade name, trademark, manufacturer, or otherwise does not necessarily constitute or
imply its endorsement, recommendation, or favoring by Strategen Consulting LLC.

© 2021 by Strategen
Table of Contents
Executive Summary ......................................................................................................................................... 3
1. Background .................................................................................................................................................... 7
1.1 Fossil Fuel Assets in NYC.................................................................................................................................... 7
1.1.1 The City’s Peaker Portfolio .......................................................................................................................... 8
1.1.2 Peaker Siting ................................................................................................................................................. 10
1.1.3 Direct Peaker Costs .................................................................................................................................... 10
1.2 Local Pollutants & Environmental Justice in NYC .................................................................................... 13
1.2.1 Peaker Emissions ......................................................................................................................................... 13
1.3 Clean Energy Policy in NYC ............................................................................................................................ 14
1.3.1 Climate Leadership and Community Protection Act......................................................................... 15
1.3.2 NOX Rule ........................................................................................................................................................ 19
2 . A V i s i o n f o r C l e a n E n e r gy i n N Y C . . . . . . . . . . . . . . . . . . . . . . . . . . . . . . . . . . . . . . . . . . . . . . . . . . . . . . . . . . . . . . . . . . . . . . . . . . . . . . . . . . . . . . . . . . . . . . . . . . . . . . . . . . 2 1
2.1 New York City Grid Planning Considerations ............................................................................................ 21
2.1.1 Electrical Topography ................................................................................................................................ 21
2.1.2 Challenges for Urban Resource Development................................................................................. 21
2.2 Role of Peakers ................................................................................................................................................. 22
2.3 A Clean Energy Vision for New York City................................................................................................. 24
2.3.1 Foundational Clean Energy Resources .............................................................................................. 24
2.3.2 A Roadmap for Peaker Retirement ..................................................................................................... 28
2.3.3 A Dynamic Path Forward ........................................................................................................................ 30
2.4 Cost & Benefits ................................................................................................................................................... 31
2.4.1 Storage Resource Cost-effectiveness ................................................................................................. 31
2.4.2 Reduced Pollutants .................................................................................................................................. 33
2.4.3 Non-quantified Benefits .......................................................................................................................... 34
3. How to Enable a Clean Energy Vision .................................................................................................. 36
3.1 Principles for a Transition ................................................................................................................................ 36
3.1.1 Prioritize Community and Stakeholder Engagement and Buy-in ................................................ 36
3.1.2 Leverage and Enable Market Participants and Developers ........................................................ 36
3.1.3 Provide Transparency and Accountability ......................................................................................... 37
3.2 Policy Recommendations ............................................................................................................................... 37
3.2.1 Wholesale Market Design ....................................................................................................................... 37
3.2.2 State Policy ................................................................................................................................................. 38
3.2.3 Local Community and City Policy ........................................................................................................ 39
Conclusion ................................. ...................................................................................................................... 40
© 2021 by Strategen 1Tables & Figures Table 1. Proposed Peaker Unit Retirements by 2025 and 2030 .................................................................... 3 Table 2. NYC Peaker Fleet Summary ...................................................................................................................... 8 Table 3. Capacity Costs of NYC's Peaker Fleet ................................................................................................... 11 Table 4. Annual Emissions of the Peaker Fleet in NYC .................................................................................... 14 Table 5. NOX rule compliance plans ..................................................................................................................... 20 Table 6. Summary of Replacement Resources ..................................................................................................29 Table 7. Proposed Peaker Unit Retirements by 2025 and 2030 .................................................................29 Table 8. Economic Impact of Peaker Plants in NYC ......................................................................................... 34 Figure 1. Retirement Trajectory of New York City Emitting Power Capacity ............................................... 4 Figure 2: Upstate and Downstate Energy Supply Profile .................................................................................. 5 Figure 3. Capacity Prices in NY Control Area and NYC...................................................................................... 7 Figure 4. NYC's Fossil Fuel Generation Portfolio ................................................................................................. 9 Figure 5. Peaker Sites by Capacity and Average Unit Age ............................................................................. 10 Figure 6. Supplemental Commitment for Reliability in NY by Category and Region 2018-2019......... 12 Figure 7. Offshore Leasing Areas and Contracts in NY .................................................................................... 16 Figure 8. Growth of Distributed Solar in New York ............................................................................................ 17 Figure 9. Historical Peaker Generation and Installed Capacity ..................................................................... 23 Figure 10. Peaker Starts and Run Duration........................................................................................................... 23 Figure 11. Projected Offshore Wind in New York City ....................................................................................... 24 Figure 12. Historical Distributed Solar Deployment ...........................................................................................25 Figure 13: Potential Rooftop Solar Additions in NYC.........................................................................................26 Figure 14. Energy Efficiency Adoption Scenarios in NYC ................................................................................26 Figure 15. Energy Storage Dispatch During System Peak, 2030 ................................................................. 27 Figure 16. Replacement Resources by 2025 and 2030 .................................................................................. 28 Figure 17. Costs and Benefits of Peaker Retirement .......................................................................................... 31 Figure 18. Net Cost Decline of 4- Battery Storage ............................................................................................. 32 Figure 19. Net Cost Decline of 8-hour Battery Storage .................................................................................... 32 Figure 20. Annual Costs from Peaker Replacement ........................................................................................ 33 © 2021 by Strategen 2
Executive Summary
This report describes a technically and economically feasible approach to replace New York City’s
peaker power plant fleet1 with locally sited renewables, customer-sited resources, and energy
storage over the next decade. As the majority of these plants are located in the South Bronx, Sunset
Park, and other under-resourced communities and environmental justice communities, this approach
has the potential to prioritize communities impacted by peakers, not only by ceasing the damage to
their immediate environment but also by creating new local job opportunities and building local
infrastructure for resiliency.
The analysis finds that a phased approach could be used to retire the city’s entire 6,093 megawatt
(MW) fleet of peaker power plants. About 3,230 MW – approximately half of existing peaker plants
– could be replaced by 2025 with a combination of offshore wind, rooftop solar2, energy efficiency,
and energy storage. This can be followed by the full retirement of all remaining peaker plants in the
city by 2030 using a similar combination of resources: 5.6 gigawatts (GW) of rooftop solar, 3 GW of
offshore wind, 5,400 GWh of energy efficiency, and 4,200 MW of 8-hour (or equivalent) energy
storage.
This report outlines how the following peaker plants in New York City would be replaced and retired
according to this schedule:

                    Table 1. Proposed Peaker Unit Retirements by 2025 and 2030
Units to retire by 2025               Capacity (MW)           Units to retire by 2030           Capacity (MW)
Arthur Kill (Unit 1)                              20          Arthur Kill ST (Units 2,3)                   912
Astoria Gen (GT Unit)                              16         Astoria ST (Units 3, 5)                     763
Astoria Gen. ST (Unit 2)                         180          East River ST (Unit 7)                      200
Astoria GT (All)                                 558          J.J. Seymour                                  94
Gowanus (All)                                    640          Kent                                          47
Harlem River (All)                                94          Pouch                                         47
Hell Gate (All)                                   94          Ravenswood ST (Units 1, 2)                  800
Hudson Ave (All)                                  33
Narrows (All)                                    352
Ravenswood (Units 1, 10, 11)                      69
Ravenswood ST (Unit 3)                         1,027
Vernon Blvd (All)                                 94
59th Street (All)                                  17
74th Street (All)                                 37
Total by 2025                            3,231 MW             2030 Total                            2,863 MW

The retirements outlined above represent an opportunity to close nearly 60% of the total existing
fossil assets operating in New York City, and bring the city’s electric resource portfolio on-trajectory

1
  Peaker power plants are turned on when energy demand rises above normal levels. Peaker plants are highly
polluting and tend to be sited in under-resourced and environmental justice communities like the South Bronx
and Sunset Park. For additional information on peaker plants and their impacts on New York City communities,
see: Peak Coalition, 2020. Dirty Energy, Big Money: How Private Companies Make Billions from Polluting
Fossil Fuel Peaker Plants in New York City’s Environmental Justice Communities—and How to Create a
Cleaner, More Just Alternative.
2
  This report focuses on rooftop solar to quantify the technical potential for solar in the city, but other solar
resources, such as distributed solar or community solar, could also contribute to local energy needs.

© 2021 by Strategen                                                                                            3
to achieve the community and climate goals laid out in the Climate Leadership and Community
Protection Act (CLCPA), and to transition away from fossil fueled resources by 2040. Figure 1 below
outlines how this retirement schedule will help New York City align with and achieve the goals
established in the CLCPA. This proposal further aligns with CLCPA stated goals to “prioritize
measures to maximize net reduction of greenhouse gas emissions and co-pollutants in
disadvantaged communities as identified pursuant to [the Climate Justice Working Group]"3; these
retirements would represent a reduction of 1,655 tons of NOX and 171 tons of SOX annually.
Figure 1. Retirement Trajectory of New York City Emitting Power Capacity
10,000
8,000
Capacity (MW)
6,000
4,000
2,000
0
2019 2025 2030 2035 2040
Peakers Other Emitting Assets CLCPA Target
Source: Strategen
Retiring these peaker plants and replacing them with renewable resources and energy storage
could bring benefits in the form of savings in the capacity market and avoided damages from
polluting emissions. This report shows the potential to save $1,005 million in the energy markets and
$1,166 million from avoided emissions by 2035 (net present value). Also as a point of comparison,
peaker plants received full capacity payments for about $422 million in 2019 and about $4.9 billion
during the last decade.4 These numbers can be compared to the $112 million in incentives for solar
projects located in NYC over the last 20 years; or the most recent $573 million expansion of the NY-
Sun Program for the State that includes $200 million focused on supporting projects benefitting low-
and moderate-income New Yorkers, affordable housing, and disadvantaged communities.
With the passage of the CLCPA, New York and over 200 community groups made a clear statement
about their commitment to action on the deeply intertwined issues of climate change and
environmental justice with strong emission reduction, renewable energy development, and equity
mandates.5 The CLCPA lays out both the impetus for action and specific targets and mechanisms
needed to achieve a clean and equitable future for the state and its residents. Throughout
the CLCPA, legislators make it explicitly clear that the State’s ability to achieve a healthy and thriving
future is deeply dependent on its ability to ensure access to clean energy and clean air for all
residents in the State, especially those living in historically disadvantaged communities that have
borne the brunt of fossil-fuel infrastructure and air pollution.
3
New York State Senate, 2019. Assembly Bill A8429.
4
Approximation based on historical capacity prices from NYISO’s strip, monthly and spot auctions in Zone J
(N.Y.C.) for summer and winter periods. Assumes 15% benefit on bilateral contracts from strip prices.
5
CLCPA was championed by NY Renews, a coalition of over 200 environmental, justice, faith, labor, and
community groups. The NY Renews coalition drafted the Climate and Community Protection Act (CCPA) to
mandate a transition to a just and renewable economy in New York state, which ultimately became the CLCPA.
© 2021 by Strategen 4Of power generated in downstate regions of New York, 69% is estimated to come from fossil fueled
resources, relative to 9% in upstate New York. These energy inequalities between regions are the
result of many factors, including differences in space availability and transmission constraints that
limit the supply of clean energy in the downstate regions. In New York City, these resource hurdles
are more severe and virtually all energy generated locally comes from fossil fuels. A vast majority of
these fossil fueled resources only run at a fraction of their total capability and during the energy
system peaks. Moreover, many of these old peaker plants were built in the 1950s to 1970s and
continue to run on heavily polluting fuels like fuel oil or kerosene.
Figure 2: Upstate and Downstate Energy Supply Profile
Source: NYISO, “The Vision for a Greener Grid”
For years, regulators, policymakers and other grid planning organizations faced resource
development challenges and reliability concerns that have prevented the replacement of these
highly polluting power plants with cleaner resources. That is no longer true. Energy resources such
as storage, solar, and wind, are now more accessible and cost-effective assets to meet grid needs
across the US. In places like California and Hawaii, solar and storage have already been used for
years to help alleviate transmission congestion and retire fossil fueled assets. A number of states,
including Colorado6, Arizona7 and New Mexico,8 have concluded that these clean resources
are actually a more cost-effective energy solution than fossil-fueled power, and are actively pursuing
retirement and replacement strategies. As new solutions come to the market to provide energy and
integrate renewables, a clean grid becomes even more feasible.
As New York joins this growing body of states committed to clean energy, it has the opportunity
to step forward into the spotlight and demonstrate not only the feasibility of clean resources, but
also the way in which these resources can help to transform urban power supply. The analysis
6
Clean Energy Group, 2018. Batteries Replacing Gas in California, Coal in Colorado and Indiana. & Strategen,
2019. Colorado Coal Plant Valuation Study. Prepared for Sierra Club.
7
Strategen, 2019. Arizona Coal Plant Valuation Study: Economic assessment of coal-burning power plants in
Arizona and potential replacement options. Prepared for Sierra Club.
8
Greentech Media, 2020. New Mexico’s plan to shut down coal without leaving people behind. News Article.
© 2021 by Strategen 5undertaken in this report demonstrates an approach for New York City to begin its transition to a
local and more equitable supply of energy that is 100% clean.
Achieving this clean energy vision will require action from policymakers and community leaders
across the state. New York’s Grid Operator (NYISO), in coordination with the Federal Energy
Regulatory Commission (FERC), must establish market rules and mechanisms that support the
competitive and cost-effective deployment of energy storage and other clean resources. The New
York State Energy Research and Development Authority (NYSERDA) and other state government
agencies must continue to advance clean energy solutions like offshore wind, energy storage,
energy efficiency and solar, and must further focus their efforts on ensuring equitable deployment
of these resources in New York City and its disadvantaged communities. Finally, city and local
leaders have a role to play in supporting new energy resource development in and around the city
as the difficulties of siting new resources is one foundational challenge that has allowed aging fossil
fueled resources to continue to operate to this day. Local leaders will be required to help advance
innovative options to site and develop clean resources that can facilitate this transition.
New York has taken the groundbreaking step of explicitly tying its clean energy goals with the need
to care for and protect the most vulnerable communities in the state. As state legislators, regulators,
and other policy actors begin to unpack the CLCPA to understand how to implement the
foundational vision described, it is imperative that the community protection directives outlined in
the CLCPA continue to guide and focus the implementation of New York’s clean energy vision. It is
not enough to implement state-wide clean energy policy; specific attention and care must be
dedicated to the issue of pollution in New York City. The communities of New York City deserve the
same treatment promised to all other New Yorkers: clean air and a 100% clean energy future.
Key Takeaways from this study :
• 6 GW of fossil fueled power plants in New York City can feasibly be retired and replaced by
2030; nearly 3.2 GW of this can be retired by 2025
• The energy services provided by these plants can be replaced with offshore wind, rooftop
solar, energy efficiency, and energy storage.
o 2.8 GW of rooftop solar will be required by 2025, growing to 5.6 GW by 2030
o 1.5 GW of offshore wind will be required by 2025, growing to 3 GW by 2030
o 4100 GWh of energy efficiency required by 2025, growing to 5400 GWh by 2030
o 2,420 MW of 4-hour storage (or equivalent) will be required by 2025, growing to
4,200 MW of 8-hour storage (or equivalent) by 2030
• Achieving these replacement targets could bring multiple benefits including reduced local
and global emissions, the creation of new green jobs in the city, energy resiliency and energy
market revenues.
o The proposed resource development has the potential to save customers $1 billion
(net present value) in capacity costs by 2035, primarily due to reduced costs of
peaker capacity payments and net costs to install storage.
o Additionally, reduced environmental and health impacts from avoided emissions
could create savings for about $1.17 billion (net present value) by 2035.
• Policymakers, grid operators, and local leaders will need to enable resource development
by:
o Establishing market mechanisms that allow for appropriate compensation of clean,
local resources.
o Continuing to timely advance planned clean energy solutions with a strategic focus
on achieving the State’s clean energy and community goals.
o Supporting and enabling the development of clean resources in the city itself.
© 2021 by Strategen 61. Background
This section lays out the background on the fossil fuel power plants and the relevant regulation that
was considered in this study. More specifically, this section describes and characterizes the fossil
fueled power plants currently operating in New York City, as well as the New York State and City
policy that will impact their operations going forward.
1.1 Fossil Fuel Assets in NYC
New York City is by far the most densely populated urban center in the country. It represents a third
of the State’s energy consumption, but local generation is severely limited by land availability and
power imports are restricted by a transmission bottleneck. These challenges have historically
prevented the City’s reliance on clean energy resources and raised the need for locally sited fossil-
fueled generators. Transmission constraints are so restrictive that while the upstate zones consume
about 90% clean energy, the downstate zones source two-thirds of their energy from fossil fuels. In
NYC the imbalance is even larger, in fact, nearly all of the energy generated in the city during 2019
came from fossil fueled power plants.9
These issues are also some of the reasons that the New York City transmission region has some of
the highest capacity prices in the country, nearly five times higher than the rest of the state during
summer season. Still, many of the city’s power plants are dedicated to addressing local system peaks
and only operate during a few hours per year. Nonetheless, New Yorkers pay the full economic and
health costs of keeping them in place.
Figure 3. Capacity Prices in NY Control Area and NYC10
$20 N.Y.C. Strip N.Y.C. Monthly N.Y.C. Spot
NY Control Area Strip NYCA Monthly NYCA Spot
$15
$10
$5
$-
May-15 Nov-15 May-16 Nov-16 May-17 Nov-17 May-18 Nov-18 May-19 Nov-19 May-20 Nov-20
Source: NYISO ICAP Market Report - December 2020
This is not a new problem and the environmental impacts of peaking power plants in low-income
neighborhoods and communities of color have long been tracked by clean energy and community
advocates. Although the need for peaking capacity remains, available technologies and recent
policy actions have opened a pathway for clean energy in those communities through the
replacement of NYC’s peaker portfolio.
9
NYISO, 2020. Gold Book: Load and Capacity Data.
10
The NYISO installed capacity market serves to maintain reliability of the power system by procuring sufficient
resource capability to meet expected maximum energy needs in the New York Control Area and its
transmission constrained areas, including N.Y.C. (zone J). The capacity market consists of three auctions that
stablish capacity prices for every zone. The Strip auction happens before the delivery period and allows load-
serving entities (LSE) to transact capacity for the following six-month period. The Monthly auctions are voluntary
and are held 15 days before the start of each procurement month. The Spot auctions are mandatory for all
LSEs and run 2-4 days before the start of every month.
© 2021 by Strategen 71.1.1 The City’s Peaker Portfolio
As of January 2021, NYC has a fossil fuel generation fleet of 10,650 MW, which includes both peakers
that run infrequently and other power plants that inject power more constantly into the grid.11 In this
report, peaker plants were defined as any fossil-fueled units with an annual generation equal or less
than 15% of its maximum installed capacity (i.e., with a capacity factor equal to or less than 15%) during
any of the last three years of operations. Based on this definition, NYC has 89 peaking units spread
across 19 plants with a combined capacity of 6,093 MW. These peakers include gas turbines12 and
steam turbines (ST)13, two power generating technologies with different technical capabilities and
operational constraints. Table 2 shows the full list of plants, their age, capacity, and owner.
Table 2. NYC Peaker Fleet Summary
Owner Plant Nameplate Capacity Units Average Age
Astoria 16 1 53
Gowanus 640 32 49
Astoria Generating Co.
Narrows 352 16 48
Astoria ST 943 3 62
59 St. 17 1 51
74 St. 37 2 52
ConEd
East River ST 200 1 65
Hudson Ave 33 2 50
Arthur Kill 20 1 50
NRG Power Arthur Kill ST 912 2 56
Astoria Gas Turbines 558 12 50
Harlem River 94 2 19
Hell Gate 94 2 19
J.J. Seymour 94 2 19
NYPA
Kent 47 1 19
Pouch 47 1 19
Vernon Blvd 94 2 19
Ravenswood 69 3 51
LS Power
Ravenswood ST 1,827 3 56
Grand Total 6,093 89 47
Source: Strategen with data from NYISO’s Gold Book 2020
11
The New York City fossil fueled generation fleet considered in this report focuses exclusively on plants in
NYISO Zone J, which includes most of New York City. However, two power plants located in the Rockaway
Peninsula, Jamaica Bay (54 MW) and Bayswater (58 MW), are located in NYC territory (Queens) but are
electrically connected to Long Island (Zone K) and are not included in this analysis. For more info on
replacement options for these plants and Long Island fossil fuel generators more broadly, see Strategen,
2020. Long Island Fossil Peaker Replacement Study.
12
Gas Turbines are a type of internal combustion engine where gas combustion is directly used to spin turbines
and generate electricity. These are commonly used as peakers due to its relative system simplicity and space
requirements, as well as for their quick starting and ramp-up times. However, the efficiency of this plants
significantly decreases when they are not used at full capacity. These are typically composed of small units.
13
Steam Turbines are a type of external combustion engine where thermal energy (in this case from oil or gas
combustion) is used to heat water to produce high pressure steam that is then used to spin turbines and
generate electricity. Steam turbines are typically bigger and have a higher thermal efficiency than gas turbines
but are less flexible, meaning that they need longer time to get started or turned-off, and to modify their power
output. These operational constraints lead to longer run durations and a less efficient peaker dispatch.
© 2021 by Strategen 8Many of these units are over 50 years old, already past the normal age of retirement for most types
of generators14, and some still run on fuel-oil or kerosene. Other newer and more efficient peaker
plants with low capacity factors were also considered to assess the opportunity of replacing them
with clean energy assets. Figure 4 below shows the age and capacity factor of the portfolio of fossil
fuel assets in New York City. This analysis targets some of the oldest plants with the lowest capacity
factors.
Figure 4. NYC's Fossil Fuel Generation Portfolio
Target Peakers Other Fossil Fuel Assets
90%
70%
Capacity Factor
50%
30%
10%
-10%
0 10 20 30 Age 40 50 60 70
Source: Strategen
In 2019, 79 out of the 89 peaker units were online for less than 5% of the time and 60 of them for
less than 1% of the year. That same year, 55 units had maximum dispatch durations of 8 hours or
less. While the older and less used peakers units are a likely target for replacement with stand-alone
storage, the rest of the portfolio can be assessed for replacement by considering a combination of
storage, renewables and energy efficiency. As discussed later in this report, these levels of resource
deployment align with existing State policy targets for clean resources such as offshore wind, energy
efficiency and distributed solar.
Of the fossil fueled resources in this portfolio, some are already considered for retirement,
repowering15 or replacement. For example, NYPA has recently announced their intention to
“[eliminate] emissions from its natural gas fleet, including small peaking plants in New York City, by
2035”.16 Other owners, like LS Power, are actively converting their existing fleet to battery storage
resources.17
14
S&P Global, 2019. Average age of US power plant fleet flat for 4th-straight year in 2018. Accessed Nov.
2020. https://www.spglobal.com/marketintelligence/en/news-insights/trending/gfjqeFt8GTPYNK4WX57z9g2
15
Astoria Generation Company (AGC) has proposed the 610 MW repowering of its Gowanus power plant. Many
community and environmental advocates in NY and the City are opposed to the project. Along with the
repowering of Gowanus, AGC proposed to retire the Narrows power plant. NRG Power is also proposing to
repower its Astoria Gas Turbines power plant. The project was presented in 2020 and could lead to the 437
MW repowering of the peaker.
16
NYPA, press release. NYPA Approves New Strategic Plan to Provide Clean Energy Roadmap for Next
Decade. (Dec 9, 2020).
17
LS Power. LS Power Advances NY State’s Renewable Energy Goals with Ravenswood Battery Energy
Storage Project. Accessed Nov. 2020. https://www.lspower.com/ls-power-advances-ny-states-renewable-
energy-goals-with-ravenswood-battery-energy-storage-project-2/
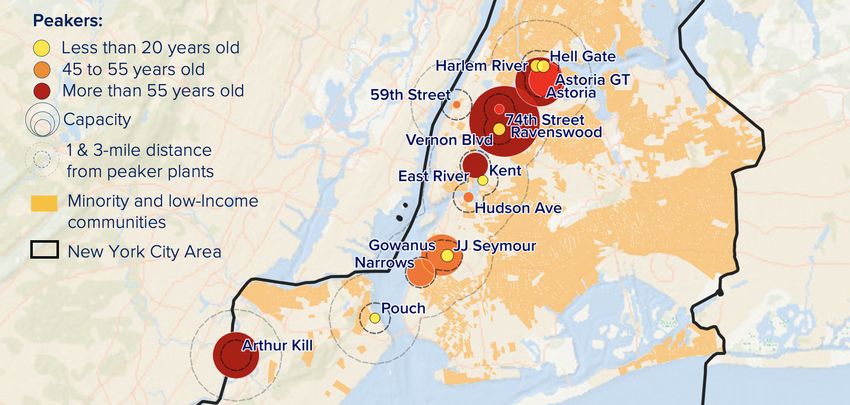
© 2021 by Strategen 91.1.2 Peaker Siting
The location of the peaker fleet is important from a grid planning perspective. Just as NYC is a load
zone restricted by transmission constraints, there are load pockets within the city formed by
transmission and distribution limitations. This issue raises the need for local generation in specific
areas within the city and is taken in consideration, at a high level, in this report. However, the study
does not intend to fulfill the need for a detailed reliability study in light of the proposed new resource
mix recommendations.
Figure 5. Peaker Sites by Capacity and Average Unit Age
Source: Strategen with US Census and EPA data
Due to the mentioned constraints on the system during peak times, these plants are often located
close to the communities they serve. In an urban settlement like NYC, this means that peaker plants
are very likely to be located in disadvantaged communities, where urban land is cheaper, exposing
their residents to a variety of pollutants such as CO2, NOX, SO2, and PM 2.5. The peaking capacity of
the city illustrated in Figure 5. Peaker Sites by Capacity and Average Unit Age, is concentrated in
the port and industrial areas within Bronx, Queens and Brooklyn that are closer to Manhattan, the
city’s administrative and economic center. A recent report by Elementa18 studies this issue with a
focus on local subareas, showing how these power plants are not only used to fulfill local needs, but
to feed energy into other constrained load pockets where energy demand outsizes generation
capacity. The Elementa report also offers some suggestions of how distributed energy resources
(DERs) could be used to meet local subarea reliability needs.
1.1.3 Direct Peaker Costs
Electricity from peaker plants is the most expensive energy resource in the system as it comes from
centrally-located assets that are used infrequently but must be paid for and maintained to allow
availability at times of peak demand. Central location, low utilization and the need for technologies
that provide flexibility drive the costs of generation way above those from other energy assets. For
this reason, peaker owners charge for the electricity they produce, and more importantly, also
charge for the availability of their resources during system peaks. Such availability is paid through
18
Elementa Engineering, 2020. Replacing Peaker Plants: DER strategies for Sunset Park, Gowanus and Bay
Ridge.
© 2021 by Strategen 10the capacity market, designed to ensure that the system has enough capacity to provide energy
during the times of highest energy demand. While NYC is not the only region with a capacity market,
it has some of the highest capacity prices in the country. When capacity costs are averaged over
the hours of operation, peaker electricity in New York City is up to 1,300% more expensive than the
average cost of electricity in the rest of the state.19
In 2019, the peaker portfolio in NY had an average capacity factor of 5.2%, or about 450 hours of
operation during the year, with some units running as low as 0.01% of the time. Nonetheless, peaker
plants received full capacity payments for about $422 million that year and about $4.9 billion during
the last decade.20
Table 3. Capacity Costs of NYC's Peaker Fleet
Capacity 2017 2018 2019 2010-2019
Owner Plant
(MW) ($ Million) ($ Million) ($ Million) ($ Million)
Astoria 16 1.1 1.0 1.1 13.4
Astoria Gowanus 640 41.8 39.4 43.8 521.0
Generating
Co. Narrows 352 21.6 20.4 22.7 269.9
Astoria ST 943 64.5 60.8 69.8 796.3
59 St. 17 1.2 1.1 1.2 14.6
74 St. 37 2.6 2.4 2.7 31.8
ConEd
East River ST 200 13.0 12.2 14.1 160.1
Hudson Ave 33 1.1 1.0 1.1 13.7
Arthur Kill 20 0.9 0.8 0.9 11.1
NRG Power Arthur Kill ST 912 60.4 56.9 65.3 746.4
Astoria Gas Turbines 558 31.3 29.5 32.9 389.5
Harlem River 94 5.6 5.3 6.1 69.1
Hell Gate 94 5.6 5.3 6.1 69.1
J.J. Seymour 94 5.6 5.3 6.1 69.1
NYPA
Kent 47 3.2 3.0 3.5 39.6
Pouch 47 3.2 3.0 3.4 39.3
Vernon Blvd 94 5.6 5.3 6.0 68.9
Ravenswood 69 3.1 3.0 3.3 39.2
LS Power
Ravenswood ST 1,827 121.4 114.4 131.4 1,499.6
Total 6,093 393 370 422 4,862
Source: Strategen with data from NYISO’s Gold Book 2020
Another factor that makes peaker energy more expensive than average is operational inefficiency
caused by technological limitations and distribution constraints. For example, there are costs
associated with turning on and off certain generating assets that lead plant managers to run them at
19
The PEAK Coalition, 2020. Dirty Energy, Big Money: How private companies make billions from polluting
fossil fuel peaker power plants in New York City’s environmental justice communities – and how to create a
cleaner, more just alternative.
20
Approximation based on historical capacity prices from NYISO’s strip, monthly and spot auctions in Zone J
(N.Y.C.) for summer and winter periods. Assumes 15% benefit on bilateral contracts from strip prices.
© 2021 by Strategen 11uneconomic times, driving up consumer costs and increasing local emissions. From a market
perspective, peakers are also called to run uneconomically to ensure local reliability. According to
the state’s Market Monitor, Potomac Economics, supplemental commitment21 of NYC’s peakers
occurs frequently to increase the amount of supply available in real-time for local load pocket
reliability (i.e., to meet N-1-1 requirements).22 This supplemental commitment tends to undermine
market incentives for efficiently meeting reliability requirements and often uplifts market prices,
which are eventually passed on to customers.23 Some of these costs could be alleviated through
market reforms or through deployment of modern inverter-based resources like locally-sited battery
storage which could provide valuable operating reserves in these load pockets. Figure 6 below, by
the market monitor, shows the quantities of reliability commitment in the State. In 2019, NYC
accounted for 87 percent of the State’s total reliability commitment.
This report by the market monitor shows how the limitations of fossil fuel power plants and the design
of the market today create inefficiencies that create addition revenues for peakers, which are all
ultimately borne by NYC electric customers.
Figure 6. Supplemental Commitment for Reliability in NY by Category and Region 2018-2019
Source: Potomac, 2020
21
Supplemental commitment occurs when a unit is not committed economically in the day-ahead market but
is needed for reliability. It primarily occurs through: (a) Day-Ahead Reliability Units (“DARU”) commitment
occurs at the request of transmission owners for local reliability; (b) Day-Ahead Local Reliability Rule (“LRR”)
commitment that takes place during the economic commitment within the day-ahead market; and (c)
Supplemental Resource Evaluation (“SRE”) commitment that occurs after the day-ahead market closes.
22
N-1-1 requirements ensure that there are enough resources to meet load in case of a N-1-1 scenario. Most
local N-1-1 scenarios are driven by the potential loss of the two largest Bulk Power System elements supporting
a particular load pocket, for example, the loss of multiple central generators due to contingencies in the natural
gas system.
23
Potomac Economics, 2020. 2019 State of The Market Report for the New York ISO Markets.
© 2021 by Strategen 121.2 Local Pollutants & Environmental Justice in NYC In New York City, there are 750,000 people living within one mile from a peaker plant and 78% of them are either low-income people or people of color. In fact, communities composed of these demographic groups are disproportionately impacted by peakers. Of the people living within one mile of a peaker plant, 280,000 (37%) live in communities that are predominantly occupied by these historically disadvantaged demographic groups.24 Figure 5 illustrates peaker location in relation to communities of color and low-income communities. Many of the emissions that come from peakers are local pollutants, meaning that they will stay close to their geographic point of origin, and their impacts will be felt most acutely by the surrounding communities.25 This implies that the peaker emissions, detailed above, most significantly impact New York City residents who live closer to these peaking plants. Although a one-mile radius is used here to illustrate the scale of the issue, the impacts of peaker emissions vary depending on peaker size and utilization, as well as diverse environmental factors like wind speed and temperature. A recent report by PSE Healthy Energy uses a three-mile radius to quantify the impacts of peaker plants.26 1.2.1 Peaker Emissions The emissions produced by peakers have an adverse impact on New York’s air quality and the health of community members. Moreover, these emissions make it almost impossible for the State to achieve compliance with National Ambient Air Quality Standards (NAAQS). In New York, peakers contribute as much as 94% percent of the State’s NOX emissions on high ozone days despite providing as little as 36% of the gross load.27 These disproportionately large emissions occur because many of the older peaker plants do not have any form of NOX controls and are not compatible with retrofits. Peaker plants are also more likely to operate during hot summer days when ozone levels are high and air quality is already poor, exacerbating the impact of their harmful emissions. The most common air pollutants emitted from peaker plants are nitrogen oxides (NOX), sulfur dioxide (SO2) and carbon dioxide (CO2).28, 29 NOX is a component of ozone formation. Ozone is a principal component of smog and can result in respiratory health problems and other negative health and environmental impacts.30 SO2 can harm the human respiratory system and make breathing difficult, especially for people with asthma, children particularly. SO2 is also a precursor of small particulate matter (PM2.5 or PM10). PM2.5 includes dust and smaller particles with a maximum particle diameter of 2.5 microns. These small 24 Calculations based on US Census data at the census tract level. Communities predominately formed by people of color or low-income people refers to tracts where these groups represent 60% or more of the total population. 25 Clean Energy Group, 2016. Energy Storage for Public Health: A Smarter Way to Deploy Resources. Accessed Oct. 2020. https://www.cleanegroup.org/energy-storage-public-health-smarter-way-deploy- resources/ 26 Physicians, Scientists, and Engineers for Healthy Energy, 2020. Energy Storage Peaker Plant Replacement Project. 27 NYSDEC. Adopted Subpart 227-3 Revised Regulatory Impact Statement. Accessed Oct. 2020. https://www.dec.ny.gov/regulations/116175.html 28 US Environmental Protection Agency (EPA). Particulate Matter Emissions. Accessed Oct. 2020. https://cfpub.epa.gov/roe/indicator.cfm?i=19 29 Oak Ridge National Laboratory, 2017. Environmental Quality and the U.S. Power Sector: Air Quality, Land Use and Environmental Justice. Prepared for the US Department of Energy. 30 US EPA. Ground-Level Ozone Basics. Accessed Oct. 2020. https://www. epa.gov/ground-level-ozone- pollution/ground-level-ozone-basics © 2021 by Strategen 13
You can also read