The GEWEX Water Vapor Assessment archive of water vapour products from satellite observations and reanalyses
←
→
Page content transcription
If your browser does not render page correctly, please read the page content below
Earth Syst. Sci. Data, 10, 1093–1117, 2018
https://doi.org/10.5194/essd-10-1093-2018
© Author(s) 2018. This work is distributed under
the Creative Commons Attribution 4.0 License.

         The GEWEX Water Vapor Assessment archive of water
              vapour products from satellite observations
                           and reanalyses
           Marc Schröder1 , Maarit Lockhoff1 , Frank Fell2 , John Forsythe3 , Tim Trent4,5 , Ralf Bennartz6,7 ,
              Eva Borbas7 , Michael G. Bosilovich8 , Elisa Castelli9 , Hans Hersbach10 , Misako Kachi11 ,
            Shinya Kobayashi12 , E. Robert Kursinski13 , Diego Loyola14 , Carl Mears15 , Rene Preusker16 ,
                                    William B. Rossow17 , and Suranjana Saha18
                1 Satellite-Based      Climate Monitoring, Deutscher Wetterdienst, 63067 Offenbach, Germany
                                                   2 Informus GmbH, Berlin, Germany
          3 Cooperative Institute for Research in the Atmosphere, Colorado State University, Fort Collins CO, USA
                   4 Earth Observation Science, Department of Physics and Astronomy, University of Leicester,

                                               University Road, Leicester, LE1 7RH, UK
           5 National Centre for Earth Observation, Department of Physics and Astronomy, University of Leicester,

                                               University Road, Leicester, LE1 7RH, UK
                     6 Earth & Environmental Sciences Department, Vanderbilt University, Nashville TN, USA
              7 Cooperative Institute for Meteorological Satellite Studies, Space Science and Engineering Center,

                                                University of Wisconsin – Madison, USA
                8 Global Modelling and Assimilation Office, Goddard Space Flight Center, National Aeronautics

                                            and Space Administration, Greenbelt MD, USA
              9 Institute of Atmospheric Sciences and Climate, National Research Council of Italy, Bologna, Italy
                              10 European Centre for Medium-Range Weather Forecasts, Reading, UK
                   11 Earth Observation Research Center, Japan Aerospace Exploration Agency, Tsukuba, Japan
                                             12 Japan Meteorological Agency, Tokyo, Japan
                                         13 Space Sciences and Engineering, Golden CO, USA
                14 Remote Sensing Technology Institute, German Aerospace Center, Oberpfaffenhofen, Germany
                                           15 Remote Sensing Systems, Santa Rosa CA, USA
                             16 Institute for Space Sciences, Free University of Berlin, Berlin, Germany
        17 CUNY Remote Sensing Science and Technology Institute, City College of New York, New York NY, USA
                    18 Environmental Modeling Center, NCEP/NWS/NOAA, NCWCP, College Park MD, USA

                              Correspondence: Marc Schröder (marc.schroeder@dwd.de)

                              Received: 14 November 2017 – Discussion started: 15 January 2018
                            Revised: 25 May 2018 – Accepted: 1 June 2018 – Published: 15 June 2018

      Abstract. The Global Energy and Water cycle Exchanges (GEWEX) Data and Assessments Panel (GDAP)
      initiated the GEWEX Water Vapor Assessment (G-VAP), which has the main objectives to quantify the current
      state of the art in water vapour products being constructed for climate applications and to support the selection
      process of suitable water vapour products by GDAP for its production of globally consistent water and energy
      cycle products. During the construction of the G-VAP data archive, freely available and mature satellite and
      reanalysis data records with a minimum temporal coverage of 10 years were considered. The archive contains
      total column water vapour (TCWV) as well as specific humidity and temperature at four pressure levels (1000,
      700, 500, 300 hPa) from 22 different data records. All data records were remapped to a regular longitude–
      latitude grid of 2◦ × 2◦ . The archive consists of four different folders: 22 TCWV data records covering the
      period 2003–2008, 11 TCWV data records covering the period 1988–2008, as well as 7 specific humidity and

Published by Copernicus Publications.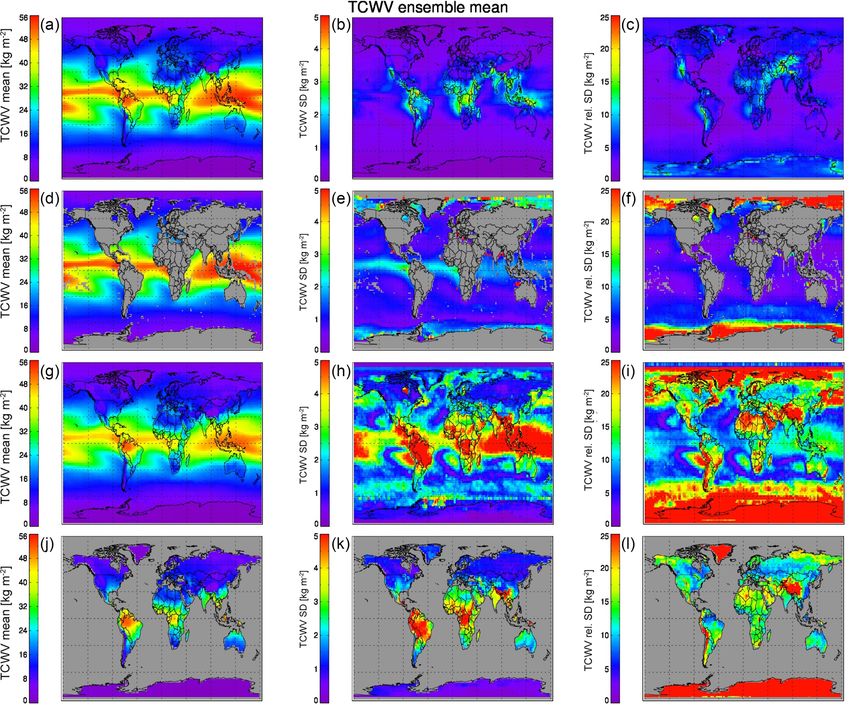
1094 M. Schröder et al.: The GEWEX Water Vapor Assessment data archive
7 temperature data records covering the period 1988–2009. The G-VAP data archive is referenced under the
following digital object identifier (doi): https://doi.org/10.5676/EUM_SAF_CM/GVAP/V001. Within G-VAP,
the characterization of water vapour products is, among other ways, achieved through intercomparisons of the
considered data records, as a whole and grouped into three classes of predominant retrieval condition: clear-sky,
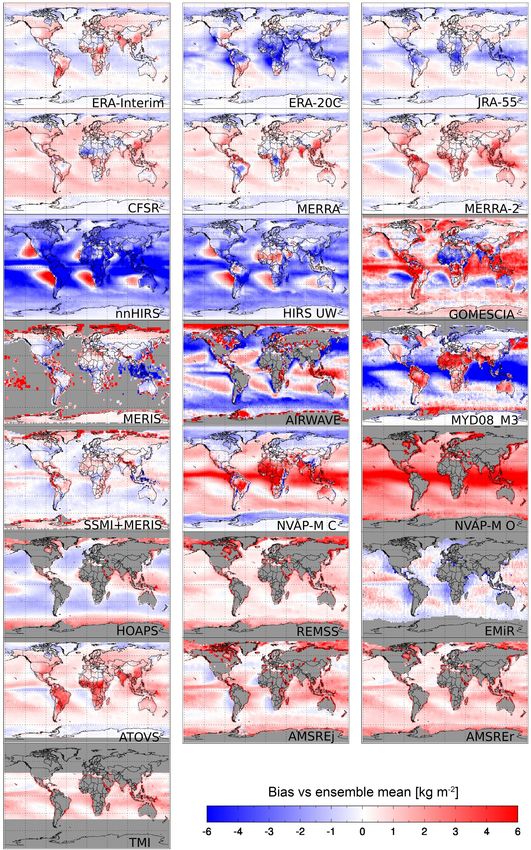
cloudy-sky and all-sky. Associated results are shown using the 22 TCWV data records. The standard deviations
among the 22 TCWV data records have been analysed and exhibit distinct maxima over central Africa and the
tropical warm pool (in absolute terms) as well as over the poles and mountain regions (in relative terms). The
variability in TCWV within each class can be large and prohibits conclusions about systematic differences in
TCWV between the classes.
1 Introduction for satellite, reanalyses, in situ and ground-based data records
are provided at http://gewex-vap.org/?page_id=13 (last ac-
cess: 12 June 2018). Satellite and reanalyses products with a
Water vapour is the most important natural greenhouse gas
minimum length of 10 years are basic elements of the G-
and the dominant source of infrared opacity in the clear-
VAP data archive. This archive forms the basis for scien-
sky atmosphere (Trenberth et al., 2007). In addition, fast act-
tific analysis in the characterization effort of satellite and
ing water vapour feedbacks constitute a strong amplification
reanalysis data records and results from such analysis have
mechanism for anthropogenic climate change (e.g. Held and
already been published (Schröder et al., 2016, 2017a). The
Soden, 2000), thus also making water vapour a key parame-
G-VAP data archive complements the archive produced by
ter for the energy budget of the Earth and consequently also
the Global Energy and Water cycle Exchanges (GEWEX)
for climate change analysis. Furthermore, the interactions of
Cloud Assessment (Stubenrauch et al., 2012). The Cloud As-
water vapour with other components of the climate system
sessment data archive contains multi-decadal information on
such as clouds and precipitation are still not fully understood.
a large number of cloud properties from multiple platforms
Analysing recent decades of global water vapour distribution
and is available from http://climserv.ipsl.polytechnique.fr/
and variability is expected to help extend our understanding
gewexca/index-2.html (last access: 12 June 2018).
of how the climate system responds to increasing greenhouse
In Sect. 2, an overview of previous and currently available
gas concentrations. Due to global coverage and observing pe-
satellite sensors together with a brief outlook on upcoming
riods approaching 40 years, satellite-based water vapour data
missions relevant for the retrieval of water vapour is pre-
records are adequate sources of information to address the
sented. The focus of Sect. 3 is a summary of existing satellite
above-mentioned challenges and to analyse the Earth’s cli-
and reanalysis data records. The G-VAP data archive is intro-
mate.
duced in Sect. 4, which is based on a subset of data records
To date, a large variety of satellite-based water vapour
introduced in Sect. 3. Section 4 starts with a brief introduc-
data records are available. Information on such records is
tion of all data records included in the archive. Then, the
provided by the ECV (see Table A1 in the Appendix for
processing of the data records and the archive structure are
a list of abbreviations) inventory (http://climatemonitoring.
explained. The following section includes exemplary results
info/ecvinventory, last access: 12 June 2018), the Climate
from the intercomparison of the data records from the G-VAP
Data Guide (https://climatedataguide.ucar.edu/, last access:
data archive. Here, TCWV data records with temporal cover-
12 June 2018), and the Advancing Reanalysis web portal
age from 2003 to 2008 are considered so that all data records
at http://reanalyses.org/ (last access: 12 June 2018). With-
of the archive are included in the intercomparison. Conclu-
out proper background information and understanding of the
sions are given in Sect. 7, and Appendix A provides a list of
limitations of available data records, these data may be uti-
all abbreviations used.
lized incorrectly or misinterpreted. The need for quality as-
sessments of ECV CDRs is part of the GCOS guidelines for
the generation of data products. Assessments in general pro- 2 Overview of available satellite sensors
vide an overview of available data records and enable users
to judge the quality and fitness for purpose of CDRs by in- In this section, background information on the wide variety
forming them about the strengths and weaknesses of existing of sensors that measure atmospheric water vapour is pro-
and readily available records. With this in mind, GDAP ini- vided. Only sensors that have a greater than 10-year record
tiated G-VAP whose major purpose is to quantify the current and that cover (near) global scales are discussed. These are
state of the art in water vapour products being constructed the types of sensors used to create global CDRs of water
for climate applications and to support the selection process vapour.
by GDAP. Within G-VAP, efforts started with an inventory of Generally water vapour sensors are deployed on low-Earth
freely available water vapour data records. Overview tables orbiting and geostationary satellites. Sensors that provide
Earth Syst. Sci. Data, 10, 1093–1117, 2018 www.earth-syst-sci-data.net/10/1093/2018/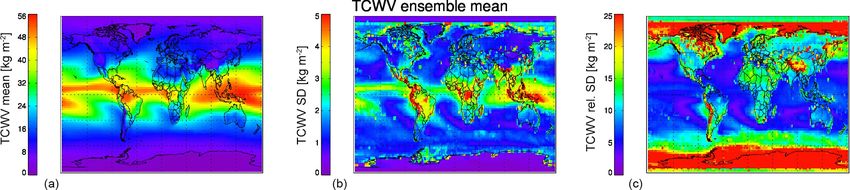
M. Schröder et al.: The GEWEX Water Vapor Assessment data archive                                                          1095

(near) global coverage typically operate on polar orbiting        mission of the sensor, e.g. SSM/I, its successor SSMIS or
platforms in a Sun-synchronous orbit. Such sensors provide        AMSU. Regardless of the classification of the sensor, both
global coverage with one day-time (at a particular local time)    imagers and sounders allow water vapour retrievals in clear
and one night-time overpass (12 h later). Instruments clas-       and cloudy skies, but not in the presence of strong scattering
sified as sounders carry several channels distributed about       by hydrometeors like during heavy precipitation events.
a water vapour absorption line to retrieve the vertical pro-         The passive microwave radiance record, from both im-
file of water vapour. Instruments classified as imagers might     agers and sounders with either a conical or cross-track scan
also have channels clustered about an absorption line, but        pattern and a few non-scanning, nadir-looking instruments,
the primary purpose of an imager is to sense the surface or       has exhibited good overlap and continuity since the late
cloud tops. Imagers are generally restricted to only retrieving   1980s and early 1990s to the present. The primary spectral
TCWV.                                                             bands represented in the CDRs are radiances at 19, 22, 37,
   The term “profile” usually implies the water vapour            50–60, 85–90, and 183 GHz. This record will continue with
amount (mixing ratio) on a given set of pressure levels, such     future sensors such as the Microwave Imager and Microwave
as those measured by radiosondes. Satellite sounding instru-      Sounder instruments on EPS-SG, which is planned to mea-
ments respond to radiation from a great depth of the atmo-        sure until ∼ 2040. Intercalibration efforts among the sensors
sphere as depicted by the instrument weighting function, so       (e.g. Sapiano et al., 2013; Fennig et al., 2017) yield funda-
the retrieval of atmospheric layers is the natural unit here.     mental CDRs that can be used to remove time-dependent
These layers might be interpolated to pressure levels to com-     changes in the radiance record. Intercalibration efforts for
pare with, for instance, a radiosonde or a model, but users       the 183 GHz radiance record continue to move forward (e.g.
should remain aware of the broad vertical layer over which        John et al., 2012; Chung et al., 2013).
satellite sounders nominally average.                                Conical scanning microwave imagers are typically config-
   This section approaches the overview of sensors from the       ured at an Earth incidence angle of about 53◦ . They have the
standpoint of where and what they sample, and the pros and        advantage of constant spatial resolution across the scan, and
cons of each sensor from a user perspective. Chronological        constant sensitivity to the atmosphere via the same geomet-
listings are readily available, for instance in Kämpfer (2012;    ric path length. Microwave surface emissivity over land and
Fig. 9.1). A recent overview of sensors is also provided by       ocean is a function of incidence angle, so in principle conical
Wulfmeyer et al. (2015). The information provided here is a       scanners eliminate this variable from atmospheric retrievals.
snapshot in 2017, but radiance records and sensor intercal-       Cross-track scanners have changing spatial resolution which
ibration continue to progress, and algorithm improvements         is highest at near-nadir views and grows into larger fields-
can expand the yield and performance of remote retrievals         of-view at the outer edge of the scan. They have a minimal
of water vapour. This list is not meant to be exhaustive,         atmospheric path length at nadir.
but serves to orient the user to the major sensors support-          1987 saw the launch of the first SSM/I instrument, a sen-
ing the water vapour CDR and their pros and cons. Sensors         sor that, while having no official climate mission, has had a
based on limb sounding techniques that focus on the upper         profound impact on global water vapour records. The water
atmosphere are not considered in this report. Information on      vapour absorption line at 22 GHz is a key component of these
these techniques and associated data records can be found at      TCWV retrievals, other window channels compensating for
the SPARC Water Vapour Assessment 2 web portal: http://           cloud and surface roughness effects.
www.sparc-climate.org/activities/water-vapour/ (last access:         TCWV from passive microwave imagers has historically
12 June 2018).                                                    only been retrieved over the ice-free oceans, and it is com-
   There are a wide variety of water vapour sensors cur-          monly although incorrectly stated that passive microwave
rently operating, and for climate research the sensors change     retrievals work over ocean only. This is due to complex
and vary through time. Understanding which sensors were           and variable land surface emissivity that changes on short
operating at any given time period is a major endeavour.          timescales due to surface wetness, vegetation state, and soil
The World Meteorological Organization has created an on-          properties. The barrier to passive microwave retrievals over
line tool which makes this task much more feasible. The           land is beginning to fall, at least for operational weather
Observing Systems Capability Analysis and Review Tool is          users, as evidenced for instance by the NOAA Microwave In-
maintained at http://www.wmo-sat.info/oscar/ (last access:        tegrated Retrieval System (Boukabara et al., 2011; Forsythe
12 June 2018).                                                    et al., 2015). Du et al. (2015) demonstrate an AMSR2 al-
   In Table 1, a summary of the main sensors used for global      gorithm to retrieve TCWV over land. AMSR2 onboard the
water vapour CDRs is presented.                                   Global Change Observation Mission – Water is a successor
                                                                  to AMSR-E onboard Aqua, and has the highest spatial reso-
2.1   Passive microwave sensors
                                                                  lution among passive microwave imagers on polar orbiting
                                                                  platforms. Land retrievals require further investigation for
Passive microwave sensors are typically classified as imagers     climate research. For the water vapour climate record the pas-
and sounders. Some instrument names indicate the principal        sive microwave TCWV record has not yet been demonstrated

www.earth-syst-sci-data.net/10/1093/2018/                                        Earth Syst. Sci. Data, 10, 1093–1117, 2018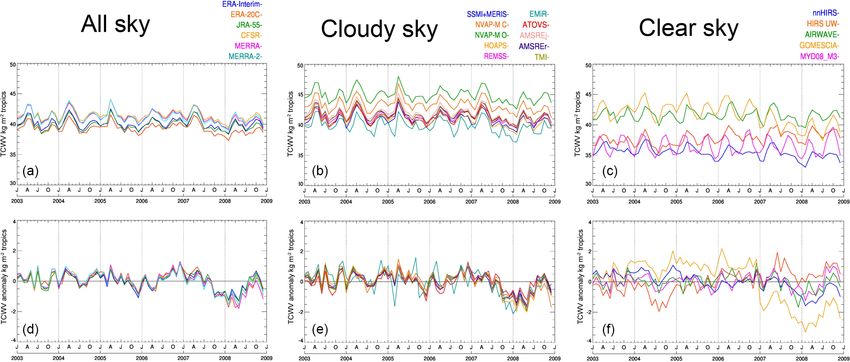
1096                                                     M. Schröder et al.: The GEWEX Water Vapor Assessment data archive

Table 1. Summary of the main satellite instruments used for water vapour climate data records. Spatial resolution is typically given at nadir.
The last column provides information on the applicability of typical water vapour retrieval schemes under certain conditions and in certain
regions.

         Sensor        Type                           Platform            Spatial                  Number of     Spatial sampling
                                                                                                   channels      characteristics
         (A)ATSR       Visible (ATSR-2, AATSR),       Polar               1 km                     7 (4 for      clear, ocean
                       NIR and IR radiometer                                                       ATSR-1)
         AIRS          Infrared hyperspectral         Polar               15 km                    2378          clear, ocean + land
                       sounder (spectrometer)
         AMSR-E        Microwave imager               Polar               12 km                    12            clear + cloudy,
                                                                                                                 ocean
         AMSU-B/       Microwave sounder              Polar               15 km                    5             clear + cloudy,
         MHS                                                                                                     ocean
         COSMIC        GPS radio occultation          Polar               ∼ 100 km along a ray     2             clear + cloudy,
                       limb sounding                                                                             ocean + land
         GOME          UV/VIS/NIR spectrometer        Polar               40 km × 320 km           3584          clear, ocean + land
         GRAS          GPS radio occultation          Polar               ∼ 100 km along a ray     2             clear + cloudy,
                       limb sounding                                                                             ocean + land
         HIRS          Infrared                       Polar               20 km                    20            clear, ocean + land
                       broadband sounder
                       (radiometer)
         IASI          Infrared hyperspectral         Polar               12 km                    8461          clear, ocean + land
                       sounder (spectrometer)
         MERIS         Visible and NIR                Polar               1 km                     15            clear, land
                       spectrometer
         MODIS         Visible, NIR and IR            Polar               0.25–1 km                36            clear
                       spectro-radiometer
         MWR           Microwave imager               Polar               20 km × 20 km            2             clear + cloudy,
                                                                                                                 ocean
         SSM/I         Microwave imager               Polar               40 km                    7             clear + cloudy,
                                                                                                                 ocean
         SSMIS         Microwave imager               Polar               47 km                    24            clear + cloudy,
                                                                                                                 ocean
         SSM/T-2       Microwave sounder              Polar               50 km                    5             clear + cloudy,
                                                                                                                 ocean
         TMI           Microwave imager               Low-inclination     10 km                    9             clear + cloudy,
                                                      tropical orbit                                             ocean
         TMR           Microwave imager               Polar               11 km × 5 km             3             clear + cloudy,
                                                                                                                 ocean

over land, but there is some possibility of this advance in the          and is augmented by the IASI instrument onboard the Metop-
coming years.                                                            A and -B spacecrafts launched in 2006 and 2012, respec-
                                                                         tively. The CrIS instruments onboard the Suomi National
                                                                         Polar-orbiting Partnership spacecraft launched in 2011 and
2.2    Infrared sensors                                                  onboard the successor Joint Polar Satellite System spacecraft
Infrared sounding sensors constitute the longest type of satel-          continue the hyperspectral sounding record. A third IASI in-
lite record for water vapour profiling. A key distinction be-            strument is due for launch at the end of 2018 onboard Metop-
tween infrared sensors for water vapour retrievals is be-                C, which will extend the IASI mission and the associated
tween radiometers (e.g. HIRS, ATSR) and spectrometers                    sounding products from 2006 to beyond 2023. IASI’s succes-
(e.g. AIRS, IASI, CrIS). The broadband observations of ra-               sor, IASI-NG, will be onboard the EPS-SG satellite, provid-
diometers constitute a longer time series (versions of the               ing hyperspectral observations until ∼ 2040. Beginning with
HIRS instrument extend back to the early 1980s), while the               Metop-C and due to the availability of IASI, HIRS will not be
hyperspectral observations of spectrometers enable retrievals            continued. In February 2016 Sentinel 3 was launched which
with more vertical information and decreased uncertainty.                carries the SLSTR instrument, a successor to the ATSR in-
The hyperspectral climate record begins with AIRS in 2002,               strument series.

Earth Syst. Sci. Data, 10, 1093–1117, 2018                                                 www.earth-syst-sci-data.net/10/1093/2018/
M. Schröder et al.: The GEWEX Water Vapor Assessment data archive 1097
Infrared-only retrievals of TCWV and water vapour profile 2.4 GPS radio occultation
are retrieved under clear-sky or mostly clear-sky conditions
only. The combination with passive microwave sounders im- GPS-RO measurements profile atmospheric refractivity with
proves the range of sky conditions in which retrievals are globally distributed, all-weather sampling from which tro-
possible (e.g. Li et al., 2000; Kahn et al., 2014). The intercal- pospheric water vapour is derived. GPS-RO missions began
ibration of the HIRS record is still continuing (e.g. Shi and with the prototype GPS-MET mission from April 1995 to
Bates, 2011). There are intersensor differences in the spectral February 1997. The CHAMP mission provided about 250 oc-
placement of the 20 channels on HIRS and most impactful is cultations per day from 2001 to 2010. A significant increase
the switch of channel 10 from 8.6 to 12.5 µm on the HIRS 3 in RO sampling density to 2000–2500 occultation profiles
and 4 sensors beginning with NOAA-15 in 1998. per day began with the launch of the six-satellite COSMIC
While land surface emissivity is much more uniform and mission in April 2006. The COSMIC orbits were spread in
less time-varying in the infrared than at microwave wave- longitude to provide full sampling of the diurnal cycle. The
lengths, infrared land surface emissivity does vary (Seemann GRAS GPS-RO instruments, flying onboard Metop-A and
et al., 2008) and can be problematic for infrared retrievals, Metop-B since 2007 and 2012, respectively, provide occul-
especially over desert surfaces. tation swaths centered on 09:30 and 21:30 local time. The
CHAMP occultation profiles only penetrate down into the
2.3 Ultraviolet/visible/near-infrared imagers upper to middle troposphere because the GPS receiver on
CHAMP was limited to closed-loop tracking. The COSMIC
A TCWV retrieval using two channels at 0.885 (window) and GRAS GPS-RO receivers use an “open-loop” tracking
and 0.9 µm (water vapour absorption) has been demonstrated capability that enables a far higher percentage of the occul-
from the MERIS and MODIS instruments (Diedrich et al., tation profiles to extend to within 1 km of the surface.
2015; Lindstrot et al., 2014). The retrieval is limited to the From the GPS-RO receiver phase measurements during
daylight portion of the swath, as differential solar reflectance each occultation, the bending of the signal path due to its
is the signal for this retrieval. These types of retrievals have passage through the atmosphere is determined. The bend-
the benefit of high spatial resolution (∼ 1 km). The MERIS ing angle profile is then inverted to a profile of index of
instrument was launched in 2002, while MODIS onboard the refraction which is closely related to the dry gas and water
Terra spacecraft begins in 1999, and is complemented by the vapour concentrations. The water vapour contribution is typ-
MODIS onboard the Aqua spacecraft which was launched ically isolated using one of two approaches. The first is a
in 2002. In February 2016 Sentinel 3 was launched which variational technique used in numerical weather prediction
carries the OLCI instrument on Sentinel 3, a successor to the assimilation systems where estimates of the water vapour,
MERIS instrument. MERIS stopped operation in April 2012, temperature and pressure from the forecast and their asso-
while the TCWV time series can be extended with data from ciated error covariances are combined with the GPS occul-
MODIS and OLCI. Retrievals from MERIS, MODIS and tation bending angle or refractivity profile and its error co-
OLCI complement passive microwave TCWV retrievals be- variance to achieve a new, statistically optimal estimate (e.g.
cause they perform best over land and have reduced quality Healy and Eyre, 2010). The second approach, referred to as
over oceans. the “Direct” method, estimates the dry part of the refractiv-
UV/VIS/NIR spectrometers such as GOME, SCIA- ity from the analysis temperature that is then subtracted from
MACHY, and GOME-2 yield retrievals of TCWV over the GPS-measured total refractivity to obtain the wet part of
land and ocean surfaces under daylight and clear-sky con- the refractivity, which is finally scaled to obtain the water
ditions (e.g. Grossi et al., 2015). The spatial resolution is be- vapour. Both methods rely on the analysis temperatures that
tween 320 km × 40 km for GOME, 60 km × 30 km for SCIA- are a combination of observations and the numerical weather
MACHY, and 80 km × 40 km for GOME-2, with cloud han- prediction model. The advantage of the Direct method is that
dling being a major challenge. it does not rely on estimates of water vapour from models,
A recent development in remote sensing of water vapour forecasts or climatologies. Estimates of the systematic and
is the retrieval of TCWV from the NASA Orbiting Carbon random uncertainties of water vapour derived from COSMIC
Observatory (OCO-2) spacecraft (Nelson et al., 2016). This observations via the Direct method are given in Kursinski and
retrieval uses near-infrared reflected sunlight with the high- Gebhardt (2014).
quality OCO-2 grating spectrometer. GPS-RO has very high vertical resolution for a satellite
Future European missions such as Sentinel-5 precursor, system (100–200 m) and a relatively coarse horizontal reso-
EPS-SG, and Sentinel-5 will carry similar UV/VIS/NIR lution of about 100 km (Kursinski et al., 1997, Eq. 13). The
spectrometers with improved spatial resolution (< 10 km), altitude range of GPS-RO individual profiles of water vapour
which will further extend the TCWV records from extends from the surface to about the 240 K temperature level
UV/VIS/NIR spectrometers. in the troposphere.
GPS-RO’s ability to routinely penetrate through clouds
combined with its insensitivity to surface emissivity elim-
www.earth-syst-sci-data.net/10/1093/2018/ Earth Syst. Sci. Data, 10, 1093–1117, 20181098 M. Schröder et al.: The GEWEX Water Vapor Assessment data archive
inates sampling biases that limit other satellite measure- 3 Overview of data records
ment systems. A caveat with present GPS-RO derived water
vapour is that in warm conditions typically found at low lat- Using observations from satellites and data from reanal-
itudes, GPS-RO water vapour profiles in the boundary layer yses, as introduced in the previous section, a large vari-
can be biased low when a sharp water vapour concentra- ety of (global) long-term and freely available water vapour
tion contrast exists between dry free tropospheric air and data records have been developed over the last decades. An
moist boundary layer air below, causing the so-called super- overview of such data records from satellite and reanalyses
refraction (e.g. Xie et al., 2006). is provided in Table 2. The table is based on the informa-
Xie et al. (2006) developed an inversion method that tion available on the G-VAP website at http://gewex-vap.org/
accounts for super-refraction and produces unbiased water ?pageid=13, where tables for operational satellites as well
vapour profiles in the boundary layer. Because it has been as in situ and ground-based products are also available. The
difficult to determine when super-refraction is occurring in first column of Table 2 gives the sensor, while the second
the COSMIC profiles, the Xie et al. method has not yet been one contains the data record name. Subsequently this name
used much. To overcome this challenge, the new GPS-RO re- is used. If not available or unique the data record is named
ceivers on COSMIC 2 are designed to provide much higher after the utilized sensor and the owner. Besides the covered
signal-to-noise ratios to enable routine detection of super- parameter and key references, the main technical specifi-
refraction. cations are provided which might allow a first-order deci-
The COSMIC 2 mission is scheduled to launch six satel- sion on the fitness-for-purpose of a particular data record.
lites in late 2018 and possibly a second set sometime later. Other information sources on water vapour data include the
Successors of GRAS will fly on EPS-SG with a sustained ECV inventory (http://climatemonitoring.info/ecvinventory),
operation until ∼ 2040. the Climate Data Guide (https://climatedataguide.ucar.edu/),
and the http://reanalyses.org/ website.
2.5 Reanalyses Note that in this section a general overview of available
data records is provided and that not all data records men-
Reanalysis systems are typically based on advanced opera- tioned in Table 2 are part of the G-VAP data archive. A few
tional atmospheric general circulation models and include more details regarding retrieval scheme and other details are
data assimilation schemes. The data assimilation merges spa- provided in short paragraphs per data record of the G-VAP
tially and temporally discontinuous observations with model data archive in Sect. 4.1.
state fields to reinitialize atmospheric forecasts and produce
spatially and temporally continuous state fields. The data as- 4 G-VAP data archive
similation schemes differ by the degree of complexity, by the
assimilation strategy (i.e. assimilation of geophysical param- In this section, the G-VAP data archive is introduced which
eters vs. assimilation of radiances) and by data input. All includes an explanation of why the archive consists of a sub-
major reanalyses assimilate a large diversity of data from set of the data records mentioned in Table 2. GDAP has ini-
observing system like radiosondes, ground-based GPS and tiated G-VAP, among others, with the purpose of having G-
GPS-RO, diverse satellites, buoys and ships and more. Re- VAP support the process of selecting suitable water vapour
analyses are performed with fixed model and data assimila- products by GDAP for its production of globally consistent
tion systems; however, data input to the reanalysis system water and energy cycle products. The usage of the products
changes over the years. Reanalysis products are generated within GDAP activities essentially implied studying long-
retrospectively, and several reanalysis centres provide near- term data records, that is, data records that start around 1980
real-time services. The major purpose is to provide a product and cover more than 3 decades. In order to increase the num-
which allows the analysis of the weather and climate and how ber of available data records, G-VAP considered freely avail-
it changes over time. Reanalyses provide global coverage and able data records with a temporal coverage of at least 10
cover the full troposphere and stratosphere. An advantage is years. Thus, the assessment considered data records that may
the large diversity of gap-free geophysical parameters. Re- not be used as input for GEWEX water and energy cycle data
analyses rely on atmospheric numerical models which carry records but which are important for establishing a deep un-
their own systematic biases, which is a disadvantage. Diver- derstanding of atmospheric water vapour observations. Af-
sity in the assimilated observations in each system, the qual- ter August 2016, the filling and updating of the G-VAP data
ity control and the varying number of observations in space archive ended in order to allow a timely analysis of the data
and time can affect the reanalysis quality. More information and provision of results to GDAP. Thus, data records that ex-
can be found in the references given in Table 2 as well as ceed a temporal coverage of more than 10 years by the end
at http://reanalyses.org (last access: 12 June 2018) and at of 2015 are considered and are marked with an asterisk in
http://s-rip.ees.hokudai.ac.jp/ (last access: 12 June 2018), the Table 2.
webpage of the SPARC Reanalysis Intercomparison Project. Next follows a short introduction to the elements of the G-
VAP data archive, to the post-processing which mainly trans-
Earth Syst. Sci. Data, 10, 1093–1117, 2018 www.earth-syst-sci-data.net/10/1093/2018/M. Schröder et al.: The GEWEX Water Vapor Assessment data archive 1099
Table 2. Satellite and reanalysis data records. Typically the data record name is given under “Data record”. If not available the owner’s name
is provided. Last access to all webpages mentioned in this table: 12 June 2018.
Technique Data record Parameters Spatial/temporal Spatial/temporal Reference(s)
resolution coverage
(A)ATSR AIRWAVE* TCWV 1 × 1 km2 , 0.25◦ , daily global, November 1991– Casadio et al. (2016),
February 2012 Castelli et al. (2015)
AIRS, HIRS, NVAP-M Climate∗ TCWV, WV 1◦ or 0.5◦ , daily global, January 1988– https://doi.org/10.5067/NVAP-
SSM/I, GNSS, December 2009 M/NVAP_CLIMATE_Total-
Radiosondes Precipitable-Water_L3.001,
Vonder Haar et al. (2012)
AIRS, AMSU, NASA TCWV, WV, T 1◦ , 12 levels, daily, global, September 2002– https://airs.jpl.nasa.gov/data/
HSB monthly present algorithms
AIRS, AMSU-A, AIRSM_CPR_IND WV, T 45 km, daily–weekly global, July 2006– https://reverb.echo.nasa.gov/reverb/
CPR, MODIS November 2012
AMSR2, REMSS∗ TCWV 1.0◦ , monthly global ice-free ocean, Hilburn and Wentz (2008)
AMSR-E, January 1988–present
SSM/I, SSMIS,
WindSat
AMSR-E REMSS∗ TCWV 0.25◦ , monthly global ocean, Hilburn and Wentz (2008)
June 2002–
September 2011
AMSR-E JAXA∗ TCWV Level 2: sensor resolution, global ocean, https://gcom-w1.jaxa.jp,
Level 3: 0.25◦ , monthly June 2002–October 2011 http://sharaku.eorc.jaxa.jp/AMSR/
products/,
Takeuchi (2002)
ATOVS CM SAF∗ TCWV, WV, T 90 km, daily, global, January 1999– https://doi.org/10.5676/EUM_
monthly December 2011 SAF_CM/WVT_ATOVS/V001,
Courcoux and Schröder (2015)
COSMIC ROM SAF WV, T 5◦ , vertically 200 m, global (zonal means), http://www.romsaf.org/GRM-19.php,
0–12 km, monthly May 2006–present http://www.romsaf.org/GRM-20.php,
http://preop.romsaf.org/product_
documents/romsaf_atbd_1dvar.pdf
COSMIC UCAR WV, T sensor resolution, vertically global, May 2006– http://cdaac-www.cosmic.ucar.edu/
100 m, sensor resolution April 2014 cdaac/products.html,
Wee and Kuo (2015)
GOME, UBremen TCWV sensor resolution, global, July 1995– http://www.iup.uni-bremen.de/
SCIAMACHY, sensor resolution March 2012 amcdoas/,
GOME-2 Noel et al. (2004)
GOME, GlobVapour∗ TCWV sensor resolution, global, January 1996– Grossi et al. (2015)
SCIAMACHY, 0.5◦ , monthly December 2008
GOME-2
GRAS UCAR WV, T sensor resolution, global, October 2007– http://cdaac-www.cosmic.ucar.edu/
vertically 100 m, December 2011 cdaac/products.html
sensor resolution
HIRS nnHIRS TCWV, WV, T 1◦ , 17 levels (10 hPa top) global, August 1979– ISCCP H-Version C-ATBD (2017)
(T), 3-hourly, monthly December 2014
HIRS NOAA TCWV, WV, T sensor resolution, global, July 1979– Shi et al. (2016)
8 layers, sensor resolution December 2014
HIRS UWisconsin∗ TCWV, WV 0.5◦ , 3 layers global, July 1980– Borbas et al. (2005),
(10–440 hPa top), March 2016 Seemann et al. (2003, 2008)
6-hourly, monthly
MERIS GlobVapour∗ TCWV 0.05◦ , 0.5◦ , daily, monthly global land, Lindstrot et al. (2012)
January 2003–
September 2012
MODIS MOD08, MYD08∗ TCWV, WV 1◦ , 20 levels (5 hPa top), global, https://doi.org/10.5067/
daily, monthly 2000–2014 (TERRA); MODIS/MOD08_M3.006,
2002–2014 (AQUA) https://doi.org/10.5067/
MODIS/MYD08_M3.006,
Platnick et al. (2015)
MWR EMiR∗ TCWV 0.5◦ , sensor resolution, global, August 1991– https://doi.org/10.5676/
monthly March 2012 DWD_EMIR/V001,
Bennartz et al. (2017)
∗ Element of the G-VAP data archive.
www.earth-syst-sci-data.net/10/1093/2018/ Earth Syst. Sci. Data, 10, 1093–1117, 20181100 M. Schröder et al.: The GEWEX Water Vapor Assessment data archive
Table 2. Continued.
Technique Data record Parameters Spatial/temporal Spatial/temporal Reference(s)
resolution coverage
OCO-2 CSU TCWV 1.3 km × 2.3 km, global, August 2014– Nelson et al. (2016)
sensor resolution present
OMI NASA/Harvard TCWV 13 km × 24 km at nadir, global, January 2005– Wang et al. (2016)
sensor resolution December 2009
POLDER U Lille TCWV 1/6◦ , sensor resolution, global, December 2004– http://www.icare.univ-lille1.fr/
daily, monthly December 2013 /archive/?dir=PARASOL/RB2.
v18.19/,
Bouffies et al. (1997)
Reanalysis ERA-Interim∗ TCWV, WV, T ∼ 80 km (T255), 60 levels global, January 1979– Dee et al. (2011)
(0.1 hPa top), present
6-hourly, monthly
Reanalysis ERA-20C∗ TCWV, WV, T ∼ 125 km (T159), global, January 1900– Poli et al. (2016)
91 levels (0.01 hPa top), December 2010
3-hourly, monthly
Reanalysis MERRA∗ TCWV, WV, T 0.5◦ × 0.667◦ , global, January 1979– Rienecker et al. (2011)
72 levels (0.01 hPa top), February 2016
hourly (TCWV),
6-hourly, monthly
Reanalysis MERRA-2 TCWV, WV, T 0.5◦ × 0.625◦ , global, January 1980– Gelaro et al. (2017)
72 levels (top 0.01 hPa), present
hourly, 6-hourly, monthly
Reanalysis CFSR∗ TCWV, WV, T 0.5◦ (T382), global, January 1979– Saha et al. (2010)
37 levels (0.266 hPa top), present
hourly, monthly
Reanalysis JRA-55∗ TCWV, WV, T ∼ 55 km (T319) or 1.25◦ , global, January 1958– Kobayashi et al. (2015)
60 levels (0.1 hPa top), present
3-hourly, 6-hourly, monthly
SSM/I HOAPS∗ TCWV 0.5◦ , 6-hourly, monthly global ocean, July 1987– Schlüssel and Emery (1990),
December 2008 Andersson et al. (2010)
SSM/I NVAP-M Ocean∗ TCWV 1.0◦ , daily global ice-free ocean, https://doi.org/10.5067/NVAP-
January 1988– M/NVAP_CLIMATE_Total-
December 2009 Precipitable-Water_L3.001,
Vonder Haar et al. (2012)
SSM/I, MERIS GlobVapour∗ TCWV 0.05◦ , 0.5◦ , daily, monthly global, January 2003– https://doi.org/10.5676/DFE/
December 2008 WV_COMB/FP,
Lindstrot et al. (2014)
TES NASA TCWV, WV, T 4◦ × 2◦ , daily, monthly global, September 2004– https://tes.jpl.nasa.gov/data,
present Worden et al. (2006)
TMI REMSS∗ TCWV 0.25◦ , monthly global ocean, Wentz (1997, 2015)
December 1997–
December 2014
TOVS TOVS TCWV, WV, T 1◦ , 4 layers (300 hPa top), global, January 1987– Scott et al. (1999)
Path B daily, monthly June 1995
TOVS TOVS TCWV, WV, T 1◦ , 4 layers (300 hPa top), global, January 1987– Susskind et al. (1997)
Path A daily, monthly June 1993
∗ Element of the G-VAP data archive.
fers the data records onto a common grid and period, and to AIRWAVE
the archive structure.
The AIRWAVE retrieval scheme exploits the dual view capa-
4.1 Introduction to individual data records bilities of the ATSR instrument series by using the two ther-
mal infrared channels, centred at 10.8 and 12 µm. It works
The elements of the G-VAP data archive are given in Table 2
above the cloud-free ocean by combining advanced radiative
and are marked with asterisks. In this section abstracts are
transfer models and a spectral emissivity database. The si-
provided for each element of the archive. These abstracts
multaneous use of ATSR’s forward and nadir measurements
briefly introduce the input data, the retrieval scheme, and
minimizes the impact of the limited knowledge about the
technical specifications, provide basic references to the al-
SST and the atmospheric radiation on the quality of the re-
gorithm and/or the data record, and give access details.
trieved TCWV. Exploiting only the thermal infrared chan-
nels of the instrument, the algorithm enables the estimation
Earth Syst. Sci. Data, 10, 1093–1117, 2018 www.earth-syst-sci-data.net/10/1093/2018/M. Schröder et al.: The GEWEX Water Vapor Assessment data archive 1101
of TCWV for both day and night observations and the full surements from TMI (Wentz, 2015) and with TCWV mea-
exploitation of the ATSR instrument series, spanning from surements made by ground-based GNSS sensors located on
1991 to 2012 (see Casadio et al., 2016, and Castelli et al., small islands (Mears et al., 2015). Monthly means of AMSR-
2015, for details on the retrieval). The AIRWAVE processor E REMSS V7 were downloaded in March 2015.
is integrated in the ESA Grid Processing on Demand envi-
ronment for the bulk processing of the three ATSR missions ATOVS CM SAF
(1991–2012). The product is available in Level 2 (1 × 1 km2
and 0.25◦ × 0.25◦ ). Results from comparisons to satellite and The ATOVS data record from CM SAF offers 13 years
radiosonde products can be found in Casadio et al. (2016) (1999–2011) of satellite-derived global water vapour and
and Papandrea et al. (2018). The AIRWAVE version 1 data temperature products. Different parameters are generated
record was provided as monthly means at a spatial resolution simultaneously: TCWV, mean temperature and vertically
of 1◦ × 1◦ via ftp in June 2015. integrated water vapour in five layers, as well as specific
humidity and temperature at six levels. Also available are the
AMSR-E JAXA
number of valid observations and an uncertainty estimate.
The data record was derived from ATOVS onboard NOAA-
The AMSR-E standard TCWV algorithm uses AMSR-E 15 to -19 and Metop-A. ATOVS is composed of three
brightness temperatures at 18.7, 23.8, and 36.5 GHz chan- instruments: HIRS, AMSU-B/MHS and AMSU-A. After
nels for V/H polarization, and SST, sea surface wind speed, application of a kriging routine, the products are available as
temperature at 850 hPa given by the Japan Meteorological daily and monthly means on a cylindrical equal area projec-
Agency six-hourly global analysis data as ancillary data (see tion at a resolution of 90 km × 90 km. Further details on the
Takeuchi, 2002 and Takeuchi et al., 2004 for details on the retrieval, the data record and validation results can be found
retrieval). The algorithm is applicable to open ocean regions in Courcoux and Schröder (2015). Also, the validation re-
only and its dynamic range is 0–70 kg m−2 . The product port, algorithm theoretical basis document and product user
is available in Level 2 (swath data with about 10 km sam- manual can be downloaded from http://www.cmsaf.eu/docs
pling intervals) and Level 3 (daily, monthly, 0.25◦ × 0.25◦ (last access: 12 June 2018). The data record is doi-referenced
grid for ascending and descending orbits) from June 2002 (https://doi.org/10.5676/EUM_SAF_CM/WVT_ATOVS/V001)
to October 2011. The reprocessing of the AMSR-E TCWV and accessible via http://wui.cmsaf.eu (last access:
product is underway along with other AMSR-E geophysi- 12 June 2018). Here, ATOVS CM SAF version 1 was
cal parameter products by applying the latest AMSR2 algo- utilized, which was downloaded in April 2013.
rithm (see Kazumori et al., 2012; Kazumori, 2013) in or-
der to produce consistent AMSR-E/AMSR2 products cov- CFSR
ering more than 15 years. The accuracy of the product is
described in Kazumori et al. (2012). The AMSR-E JAXA The NCEP CFSR was designed and executed as a global,
version 2 was downloaded as monthly means from https: high-resolution coupled atmosphere–ocean–land surface–sea
//gcom-w1.jaxa.jp/auth.html in February 2015. ice system to provide an estimate of the state of these coupled
domains over the period from 1979 to the present, currently
AMSR-E REMSS
being run as an operational, real-time product. The CFSR in-
cludes (1) coupling of the atmosphere and ocean during the
The AMSR-E REMSS water vapour algorithm utilizes all generation of the 6 h guess field, (2) an interactive sea ice
AMSR-E channels and is part of a multi-parameter re- model, and (3) assimilation of satellite radiances by the Grid-
trieval scheme that simultaneously retrieves TCWV, sur- point Statistical Interpolation scheme over the entire period.
face wind speed, SST, and cloud liquid water content and The CFSR global atmosphere resolution is ∼ 38 km (T382)
rain rate for ocean scenes. The basic algorithm is de- with 64 levels extending from the surface to 0.26 hPa from
scribed in Wentz (1997), with updated models of the mi- 1979 to 2009 and is ∼ 25 km (T574) after that. The CFSR
crowave absorption, emission, and scattering by the at- atmospheric model has observed variations in CO2 over the
mosphere and ocean surface (Meissner and Wentz, 2012; 1979–present period, together with changes in aerosols and
Wentz and Meissner, 2017). The algorithm most strongly other trace gases and solar variations. Most available in situ
depends on the 23.8 GHz, on the upper wing of the water and satellite observations were included in the CFSR. Satel-
vapour line at 23.235 GHz, with the other AMSR-E chan- lite observations were used in radiance form, rather than re-
nels providing information about surface roughness and at- trieved values, and were bias corrected with “spin-up” runs at
mospheric scattering and absorption from liquid water. The full resolution, taking into account variable CO2 concentra-
data are available as twice-per-day near-global gridded maps tions. CFSR output products are available at an hourly time
with 0.25◦ × 0.25◦ resolutions from http://www.remss.com/ resolution and a horizontal resolution of 0.5◦ × 0.5◦ . More
missions/amsr/ (last access: 12 June 2018). The TCWV val- details on the methodology and results from evaluation are
ues have been validated via comparison with similar mea- given in Saha et al. (2010). The CFSR data are distributed
www.earth-syst-sci-data.net/10/1093/2018/ Earth Syst. Sci. Data, 10, 1093–1117, 20181102 M. Schröder et al.: The GEWEX Water Vapor Assessment data archive
by the National Center for Environmental Information and from scatterometers, ozone retrievals, measurements from
National Center for Atmospheric Research. The temperature GPS radio occultation and ocean wave height from altime-
as well as TCWV and specific humidity profile data records ters are ingested. Between 1992 and 2006 there is an arti-
were accessed via https://rda.ucar.edu/datasets/ds093.2/ in ficial reduction in precipitation of about 0.1 mm day−1 over
March 2016 and June 2013, respectively. the global oceans, which can be traced back to a problem in
the linearized moist physics in the 1D-Var observation opera-
EMiR
tor in the above-mentioned 1D+4D-Var scheme (Geer et al.,
2008). The ERA-Interim reanalysis provides globally com-
The MWR instrument flown onboard European Remote plete atmospheric products from 1979 onwards at a mixed 3-
Sensing satellites 1 and 2 as well as onboard the Environmen- hourly/6-hourly output frequency and is continued with up-
tal Satellite has provided a time series of global microwave dates available at about 3 months behind real time. ERA-
observations over a period of nearly 21 years between 1991 Interim and its quality is described in Dee et al. (2011).
and 2012. The EMiR data record builds on the MWR time Monthly means of temperature as well as TCWV and spe-
series by applying a one-dimensional variational approach to cific humidity with a spatial resolution of 1◦ × 1◦ were
provide information on TCWV and wet tropospheric correc- downloaded from http://apps.ecmwf.int/datasets/ in Novem-
tion in clear- and cloudy-sky conditions. Significant efforts ber 2012 and June 2016, respectively.
were invested to ensure a good intercalibration of the three
MWR instruments. The EMiR data record covers the entire ERA-20C
global ice-free ocean from November 1992 to March 2012. It
is available for individual orbits at a spatial resolution of typ- ERA-20C’s atmospheric general circulation model and 4D-
ically 20 km as well in a gridded form for monthly mean val- Var assimilation system are based on the version of the
ues at 2◦ × 2◦ and 3◦ × 3◦ spatial resolution. Details on the ECMWF integrated forecast system that was used in the
retrieval, the data record and results from validation are given ECMWF operational system between 19 June 2012 and
in Bennartz et al. (2017). The EMiR data record and support- 25 June 2013 (Cy38r1). It was conducted though at a much
ing information can be obtained free of charge from http://dx. reduced resolution of about 125 km in the horizontal (T159
doi.org/10.5676/DWD_EMIR/V001. The EMiR data record in spectral space) and 91 levels in the vertical from the sur-
(version 1) was downloaded in May 2016. face to about 80 km height (0.01 hPa). The radiative forc-
ing includes the CMIP5-prescribed (Taylor et al., 2012) evo-
ERA-Interim
lution of greenhouse gases, tropospheric and stratospheric
(volcanic) aerosols and solar forcing, while the ocean sur-
The ERA-Interim’s atmospheric general circulation model face is constrained by prescribed forcing from the HadISST2
and 4D-Var assimilation system are based on the version of SST and sea-ice product (see Hersbach et al., 2015 for de-
the ECMWF integrated forecast system that was used in the tails). ERA-20C only uses observations from surface pres-
ECMWF operational system between 12 December 2006 and sure, mean sea level pressure and marine wind, which were
5 June 2007 (Cy31r2). It is conducted at reduced resolution obtained from the International Surface Pressure Databank
of about 79 km in the horizontal (T255 in spectral space) and (Cram et al., 2015) version 3.2.6 and the International Com-
60 levels in the vertical from the surface to 0.1 hPa. ERA- prehensive Ocean–Atmosphere Data Set (Woodruff et al.,
Interim is the predecessor of the ERA5 reanalysis, which 2011) version 2.5.1. No humidity observations are assimi-
is currently in production (Hersbach and Dee, 2016). ERA- lated and the analysis fields for water vapour are provided
Interim incorporates an improved representation of the hy- indirectly from the assimilated pressure and wind observa-
drological cycle, 4D-Var, the implementation of variational tions via the model equations in a physically meaningful way.
bias control for satellite radiances and the assimilation of ERA-20C provides globally complete atmospheric estimates
TCWV satellite retrievals using the 1D+4D-Var approach for the period 1900–2010 at a 3-hourly output frequency.
(Bauer et al., 2006a, b). Over the global oceans boundary ERA-20C and its quality is described in Poli et al. (2016).
conditions are provided by prescribed estimates for SST and Monthly means of TCWV, specific humidity and tempera-
sea-ice cover. ERA-Interim exploits in situ measurements ture with a spatial resolution of 1◦ × 1◦ were downloaded
of surface pressure, 2 m temperature, 2 m relative humidity from http://apps.ecmwf.int/datasets/ in June 2016.
from land stations, ships and drifting buoys and near-surface
wind from these latter two, upper-air temperatures, wind, and GOME/SCIAMACHY/GOME-2 GlobVapour
specific humidity from radiosondes, pilot balloons, aircraft,
and wind profilers. The largest amount of data comes from The GOME/SCIAMACHY/GOME-2 family of instru-
polar-orbiting and geostationary satellite observations, which ments are nadir-looking spectrometers operating in the
are mostly assimilated as brightness temperature using suit- UV/VIS/NIR wavelength region. A spectral window around
able observation operators. In addition, satellite-derived at- the H2 O absorption lines near 630 nm is used for the retrieval
mospheric motion vector winds, information on surface wind of TCWV over both ocean and land surfaces under daylight
Earth Syst. Sci. Data, 10, 1093–1117, 2018 www.earth-syst-sci-data.net/10/1093/2018/M. Schröder et al.: The GEWEX Water Vapor Assessment data archive 1103
and clear-sky conditions (Wagner et al., 2003). Here, the a regular latitude–longitude grid with a spatial resolution
GOME Data Processor 4.x algorithm (Grossi et al., 2015) of 0.5◦ × 0.5◦ . More details on the water vapour retrieval,
is applied to observations from all three sensors. The algo- the data record and results from validation can be found in
rithm has two major steps: the differential optical absorption Schlüssel and Emery (1990), Andersson et al. (2010) and
spectroscopy least-squares fitting for the trace gas slant col- Schröder et al. (2013), respectively. Also, the validation re-
umn, followed by the computation of a suitable air mass fac- port, algorithm theoretical basis document, and product user
tor to make the conversion to the vertical column density. manual can be downloaded from http://www.cmsaf.eu/docs.
The air mass factor algorithm used is optimized for gener- Starting with v3.1 the data are accessible via http://wui.
ating self-consistent long-term climatological data, by min- cmsaf.eu. Here, HOAPS v3.2 was utilized, which was down-
imizing external inputs. Monthly time series of TCWV de- loaded in March 2012.
rived for each instrument are harmonized using GOME as
a reference. The product covers the period January 1996 JRA-55
until December 2008 and has a spatial resolution of 0.5◦ .
Further details on the data record and results from valida- JRA-55 is a global atmospheric climate dataset covering the
tion can be found at http://globvapour.info/documents.html period from 1958, when regular radiosonde observations be-
(last access: 12 June 2018) (see Product User Guide and gan on a global basis, to the present. JRA-55 has been pro-
Product Validation Report). The data record is accessible duced with the TL319 version of the Japan Meteorological
via http://globvapour.info/products.html#daftp and version 1 Agency operational data assimilation system (as of Decem-
was downloaded in June 2016. ber 2009), which features among others four-dimensional
variational analysis (4D-Var) and variational bias correction
HIRS UWisconsin
for satellite radiances. The products are available as monthly,
6-hourly and 3-hourly (for surface parameters only) tempo-
The HIRS UWisconsin moisture record retrieves TCWV as ral resolutions on the TL319 quasi-regular Gaussian grid (ap-
well as integrated high, mid, and low layer tropospheric hu- proximately 55 km resolution) as well as a regular latitude–
midity from clear-sky radiances measured by HIRS over land longitude grid with a spatial resolution of 1.25◦ × 1.25◦ .
and ocean both day and night. The retrieval is a statistical More details on the input data, methodology and quality
regression (Seemann et al., 2003, 2008) developed from an of JRA-55 can be found in Kobayashi et al. (2015). Also,
atmospheric profile database (SeeBor, Borbas et al., 2005) the JRA-55 product users’ handbook can be downloaded
that consists of geographically and seasonally distributed ra- from http://jra.kishou.go.jp/JRA-55/index_en.html (last ac-
diosonde, ozonesonde, and ECMWF reanalysis data. The cess: 12 June 2018). Monthly means of temperature as well
AVHRR based Pathfinder Atmospheres – Extended cloud as TCWV and specific humidity were downloaded from http:
mask is used to characterize HIRS sub-pixel cloud cover. //jra.kishou.go.jp/ in February 2015 and July 2016, respec-
The HIRS TCWV and integrated high layer tropospheric hu- tively.
midity products are binned into a global map of 0.5◦ × 0.5◦ ,
for four time periods daily (night before and after mid- Merged Microwave REMSS
night and day before and after noon) and compiled into
monthly amounts. The HIRS UWisconsin moisture pack- The REMSS monthly merged TCWV vapour product is
age (version 2.5R2) was provided via ftp and downloaded assembled by combining measurements from SSM/I, SS-
in May 2016. MIS, AMSR-E, WindSat, and AMSR2. The vapour algo-
rithms for each of these instruments are very similar to
HOAPS
the AMSR-E REMSS algorithm described above. The data
from each satellite are assembled into monthly 1◦ × 1◦
The HOAPS data record is a satellite-based climatology of gridded maps with valid TCWV over the ice-free ocean.
TCWV, near-surface specific humidity, wind speed, precip- These maps are quality controlled to exclude grid points
itation, evaporation, latent heat flux and freshwater budget that are corrupted by ice or land emission. Then small off-
(evaporation minus precipitation) over the global ice-free sets that are derived from comparisons with TMI (Wentz,
oceans. All variables are derived from SSM/I passive mi- 2015) are applied to satellites with significant overlap with
crowave radiometers onboard various DMSP platforms, ex- TMI. Then the gridded maps were combined into a sin-
cept for SST, which is taken from AVHRR measurements. gle data record, using simple averaging for months when
The data record generation involves multi-satellite averages, two or more satellites were operating. The merged TCWV
inter-sensor calibration, and an efficient sea ice detection product is available at http://www.remss.com/measurements/
procedure. All HOAPS products have global coverage, i.e. atmospheric-water-vapor (last access: 12 June 2018) as
within ±180◦ longitude and ±80◦ latitude, and are only gridded 1◦ × 1◦ gridded maps from January 1988 to the
defined over the ice-free ocean surface. The products are present and is updated on a monthly basis. Validation re-
available as monthly averages and 6-hourly composites on sults can be found in Mears et al. (2015). The TCWV data
www.earth-syst-sci-data.net/10/1093/2018/ Earth Syst. Sci. Data, 10, 1093–1117, 20181104 M. Schröder et al.: The GEWEX Water Vapor Assessment data archive
record (V7) was obtained online from http://www.remss. tenuation by water vapour of near-IR solar radiation. Tech-
com/measurements/atmospheric-water-vapor/ in April 2013. niques (Gao and Kaufman, 2003) employing ratios of water-
vapour-absorbing channels 17, 18, and 19 with the atmo-
MERIS GlobVapour
spheric window channels 2 and 5 are used. The ratios remove
partially the effects of variation of surface reflectance with
The high spatial resolution TCWV data record was derived wavelength and result in atmospheric water-vapour transmit-
from ESA’s third reprocessing of the MERIS L1 archive. The tances. The solar retrieval algorithm relies on observations
TCWV retrieval is based on an optimal estimation approach of water-vapour attenuation of reflected solar radiation in the
and applied to swath-based, normalized radiances in MERIS near-infrared MODIS channels so that the product is pro-
bands at 865, 885, and 900 nm, while the cloud screening duced only over areas where there is a reflective surface in
procedure utilizes the full set of MERIS radiances between the near IR, during the daytime, over clear land areas of the
400 and 900 nm. The product also includes information on globe and above clouds over both land and ocean. Over clear
uncertainties. Further details on the retrieval and results from ocean areas, water-vapour estimates are provided over the
validation are given in Lindstrot et al. (2012). The data record extended glint area. The Level 2 data are generated at the
covers the period January 2003–March 2012 and is avail- 1 km spatial resolution of the MODIS instrument. There are
able on a global grid at a spatial resolution of 0.05◦ over three MODIS Level 3 gridded atmosphere products: daily,
the coastal ocean, open ocean areas with occurring sun glint, 8-day, and monthly, where the Level 2 atmosphere products
and cloud-free land surfaces. The data record (version 1) was are aggregated to a 1◦ × 1◦ equal-angle global grid (called
provided via ftp in July 2015. MOD08, Platnick et al., 2015). The MODIS/Aqua MYD08
monthly mean TCWV data record (MYD08_M3) was down-
MERRA/MERRA-2
loaded from https://ladsweb.modaps.eosdis.nasa.gov/search/
order/2/MYD08_M3--6 in May 2015.
MERRA is described in Rienecker et al. (2011). While there
were some successes in MERRA, the changing observing nnHIRS
system, particularly with sensors sensitive to water vapour,
lead to spurious jumps in the global TCWV record. In at- The nnHIRS global atmospheric temperature–humidity pro-
tempting to improve on MERRA, MERRA-2 incorporates file data product is one of the products produced by the In-
a mass conservation constraint on the dry mass and water ternational Satellite Cloud Climatology Project and is based
vapour assimilation that results in the global water vapour on new retrievals from re-calibrated HIRS measurements
analysis increment to be negligibly small, which has the re- (Shi et al., 2016) with temporal (and some spatial) inter-
sult of a global evaporation and precipitation balance (Takacs polations to provide global coverage every 3 h over the pe-
et al., 2016; Gelaro et al., 2017). For total column water, riod 1980–2015. The new retrievals include the following:
this has led to a global time series that is much more sta- (1) a cloud detection algorithm is applied to each individ-
ble than that of MERRA (Bosilovich et al., 2017). While ual field of view (pixel) and all clear pixels are processed,
the global water analysis increments are essentially zero, (2) the retrieval procedure accounts for variations of CO2
they can have a value at any given point or region, and abundance over the record, (3) the retrieval procedure ac-
the influence of the changing water vapour observations can counts explicitly for variations of surface topography and
also be apparent. In addition, over land surfaces, MERRA-2 (4) the retrieval obtains values for near-surface air and skin
uses observation corrected precipitation as the surface source temperatures separately. Because of cloud cover, the typi-
of water, providing another observation constraint in the cal coverage of the globe on a given day is about 30 %,
global water cycle (Reichle et al., 2017). The input data, but only about 10–15 % at a given time of day. This prod-
the methodology and the quality of MERRA2 are described uct provides global coverage every 3 h from the new re-
in Gelaro et al. (2017). Monthly means of temperature as trieval results by employing time-interpolation procedures,
well as TCWV and of specific humidity (MERRA) with including a specific statistical model of the diurnal varia-
a spatial resolution of 0.5◦ × 0.66◦ were downloaded from tions of temperature in the lower troposphere over land. The
https://goldsmr2.gesdisc.eosdis.nasa.gov/ in November 2012 humidity profile is extended into the stratosphere by com-
and March 2013, respectively. MERRA-2 has a spatial res- bining the HIRS-based results with those from other satel-
olution of 0.5◦ × 0.625◦ and was downloaded from https: lite measurements of humidity (Davis and Rosenlof, 2016).
//goldsmr5.gesdisc.eosdis.nasa.gov/ in April 2016. The near-surface humidity over oceans is adjusted based on
a matched analysis of satellite microwave observations to
MODIS/Aqua NASA (MYD08_M3)
produce the SeaFlux products (Clayson et al., 2012). The
near-surface temperatures over land are adjusted based on
The MODIS/Aqua TCWV data record from NASA was the global collection of surface weather observations (Smith
obtained from the Collection 6 MODIS Near-IR Products et al., 2011). Results from comparisons to various other ob-
(called MOD05). The near-IR TCWV is derived from the at- servations are shown in ISCCP H-Version C-ATBD (2017).
Earth Syst. Sci. Data, 10, 1093–1117, 2018 www.earth-syst-sci-data.net/10/1093/2018/You can also read