The Global Financial Centres Index 25 - MARCH 2019 - Financial Centre Futures - Long Finance
←
→
Page content transcription
If your browser does not render page correctly, please read the page content below

The Global
Financial Centres
Index 25
MARCH 2019

  Financial Centre Futures
In March 2007, Z/Yen released the first edition of the GFCI, which continues to provide
evaluations of competitiveness and rankings for the major financial centres around the
world. We are pleased to present the twenty-fifth edition of the Global Financial Centres
Index (GFCI 25).

In July 2016, the China Development Institute (CDI) in Shenzhen and Z/Yen Partners in
London established a strategic partnership for research into financial centres. We continue
our collaboration in producing the GFCI.

The GFCI is updated every March and September and receives considerable attention from
the global financial community. The index serves as a valuable reference for policy and
investment decisions.

Z/Yen is the City of London's leading commercial think-tank. Z/Yen was founded in 1994 to
promote societal advance through better finance and technology. Z/Yen has built its
practice around a core of high-powered project managers, supported by experienced
technical specialists so that clients get expertise they need, rather than just resources
available. The firm is headquartered in London, but Z/Yen is committed to the ‘virtual
office’ concept and is an intense user of technology in order to improve flexibility and
benefit staff.

The CDI is a leading national think-tank that
develops solutions to public policy challenges
through broad-scope and in-depth research to
help advance China’s reform and opening-up to
world markets. The CDI has been working on
the promotion and development of China’s
financial system since its establishment 30
years ago. Based on rigorous research and
objective analysis, CDI is committed to
providing innovative and pragmatic reports for
governments at different levels in China and
corporations at home and abroad.

The authors of this report, Mark Yeandle and
Mike Wardle, would like to thank Bikash Kharel,
Michael Mainelli, Carol Feng, Peng Yu, and the
rest of the GFCI team for their contributions
with research, modelling, and ideas.
The Global Financial Centres Index 25 | 1

Foreword
The release of the Global Financial Centres Index is always an important day in the
calendar for Dubai International Financial Centre.

This year is particularly special for us as the DIFC celebrates 15 years of facilitating
trade and investment flows across the Middle East, Africa and South Asia (MEASA)
region.

The Centre was established in 2004 with the vision to become a global financial hub,
which we have successfully achieved under the guidance and support of His
Highness Sheikh Mohammed bin Rashid Al Maktoum, Vice President and Prime
Minister of the UAE and Ruler of Dubai.

Since then, DIFC has grown into one of the world’s most advanced financial centres,
and the leading financial hub for the region. We are home to an internationally-
recognised, independent regulator and a proven judicial system with an English
common law framework, as well as the region’s largest financial ecosystem of more
than 23,000 professionals working across over 2,100 active registered companies.

Now, we are entering a new period of growth through the recently announced plans
for DIFC 2.0, which reframes our vision. The 13 million square feet development will
drive growth within the regional financial landscape and foster an environment
where innovation and entrepreneurship thrive.

Indeed, we are already seeing our vision coming to life in so many ways, from the
growth of emerging sectors, such as aviation financing and FinTech, to the size of the
wealth and asset management sector at DIFC. The latter now stands at almost US$
500 billion dollars, which is testament to the capital being raised in the Centre.

By continuing to align with the national government agenda that aims to ensure
Dubai’s sustained prosperity and accelerate the development journey of the
Emirate, DIFC will remain at the forefront of financial sector advancement.

H.E. Essa Kazim
Governor
Dubai International Financial Centre

2 | The Global Financial Centres Index 25

GFCI 25 Summary And Headlines
Overview
•   We researched 112 centres for this edition of the Global Financial Centres Index
    (GFCI 25). The number of financial centres in the main index has increased from 100
    to 102 with the addition of Stuttgart, Kuwait City and Nairobi from the associate
    centres list and the exclusion of Trinidad & Tobago which did not obtain a sufficient
    number of assessments. There are ten associate centres awaiting potential inclusion
    in the main index.
•   GFCI 25 was compiled using 133 instrumental factors. These quantitative measures
    are provided by third parties including the World Bank, The Economist Intelligence
    Unit, the OECD, and the United Nations. Details can be found in Appendix 4.
•   The instrumental factors were combined with 29,065 financial centre assessments
    provided by respondents to the GFCI online questionnaire
    (globalfinancialcentres.net/survey).
•   A breakdown of the 2,373 respondents is shown in Appendix 2. Further details of the
    methodology behind GFCI 25 are in Appendix 3.
•   Performance across the index was encouraging as respondents are more confident
    about the future than in GFCI 24. Within the top 30 centres in the index, 26 centres
    rose in the ratings while one fell and three remained stationary. Only 16 of the 102
    centres fell in the ratings.

The Results
Leading Centres
•   New York remains in first place in the index, seven points head of London. Hong
    Kong is only four points behind London in third and Singapore remains in fourth
    place;
•   Shanghai remains ahead of Tokyo in fifth place in the index although Tokyo gained
    ten points in the ratings;
•   Toronto rose 27 points and gained four places to seventh. Zurich, Beijing, and
    Frankfurt remained in the top ten.
Western Europe
•   This region did well after a mixed performance in GFCI 24. Thirteen of the top 15
    Western European centres rose in the ratings with particularly strong performances
    by Monaco, Madrid and Edinburgh. Only Luxembourg and Amsterdam saw modest
    declines;
•   The centres that are most likely to benefit from Brexit did well, with Zurich,
    Frankfurt, Paris, and Dublin all gaining ground. Amsterdam was the only centre in
    Western Europe that dropped more than ten points in the ratings.
The Global Financial Centres Index 25 | 3

Asia/Pacific
•   Most Asia/Pacific Centres performed well. Of the top twenty centres in the region,
    only Osaka saw a modest decline with the others rising or remaining as they were in
    GFCI 24;
•   There has been a strong trend of Asia/Pacific centres improving over several years.
    The top eight centres in the region are now in the top fifteen centres in the whole
    index;
•   Melbourne, Jakarta, and GIFT City (Gujarat) all showed strong increases in GFCI 25.

North America
•   North American centres also did well in GFCI 25 with most centres rising in the
    ratings. Of particular note is the performance of Toronto, Montreal and Vancouver,
    the three leading Canadian centres. All three showed strong increases in the ratings.
    Toronto rose four places to seventh overall and Montreal is now in 18th place;
•   Washington DC regained the ground that it lost in GFCI 24 with a rise of 34 points.
    This rise resulted in it climbing four places to 32nd overall.

Eastern Europe And Central Asia
•   There were significant gains for Astana, Istanbul and Prague. Astana only officially
    launched its financial centre in 2018, and it is unusual for such a new centre to
    perform so strongly;
•   Tallinn made a lot of ground in GFCI 24 but fell back this time despite a growing
    reputation as a strong FinTech centre.

Middle East And Africa
•   Dubai, Casablanca, and Abu Dhabi continued to rise in the index. Doha lost some of
    the ground it made in GFCI 24;
•   Kuwait City and Nairobi were new entrants to the index, with Kuwait ranking 57 th in
    its first entry.

Latin America And The Caribbean
•   There were mixed results in the region with five centres rising in the ranks and three
    declining. The Cayman Islands, Panama, and Bermuda performed strongly.

Island Centres
•   The British Crown dependencies showed a mixed performance with Jersey making a
    small gain, the Isle of Man moving up but Guernsey dropping 15 places in the index to
    75th place.
4 | The Global Financial Centres Index 25

Table 1 | GFCI 25 Top 50 Ranks And Ratings
                                 GFCI 25                   GFCI 24            Change in   Change in
        Centre
                          Rank             Rating   Rank             Rating     Rank        Rating
New York                   1                794      1                788        0          ▲6
London                     2                787      2                786        0          ▲1
Hong Kong                  3                783      3                783        0           0
Singapore                  4                772      4                769        0          ▲3
Shanghai                   5                770      5                766        0          ▲4
Tokyo                      6                756      6                746        0          ▲10
Toronto                    7                755      11               728       ▲4          ▲27
Zurich                     8                739      9                732       ▲1          ▲7
Beijing                    9                738      8                733       ▼1          ▲5
Frankfurt                  10               737      10               730        0          ▲7
Sydney                     11               736      7                734       ▼4          ▲2
Dubai                      12               733      15               722       ▲3          ▲11
Boston                     13               732      13               725        0          ▲7
Shenzhen                   14               730      12               726       ▼2          ▲4
Melbourne                  15               729      20               699       ▲5          ▲30
San Francisco              16               727      14               724       ▼2          ▲3
Los Angeles                17               724      16               721       ▼1          ▲3
Montreal                   18               722      24               690       ▲6          ▲32
Vancouver                  19               721      18               709       ▼1          ▲12
Chicago                    20               717      17               717       ▼3           0
Cayman Islands             21               713      29               683       ▲8          ▲30
Casablanca                 22               712      28               684       ▲6          ▲28
Tel Aviv                   23               710      25               689       ▲2          ▲21
Guangzhou                  24               708      19               708       ▼5           0
Bermuda                    25               705      30               680       ▲5          ▲25
Abu Dhabi                  26               702      26               686        0          ▲16
Paris                      27               699      23               691       ▼4          ▲8
Geneva                     28               698      27               685       ▼1          ▲13
Qingdao                    29               694      31               679       ▲2          ▲15
Luxembourg                 30               691      21               694       ▼9          ▼3
Osaka                      31               690      22               693       ▼9          ▼3
Washington DC              32               689      36               655       ▲4          ▲34
Monaco                     33               686      46               629       ▲13         ▲57
Taipei                     34               676      32               670       ▼2          ▲6
Edinburgh                  35               674      43               634       ▲8          ▲40
Seoul                      36               668      33               668       ▼3           0
Madrid                     37               667      53               619       ▲16         ▲48
Dublin                     38               658      37               652       ▼1          ▲6
Kuala Lumpur               39               652      40               638       ▲1          ▲14
Wellington                 40               647      45               630       ▲5          ▲17
Amsterdam                  41               646      35               657       ▼6          ▼11
Doha                       42               642      34               662       ▼8          ▼20
Munich                     43               641      39               639       ▼4          ▲2
Vienna                     44               640      51               621       ▲7          ▲19
Milan                      45               638      56               613       ▲11         ▲25
Busan                      46               636      44               631       ▼2          ▲5
Jersey                     47               635      47               628        0          ▲7
Johannesburg               48               634      57               612       ▲9          ▲22
Stuttgart                  49               633     New               New       New         New
Hamburg                    50               632      41               636       ▼9          ▼4
The Global Financial Centres Index 25 | 5

Table 1 (Continued) | GFCI 25 Remaining Ranks And Ratings
                                 GFCI 25                       GFCI 24            Change in   Change in
         Centre
                          Rank             Rating       Rank             Rating     Rank        Rating
Astana                     51               631          61               599       ▲10         ▲32
Brussels                   52               630          54               617       ▲2          ▲13
Bangkok                    53               629          48               626       ▼5          ▲3
Mauritius                  54               628          49               625       ▼5          ▲3
Stockholm                  55               627          58               611       ▲3          ▲16
Cape Town                  56               626          38               651       ▼18         ▼25
Kuwait City                57               625         New               New       New         New
Calgary                    58               621          42               635       ▼16         ▼14
Istanbul                   59               620          68               590       ▲9          ▲30
Lisbon                     60               619          70               585       ▲10         ▲34
Mexico City                61               616          62               598       ▲1          ▲18
Prague                     62               614          74               581       ▲12         ▲33
Glasgow                    63               613          50               622       ▼13         ▼9
Oslo                       64               612          64               596        0          ▲16
Rio de Janeiro             65               611          65               594        0          ▲17
Sao Paulo                  66               609          55               616       ▼11         ▼7
Bahrain                    67               608          59               607       ▼8          ▲1
Jakarta                    68               607          76               579       ▲8          ▲28
GIFT City-Gujarat          69               606          77               578       ▲8          ▲28
Warsaw                     70               605          66               592       ▼4          ▲13
Budapest                   71               603          71               584        0          ▲19
British Virgin Islands     72               602          63               597       ▼9          ▲5
St Petersburg              73               601          80               575       ▲7          ▲26
Helsinki                   74               599          94               556       ▲20         ▲43
Guernsey                   75               598          60               603       ▼15         ▼5
Copenhagen                 76               597          81               573       ▲5          ▲24
Liechtenstein              77               596          73               582       ▼4          ▲14
Riga                       78               595          87               565       ▲9          ▲30
Sofia                      79               593          97               544       ▲18         ▲49
Gibraltar                  80               591          75               580       ▼5          ▲11
Tianjin                    81               589          78               577       ▼3          ▲12
Panama                     82               588          90               562       ▲8          ▲26
Reykjavik                  83               587          84               570       ▲1          ▲17
Isle of Man                84               586          85               568       ▲1          ▲18
Bahamas                    85               585          67               591       ▼18         ▼6
Rome                       86               584          72               583       ▼14         ▲1
Chengdu                    87               583          79               576       ▼8          ▲7
Moscow                     88               582          83               571       ▼5          ▲11
Malta                      89               581          88               564       ▼1          ▲17
Buenos Aires               90               580          93               557       ▲3          ▲23
Riyadh                     91               575          69               588       ▼22         ▼13
Mumbai                     92               573          92               558        0          ▲15
Cyprus                     93               572          91               560       ▼2          ▲12
Tallinn                    94               569          52               620       ▼42         ▼51
Baku                       95               567          95               555        0          ▲12
New Delhi                  96               565          82               572       ▼14         ▼7
Nairobi                    97               564         New               New       New         New
Manila                      98              562         86                566       ▼12         ▼4
Hangzhou                    99              561         89                563       ▼10         ▼2
Almaty                     100              560         96                550       ▼4          ▲10
Dalian                     101              520         100               499       ▼1          ▲21
Athens                     102              519         98                518       ▼4          ▲1
6 | The Global Financial Centres Index 25

We track centres which are included in the GFCI questionnaire, but have yet to achieve
the number of assessments required to be listed in the main GFCI index. Table 2 lists
the ten centres which fall into this category of ‘associate centres’.
Table 2 | GFCI 25 Associate Centres

                                                  Number of Assessments
                  Centre                                                          Mean of Assessments
                                                   in the last 24 months

Barbados                                                   82                                507
Karachi                                                    75                                532
Tehran                                                     75                                484
San Diego                                                  70                                607
Andorra                                                    61                                490
Bratislava                                                 57                                553
Santiago                                                   50                                540
Trinidad & Tobago                                          43                                460
Vilnius                                                    14                                557
Lugano                                                     13                                454

Regional Performance
The mean of the top five Asia/Pacific centres is higher than in other regions. North
America is still just ahead of Western Europe. The top centres in other regions have
improved over time and narrowed the gap with the leading regions.

Chart 1 | Average Ratings Of The Top Five Centres In Each Region

825

775

725

675

625

575

                                                                           Asia/Pacific
525
                                                                           Western Europe
475                                                                        North America
                                                                           Middle East And Africa
425                                                                        Latin America And The Caribbean
                                                                           Eastern Europe And Central Asia
375
The Global Financial Centres Index 25 | 7

The Top Five Centres
New York remains in first place in GFCI 25 and has increased its lead over London to
seven points. Hong Kong, Singapore, and Shanghai have all continued to close the gap
on the leaders, with Hong Kong now only four points behind London. When we started
tracking financial centres, Shanghai was 193 points behind the leader. It is now just 17
points behind.

Chart 2 | The Top Five Centres— GFCI Ratings Over Time
 870

 820

 770

 720

 670

                                                                                              New York
 620
                                                                                              London
                                                                                              Hong Kong
 570
                                                                                              Singapore
                                                                                              Shanghai
 520

               “The top Asian centres, are to my mind,
                  leading the way at the moment.”
   INVESTMENT BANKER BASED IN STUTTGART
8 | The Global Financial Centres Index 25

Future Prospects

The GFCI questionnaire asks respondents which centres they consider will become
more significant over the next two to three years. Table 3 shows the top 15 centres
mentioned. Seven of the top 15 centres are in the Asia/Pacific region.

Table 3 | The 15 Centres Likely To Become More Significant

                    Centre                              Mentions in last 24 months

   Shanghai                                                        188
   Qingdao                                                         109
   Frankfurt                                                       57
   Singapore                                                       51
   GIFT City                                                       61
   Chengdu                                                         36
   Hong Kong                                                       31
   Paris                                                           30
   Casablanca                                                      30
   Dublin                                                          29
   Stuttgart                                                       28
   Shenzhen                                                        24
   Beijing                                                         23
   London                                                          22
   Astana                                                          20

   “Frankfurt and Dublin seem ideally placed to take
  business away from London in the next two years.”
COMMERCIAL BASED IN PARIS
The Global Financial Centres Index 25 | 9
Areas Of Competitiveness
The instrumental factors used in the GFCI model are grouped into five broad areas of
competitiveness: Business Environment, Human Capital, Infrastructure, Financial Sector
Development, and Reputation. These areas and the instrumental factor groups which
comprise each area are shown in chart 3.
Chart 3 | GFCI Areas Of Competitiveness
Areas of
Competitiveness
Business Financial Sector
Human Capital Infrastructure Reputation
Environment Development
Depth and
Political Stability Availability of Built City Brand
Breadth of
and Rule of Law Skilled Personnel Infrastructure and Appeal
Industry Clusters
Institutional and
Flexible Labour ICT Availability of Level of
Regulatory
Market Infrastructure Capital Innovation
Environment
Attractiveness
Macroeconomic Education and Transport Market
and Cultural
Environment Development Infrastructure Liquidity
Diversity
Comparative
Tax and Cost Quality Sustainable Economic
Positioning with
Competitiveness of Life Development Output
Other Centres10 | The Global Financial Centres Index 25
To assess how financial centres perform in each of these areas, the GFCI factor
assessment model is run separately for each of the five areas of competitiveness at a
time. The top 15 ranked centres in each of these sub-indices are shown in table 4. The
top financial centres of the world are well developed and strong in most areas. The top
four financial centres overall hold the top four positions in all five of the sub-indices.
Table 4 | GFCI 25 Top 15 By Area Of Competitiveness
Business Financial Sector Reputational
Rank Human Capital Infrastructure
Environment Development & General
1 London Hong Kong Hong Kong New York New York
2 New York New York London London London
3 Singapore London New York Hong Kong Hong Kong
4 Hong Kong Singapore Singapore Singapore Singapore
5 Shanghai Shanghai Shanghai Tokyo Shanghai
6 Zurich Tokyo Tokyo Shanghai San Francisco
7 Chicago San Francisco Melbourne Frankfurt Chicago
8 Frankfurt Chicago Beijing San Francisco Boston
9 Tokyo Frankfurt Sydney Toronto Tokyo
10 Toronto Dubai San Francisco Zurich Dubai
11 San Francisco Los Angeles Dubai Sydney Zurich
12 Dubai Toronto Boston Boston Toronto
13 Geneva Boston Tel Aviv Chicago Sydney
14 Boston Paris Los Angeles Paris Los Angeles
15 Sydney Beijing Zurich Dubai BeijingThe Global Financial Centres Index 25 | 11
Factors affecting Competitiveness
The GFCI questionnaire asks respondents to indicate which factors of competitiveness
they consider the most important at this time. The number of times that each area was
mentioned and the key issues raised by respondents are shown in table 5.
Table 5 | GFCI 24 Main Areas Of Competitiveness
Number of
Area of Competitiveness Main Issues
Mentions
The regulatory environment is still the most important factor
Business Environment 555 Levels of corruption seem to be getting worse
The rule of law must be enforced
The importance of attracting talent is increasing
Human Capital 522 The free movement of skilled people is crucial (will Brexit impede this in Europe?)
Reduced human rights and freedom are harming some centres
Improved air connectivity is now the top priority for some centres
Infrastructure 480 Centres are becoming more aware of creating 'ecosystems'
ICT Infrastructure is noiw taken for granted in the leading centres
Increased competition means that more intense marketing is vital
Reputation 478 Reputation for a good quality of life remains important
A good reputation takes a long time to build
Financial Institutions looking at relocation decisions, especially in London
Financial Sector Development 428 Having a critical mass of international organisaions remains important
Being able to meet clients face-to-face increases business
“We have reluctantly decided to move to mainland
Europe. We cannot wait until the Brexit
debacle is sorted out”
FUND MANAGER BASED IN LONDON12 | The Global Financial Centres Index 25
The Rule Of Law And Corruption
In developing our research into financial centres, we have found that the level of
corruption and the rule of law are significant factors in a financial centre’s
competitiveness. Chart 4 plots GFCI ratings against the Corruption Perceptions Index
and Chart 5 plots GFCI rating against the Rule Of Law. These charts demonstrate the
correlation of these factors with the GFCI 25 ratings (the size of the bubble indicates
the relative GDP of each centre).
Chart 4 | GFCI 25 Rating Against Corruption Perceptions (Supplied by Transparency International)
New York London
Hong Kong
Singapore
GFCI 25 Rating
Asia/Pacific
Eastern Europe & Central Asia
North America
Latin America & the Caribbean
Middle East & Africa
Lower Perceptions Of Corruption Western Europe
Chart 5 | GFCI 25 Rating Against the Rule Of Law (Supplied by the World Bank)
New York London
Hong Kong Singapore
GFCI 25 Rating
Asia/Pacific
Eastern Europe & Central Asia
North America
Latin America & the Caribbean
Middle East & Africa
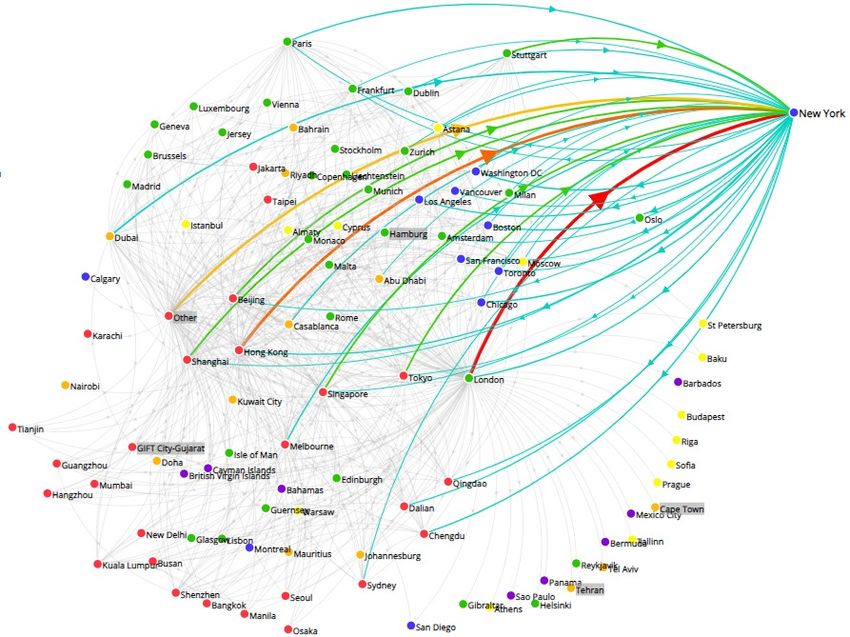
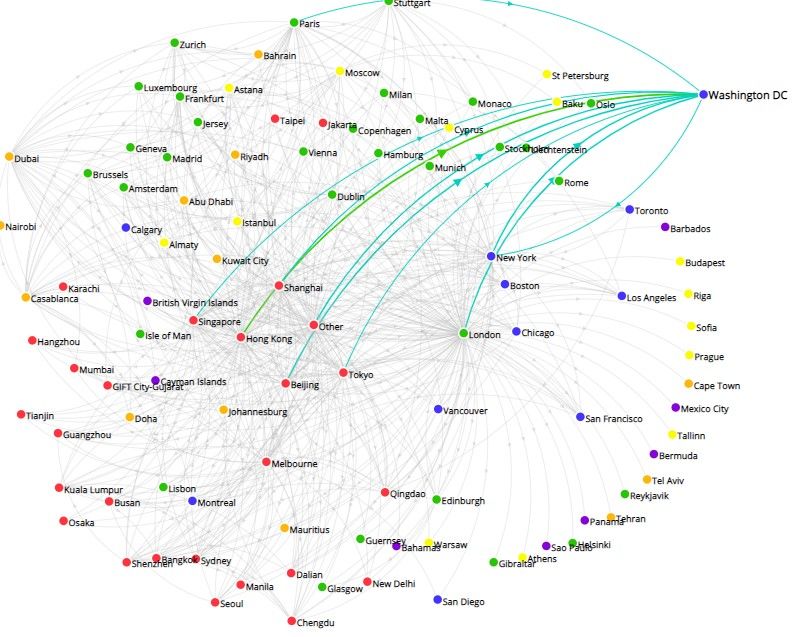
Increased Rule Of Law Western EuropeThe Global Financial Centres Index 25 | 13 Connectivity Financial centres thrive when they develop deep connections with other centres. The GFCI allows us to measure connectivity by investigating the number of assessments given to and received from other financial centres. Charts 6 and 7 show the different levels of connectivity enjoyed by New York and Washington DC to demonstrate the contrast. Chart 6 | GFCI 25 Connectivity — New York Chart 7 | GFCI 25 Connectivity — Washington DC
14 | The Global Financial Centres Index 25

Financial Centre Profiles
                                                     Chart 8 | GFCI 25 Profile Elements
Using clustering and correlation analysis we
have identified three measures (axes) that
determine a financial centre’s profile along
different dimensions of competitiveness.
‘Connectivity’ – the extent to which a
centre is well connected around the world,
based on the number of assessments given
by and received by that centre from
professionals based in other centres.
A centre’s connectivity is assessed using a combination of ‘inbound’ assessment
locations (the number of locations from which a particular centre receives
assessments) and ‘outbound’ assessment locations (the number of other centres
assessed by respondents from a particular centre). If the weighted assessments for a
centre are provided by over 55 per cent of other centres, this centre is deemed to be
‘Global’. If the ratings are provided by over 40 per cent of other centres, this centre is
deemed to be ‘International’.
 ‘Diversity’– the instrumental factors used in the GFCI model give an indication of a
range of factors that influence the richness and evenness of areas of competitiveness
that characterise any particular financial centre. We consider this span of factors to be
measurable in a similar way to that of the natural environment. We therefore use a
combination of biodiversity indices (calculated on the instrumental factors) to assess a
centre’s diversity taking account of the range of factors against which the centre has
been assessed – the ‘richness’ of the centre’s business environment; and the
‘evenness’ of the distribution of that centre’s scores. A high score means that a centre
is well diversified; a low diversity score reflects a less rich business environment.
 ‘Speciality’ – the depth within a financial centre of the following industry sectors:
investment management, banking, insurance, professional services, and the
government and regulatory sector. A centre’s ‘speciality’ performance is calculated
from the difference between the GFCI rating and the industry sector ratings.
In table 6 ‘Diversity’ (Breadth) and ‘Speciality’ (Depth) are combined on one axis to
create a two dimensional table of financial centre profiles. The 102 centres in GFCI 25
are assigned a profile on the basis of a set of rules for the three measures: how well
connected a centre is, how broad its services are, and how specialised it is.
The 14 Global Leaders (in the top left of the table) have both broad and deep financial
services activities and are connected with many other financial centres. This list
includes 11 of the top 12 global financial centres in GFCI 25.
Significant changes in GFCI 25 include Chicago and Los Angles becoming Global Leaders
and Luxembourg, Qingdao and Washington DC becoming Global Specialists. An asterix
by a centre’s name in Table 6 indicates a movement from their profile in GFCI 24.
The Global Financial Centres Index 25 | 15
Table 6 | GFCI 25 Financial Centre Profiles
Broad & Deep Relatively Broad Relatively Deep Emerging
Global Leaders Global Diversified Global Specialists Global Contenders
Abu Dhabi Ams terdam As tana Chengdu*
Beijing Brus s els Luxembourg* Mos cow*
Chicago* Dublin Qingdao*
Dubai Frankfurt Shenzhen
Hong Kong Milan Was hington DC*
London Paris *
Los Angeles * San Francis co
Global
New York
Shanghai
Singapore
Sydney
Tokyo
Toronto
Zurich
Established International International International
International Diversified Specialists Contenders
Bos ton Athens * Almaty Britis h Virgin Is lands *
Calgary Bangkok* Bermuda Buenos Aires *
Geneva Copenhagen Bus an* Dalian
Hamburg* Edinburgh Cas ablanca Doha*
International Kuala Lumpur Is tanbul* Cayman Is lands Hangzhou*
Madrid* Johannes burg GIFT City-Gujarat* Jakarta*
Melbourne Rome* Guangzhou Malta*
Montreal Stockholm Guerns ey New Delhi*
Munich* Vienna* Jers ey
Seoul* Rio de Janeiro*
Stuttgart (New) Taipei
Vancouver
Established Players Local Diversified Local Specialists Evolving Centres
Budapes t Glas gow* Bahamas Bahrain
Mexico City Hels inki Baku* Cyprus
Os aka Lis bon Cape Town Gilbraltar*
Prague Os lo Is le of Man Manila*
Wellington Tel Aviv* Kuwait City (New) Mauritius *
Local
Wars aw* Liechtens tein Mumbai*
Monaco Nairobi(New)
Panama Reykjavik
Riga* Riyadh
Sao Paulo* Tallinn*
Sofia Tianjin
St Peters burg16 | The Global Financial Centres Index 25
The GFCI 25 World
83
58
18 See Detailed
19
7
Map Below
13
16
20 1
17
32
25 22
85
61
21 72
82
65
66
56
90
The numbers on the map indicate the GFCI 25 rankings. Black dots denote Associate Centres:
Broad and Deep Relatively Broad Relatively Deep Emerging
Global Leaders Global Diversified Global Specialists Global Contenders
Established International International Diversified International Specialists International Contenders
Established Players Local Diversified Local Specialists Evolving CentresThe Global Financial Centres Index 25 | 17
81
88
59 70 100 36
9 81
6
23 101 46
93 29
87 31
57 5
67 24 99
42 12 14 34
96
26 69
91 3
53 68
92
39
4
57
98
54
48
11
15
40
74
73
64
55 94
76 78
63 35
84 41 50
38 2 66
51
10
47
75 30 49 62
27 43
71
44
8
77
28 45
33 79
37 86
60 102
80
8918 | The Global Financial Centres Index 25
Regional Analysis
In our analysis of the GFCI data, we look at six regions of the world to explore the
competitiveness of their financial centres.
Alongside the ranks and ratings of centres, we look at trends in the leading centres in
each region; and investigate the average assessments received by regions and centres in
more detail.
We display this analysis in charts which show:
• the mean assessment provided to that region or centre;
• the difference in the mean assessment when home region assessments are
removed from the analysis;
• the difference between the mean and the assessments provided by other regions;
• the proportion of assessments provided by each region.
Charts 9 and 10 show examples of these analyses. Coloured bars to the left of the
vertical axis indicate that respondents from that region gave lower than the average
assessments. Bars to the right indicate respondents from that region gave higher than
average assessments. It is important to recognise that assessments given to a centre by
people based in that centre are excluded to remove ‘home’ bias.
The additional vertical axis (in red) shows the mean of assessments when assessments
from the home region are removed. The percentage figure noted by each region
indicates the percentage of the total number of assessments that are from that region.
“We are currently being hampered by a needless
trade war. There are too many politicians who think
they understand business and economics.”
HEAD OF EXCHANGE BASED IN ISTANBULThe Global Financial Centres Index 25 | 19
Chart 9 | Example 1: Assessments Compared With The Mean For Region 6
This line shows that the assessments
given by other regions and excluding
those from region 6 had an average 10
points lower than the overall mean.
Respondents from region 6 rated their
home centres higher than
respondents from other regions.
This percentage shows
This bar shows that that 32 per cent of
assessments from assessments for region
centres in this region 6 came from centres in
Region 1 (32%)
averaged 41 points region 1.
below the mean for Region 2 (24%)
region 6.
Region 3 (7%)
Region 4 (5%)
Region 5 (9%) This bar shows that
assessments from centres in
Region 6 (15%) this region averaged 72
points above the mean for
Multi-Regional (8%) region 6.
-125 -75 -25 623 25 75 125
This figure is the mean of all
assessments in the GFCI for
region 6.
Chart 10 | Example 2: Assessments Compared With The Mean For An Individual Centre20 | The Global Financial Centres Index 25
Western Europe
This region did well after a mixed performance in GFCI 24. Thirteen of the top 15
Western European centres rose in the ratings with particularly strong performances by
Monaco, Madrid and Edinburgh. Only Luxembourg and Amsterdam saw modest
declines.
The centres that are most likely to benefit from Brexit did well with Zurich, Frankfurt,
Paris, and Dublin, all gaining ground. Amsterdam was the only centre in Western
Europe that dropped more than ten points in the ratings.
Table 7 | Western European Top 20 Centres In GFCI 25
GFCI 25 GFCI 24 Change in Change in
Centre
Rank Rating Rank Rating Rank Rating
London 2 787 2 786 0 ▲1
Zurich 8 739 9 732 ▲1 ▲7
Frankfurt 10 737 10 730 0 ▲7
Paris 27 699 23 691 ▼4 ▲8
Geneva 28 698 27 685 ▼1 ▲13
Luxembourg 30 691 21 694 ▼9 ▼3
Monaco 33 686 46 629 ▲13 ▲57
Edinburgh 35 674 43 634 ▲8 ▲40
Madrid 37 667 53 619 ▲16 ▲48
Dublin 38 658 37 652 ▼1 ▲6
Amsterdam 41 646 35 657 ▼6 ▼11
Munich 43 641 39 639 ▼4 ▲2
Vienna 44 640 51 621 ▲7 ▲19
Milan 45 638 56 613 ▲11 ▲25
Jersey 47 635 47 628 0 ▲7
Stuttgart 49 633 New New New New
Hamburg 50 632 41 636 ▼9 ▼4
Brussels 52 630 54 617 ▲2 ▲13
Stockholm 55 627 58 611 ▲3 ▲16
Lisbon 60 619 70 585 ▲10 ▲34
Chart 11 | Top Five Western European Centres Over Time
850
800
750
700
London
650 Zurich
Frankfurt
Paris
Geneva
600The Global Financial Centres Index 25 | 21
Chart 12| Average Assessments By Region For Western Europe – Difference From The Overall Mean
Western Europe (45%)
Asia/Pacific (24%)
North America (6%)
Eastern Europe & Central Asia (5%)
Middle East & Africa (10%)
Latin America & the Caribbean (2%)
Multi-Regional (8%)
-150 -100 -50 0
681 50 100 150
Chart 13 | Assessments By Region For London — Difference From The Overall Mean
Wes tern Europe (27%)
As i a/Pacific (37%)
North Ameri ca (8%)
Ea s tern Europe & Central As ia (6%)
Mi ddle East & Afri ca (11%)
La tin America & the Caribbean (2%)
Mul ti -Regional (9%)
-150 -100 -50 0
858 50 100 150
Chart 14 | Assessments By Region For Zurich — Difference From The Overall Mean
Wes tern Europe (45%)
As i a/Pacific (25%)
North Ameri ca (6%)
Ea s tern Europe & Central As ia (5%)
Mi ddle East & Afri ca (9%)
La ti n America & the Caribbean (2%)
Mul ti -Regional (8%)
-150 -100 -50 0
786 50 100 150
Chart 15 | Assessments By Region For Frankfurt — Difference From The Overall Mean
Wes tern Europe (48%)
As i a/Pacific (26%)
North Ameri ca (6%)
Ea s tern Europe & Central As ia (5%)
Mi ddle East & Afri ca (7%)
La ti n America & the Caribbean (2%)
Mul ti -Regional (7%)
-150 -100 -50 0
771 50 100 15022 | The Global Financial Centres Index 25
Asia/Pacific
Most Asia/Pacific Centres performed well. Of the top twenty centres in the region,
only Osaka saw a modest decline with the others rising or remaining as they were in
GCI 24.
There has been a strong trend of Asia/Pacific centres improving over several years.
The top eight centres in the region are now in the top fifteen centres in the whole
index. Melbourne, Jakarta, and GIFT City (Gujarat) all showed strong increases in
GFCI 25.
Table 8 | Asia/Pacific Top 20 Centres In GFCI 25
GFCI 25 GFCI 24 Change in Change in
Centre
Rank Rating Rank Rating Rank Rating
Hong Kong 3 783 3 783 0 0
Singapore 4 772 4 769 0 ▲3
Shanghai 5 770 5 766 0 ▲4
Tokyo 6 756 6 746 0 ▲10
Beijing 9 738 8 733 ▼1 ▲5
Sydney 11 736 7 734 ▼4 ▲2
Shenzhen 14 730 12 726 ▼2 ▲4
Melbourne 15 729 20 699 ▲5 ▲30
Guangzhou 24 708 19 708 ▼5 0
Qingdao 29 694 31 679 ▲2 ▲15
Osaka 31 690 22 693 ▼9 ▼3
Taipei 34 676 32 670 ▼2 ▲6
Seoul 36 668 33 668 ▼3 0
Kuala Lumpur 39 652 40 638 ▲1 ▲14
Wellington 40 647 45 630 ▲5 ▲17
Busan 46 636 44 631 ▼2 ▲5
Bangkok 53 629 48 626 ▼5 ▲3
Jakarta 68 607 76 579 ▲8 ▲28
GIFT City-Gujarat 69 606 77 578 ▲8 ▲28
Tianjin 81 589 78 577 ▼3 ▲12
Chart 16 | Top Five Asia/Pacific Centres Over Time
800
750
700
650
600
Hong Kong
Singapore
550
Shanghai
500 Tokyo
Beijing
450The Global Financial Centres Index 25 | 23
Chart 17 | GFCI 24 Average Assessments By Region For Asia/Pacific – Difference From The Overall Mean
Western Europe (18%)
Asia/Pacific (60%)
North America (6%)
Eastern Europe & Central Asia (3%)
Middle East & Africa (5%)
Latin America & the Caribbean (1%)
Multi-Regional (7%)
-150 -100 -50 0
677 50 100 150
Chart 18 | Assessments By Region For Hong Kong — Difference From The Overall Mean
Wes tern Europe (27%)
As i a/Pacific (47%)
North Ameri ca (8%)
Ea s tern Europe & Central As ia (4%)
Mi ddle East & Afri ca (6%)
La ti n America & the Caribbean (2%)
Mul ti -Regional (7%)
-150 -100 -50 0
844
846 50 100 150
Chart 19 | Assessments By Region For Singapore — Difference From The Overall Mean
Wes tern Europe (31%)
As i a/Pacific (40%)
North Ameri ca (7%)
Ea s tern Europe & Central As ia (6%)
Mi ddle East & Afri ca (8%)
La ti n America & the Caribbean (1%)
Mul ti -Regional (6%)
-150 -100 -50 0
867 50 100 150
Chart 20 | Assessments By Region For Shanghai — Difference From The Overall Mean
Wes tern Europe (13%)
As i a/Pacific (69%)
North Ameri ca (5%)
Ea s tern Europe & Central As ia (2%)
Mi ddle East & Afri ca (4%)
La ti n America & the Caribbean (1%)
Mul ti -Regional (6%)
-150 -100 -50 0
838 50 100 15024 | The Global Financial Centres Index 25
North America
North American centres also did well in GFCI 25 with most centres rising in the
ratings. Of particular note is the performance of Toronto, Montreal and Vancouver
the three leading Canadian centres. All three showed strong increases in the ratings.
Toronto rose four places to seventh overall and Montreal is now in 18th place.
Washington DC regained the ground that it lost in GFCI 24 with a rise of 34 points.
This rise resulted in it climbing four places to 32nd overall.
Table 9 | North American Centres In GFCI 25
GFCI 25 GFCI 24 Change in Change in
Centre
Rank Rating Rank Rating Rank Rating
New York 1 794 1 788 0 ▲6
Toronto 7 755 11 728 ▲4 ▲27
Boston 13 732 13 725 0 ▲7
San Francisco 16 727 14 724 ▼2 ▲3
Los Angeles 17 724 16 721 ▼1 ▲3
Montreal 18 722 24 690 ▲6 ▲32
Vancouver 19 721 18 709 ▼1 ▲12
Chicago 20 717 17 717 ▼3 0
Washington DC 32 689 36 655 ▲4 ▲34
Calgary 58 621 42 635 ▼16 ▼14
Chart 21 | Top Five North American Centres Over Time
850
800
750
700
650
New York
Toronto
600 Boston
San Francisco
Los Angeles
550The Global Financial Centres Index 25 | 25
Chart 22 | Average Assessments By Region For North America – Difference From The Overall Mean
Western Europe (27%)
Asia/Pacific (38%)
North America (14%)
Eastern Europe & Central Asia (3%)
Middle East & Africa (8%)
Latin America & the Caribbean (2%)
Multi-Regional (8%)
-150 -100 -50 0
779 50 100 150
Chart 23 | Assessments By Region For New York — Difference From The Overall Mean
Wes tern Europe (32%)
As i a/Pacific (38%)
North Ameri ca (7%)
Ea s tern Europe & Central As ia (4%)
Mi ddle East & Afri ca (9%)
La ti n America & the Caribbean (2%)
Mul ti -Regional (7%)
-150 -100 -50 0
867 50 100 150
Chart 24 | Assessments By Region for Toronto — Difference From The Overall Mean
Wes tern Europe (29%)
As i a/Pacific (37%)
North Ameri ca (12%)
Ea s tern Europe & Central As ia (2%)
Mi ddle East & Afri ca (9%)
La tin America & the Caribbean (3%)
Mul ti -Regional (8%)
-150 -100 -50 0
768 50 100 150
Chart 25 | Assessments By Region For Boston — Difference From The Overall Mean
Wes tern Europe (32%)
As i a/Pacific (34%)
North Ameri ca (16%)
Ea s tern Europe & Central As ia (3%)
Mi ddle East & Afri ca (7%)
La ti n America & the Caribbean (2%)
Mul ti-Regional (7%)
-150 -100 -50 7510 50 100 15026 | The Global Financial Centres Index 25
Eastern Europe And Central Asia
In this region there were significant gains for Astana, Istanbul and Prague. Astana only
officially launched its financial centre in 2018, and it is unusual for such a new centre to
perform so strongly.
Tallinn made a lot of ground in GFCI 24 but fell back this time despite a growing
reputation as a strong FinTech centre.
Table 10 | Eastern European And Central Asian Centres In GFCI 25
GFCI 25 GFCI 24 Change in Change in
Centre
Rank Rating Rank Rating Rank Rating
Astana 51 631 61 599 ▲10 ▲32
Istanbul 59 620 68 590 ▲9 ▲30
Prague 62 614 74 581 ▲12 ▲33
Warsaw 70 605 66 592 ▼4 ▲13
Budapest 71 603 71 584 0 ▲19
St Petersburg 73 601 80 575 ▲7 ▲26
Riga 78 595 87 565 ▲9 ▲30
Sofia 79 593 97 544 ▲18 ▲49
Moscow 88 582 83 571 ▼5 ▲11
Cyprus 93 572 91 560 ▼2 ▲12
Tallinn 94 569 52 620 ▼42 ▼51
Baku 95 567 95 555 0 ▲12
Almaty 100 560 96 550 ▼4 ▲10
Athens 102 519 98 518 ▼4 ▲1
Chart 26 | GFCI 25 Top Five Eastern European And Central Asian Centres Over Time
700
650
600
550
500
450
Astana
400 Istanbul
Prague
350 Warsaw
Budapest
300The Global Financial Centres Index 25 | 27
Chart 27 | Average Assessments By Region For Eastern Europe And Central Asia — Difference From The
Overall Mean
Western Europe (34%)
Asia/Pacific (23%)
North America (8%)
Eastern Europe & Central Asia (15%)
Middle East & Africa (9%)
Latin America & the Caribbean (3%)
Multi-Regional (8%)
-238
-150 -100 -50 0
571 50 100 150
Chart 28 | Assessments By Region For Astana — Difference From The Overall Mean
Wes tern Europe (31%)
As i a/Pacific (29%)
North Ameri ca (9%)
Ea s tern Europe & Central As ia (12%)
Mi ddle East & Afri ca (9%)
La ti n America & the Caribbean (1%)
Mul ti-Regional (8%)
-150 -100 -50 0
619 50 100 150
Chart 29 | Assessments By Region For Istanbul — Difference From The Overall Mean
Wes tern Europe (37%)
As i a/Pacific (19%)
North Ameri ca (6%)
Ea s tern Europe & Central As ia (16%)
Mi ddle East & Afri ca (16%)
La ti n America & the Caribbean (2%)
Mul ti -Regional (4%)
-150 -100 -50 0
585 50 100 150
Chart 30 | Assessments By Region For Prague — Difference From The Overall Mean
Wes tern Europe (44%)
As i a/Pacific (20%)
North Ameri ca (8%)
Ea s tern Europe & Central As ia (10%)
Mi ddle East & Afri ca (8%)
La ti n America & the Caribbean (4%)
Mul ti -Regional (6%)
-150 -100 -50 0
610 50 100 15028 | The Global Financial Centres Index 25
The Middle East And Africa
In this region Dubai, Casablanca, and Abu Dhabi continued to rise in the index. Doha
lost some of the ground it made in GFCI 24. Kuwait City and Nairobi were new entrants
to the index, with Kuwait ranking 57th in its first entry. Respondents from centres in the
Middle East and Africa scored other regional centres lower than the mean, as did
respondents from Western Europe and Latin America & the Caribbean.
Table 11 | Middle East And African Centres In GFCI 25
GFCI 25 GFCI 24 Change in Change in
Centre
Rank Rating Rank Rating Rank Rating
Dubai 12 733 15 722 ▲3 ▲11
Casablanca 22 712 28 684 ▲6 ▲28
Tel Aviv 23 710 25 689 ▲2 ▲21
Abu Dhabi 26 702 26 686 0 ▲16
Doha 42 642 34 662 ▼8 ▼20
Johannesburg 48 634 57 612 ▲9 ▲22
Mauritius 54 628 49 625 ▼5 ▲3
Cape Town 56 626 38 651 ▼18 ▼25
Kuwait City 57 625 New New New New
Bahrain 67 608 59 607 ▼8 ▲1
Riyadh 91 575 69 588 ▼22 ▼13
Nairobi 97 564 New New New New
Chart 31 | GFCI 25 Top Five Middle East And African Centres Over Time
750
700
650
600
550
500
Dubai
Casablanca
450 Tel Aviv
Abu Dhabi
Doha
400The Global Financial Centres Index 25 | 29
Chart 32 | Average Assessments By Region For The Middle East And Africa — Difference From The
Overall Mean
Western Europe (34%)
Asia/Pacific (23%)
North America (6%)
Eastern Europe & Central Asia (6%)
Middle East & Africa (20%)
Latin America & the Caribbean (2%)
Multi-Regional (9%)
-150 -100 -50 0
655 50 100 150
Chart 33 | Assessments By Region For Dubai — Difference From The Overall Mean
Wes tern Europe (36%)
As i a/Pacific (28%)
North Ameri ca (5%)
Ea s tern Europe & Central As ia (8%)
Mi ddle East & Afri ca (13%)
La ti n America & the Caribbean (1%)
Mul ti -Regional (9%)
-150 -100 -50 0
735 50 100 150
Chart 34 | Assessments By Region For Casablanca — Difference From The Overall Mean
Wes tern Europe (42%)
As i a/Pacific (20%)
North Ameri ca (6%)
Ea s tern Europe & Central As ia (3%)
Mi ddle East & Afri ca (17%)
La ti n America & the Caribbean (1%)
Mul ti -Regional (12%)
-150 -100 -50 0
697 50 100 150
Chart 35 | Assessments By Region For Tel Aviv — Difference From The Overall Mean
Wes tern Europe (50%)
As i a/Pacific (12%)
North Ameri ca (11%)
Ea s tern Europe & Central As ia (6%)
Mi ddle East & Afri ca (10%)
La tin America & the Caribbean (3%)
Mul ti -Regional (7%)
-150 -100 -50 0
671 50 100 15030 | The Global Financial Centres Index 25
Latin America And The Caribbean
There were mixed results in the region with five centres rising in the ranks and three
declining. The Cayman Islands, Panama, and Bermuda performed strongly.
Table 12 | Latin American And Caribbean Centres In GFCI 25
GFCI 25 GFCI 24 Change in Change in
Centre
Rank Rating Rank Rating Rank Rating
Cayman Islands 21 713 29 683 ▲8 ▲30
Bermuda 25 705 30 680 ▲5 ▲25
Mexico City 61 616 62 598 ▲1 ▲18
Rio de Janeiro 65 611 65 594 0 ▲17
Sao Paulo 66 609 55 616 ▼11 ▼7
British Virgin Islands 72 602 63 597 ▼9 ▲5
Panama 82 588 90 562 ▲8 ▲26
Bahamas 85 585 67 591 ▼18 ▼6
Buenos Aires 90 580 93 557 ▲3 ▲23
Chart 36 | Top Five Latin American And Caribbean Centres Over Time
770
720
670
620
570
Cayman Islands
520 Bermuda
Mexico City
470
Rio de Janeiro
Sao Paulo
420The Global Financial Centres Index 25 | 31
Chart 37 | Average Assessments By Region For Latin America And The Caribbean – Difference From The
Overall Mean
Western Europe (34%)
Asia/Pacific (20%)
North America (9%)
Eastern Europe & Central Asia (6%)
Middle East & Africa (13%)
Latin America & the Caribbean (11%)
Multi-Regional (8%)
-150 -100 -50 0
594 50 100 150
Chart 38 | Assessments By Region For The Cayman Islands — Difference From The Overall Mean
Wes tern Europe (37%)
As i a/Pacific (18%)
North Ameri ca (10%)
Ea s tern Europe & Central As ia (3%)
Mi ddle East & Afri ca (15%)
La ti n America & the Caribbean (8%)
Mul ti-Regional (8%)
-150 -100 -50 0
679 50 100 150
198
Chart 39 | Assessments By Region For Bermuda — Difference From The Overall Mean
Wes tern Europe (42%)
As i a/Pacific (9%)
North Ameri ca (10%)
Ea s tern Europe & Central As ia (4%)
Mi ddle East & Afri ca (17%)
La tin America & the Caribbean (10%)
Mul ti -Regional (8%)
-150 -100 -50 0
676 50 100 150
Chart 40 | Assessments By Region For Mexico City — Difference From The Overall Mean
Wes tern Europe (26%)
As i a/Pacific (36%)
North Ameri ca (9%)
Ea s tern Europe & Central As ia (5%)
Mi ddle East & Afri ca (11%)
La ti n America & the Caribbean (5%)
Mul ti -Regional (8%)
-150 -100 -50 0
588 50 100 15032 | The Global Financial Centres Index 25 Home Centre Prospects While the GFCI is calculated using only assessments from other centres, we ask respondents about the prospects of the centre in which they are based; and specifically whether their ‘home’ centre will become more or less competitive. In general, people are more optimistic about the future of their own centre than people outside that centre. However, respondents in London are less optimistic than those in other centres, reflecting the continuing uncertainty about future trading relations with the E.U. and the rest of the world after Brexit. Chart 41 | Home Centre Prospects — New York Chart 42 | Home Centre Prospects — London Chart 43 | Home Centre Prospects — Hong Kong Chart 44 | Home Centre Prospects — Singapore
The Global Financial Centres Index 25 | 33

                Stability
                        The GFCI model allows for an analysis of the volatility in financial centre competitiveness.
                        Chart 45 contrasts the ‘spread’ or variance of the individual assessments given to each of
                        the top 40 centres with the sensitivity to changes in the instrumental factors.

                        The chart shows three bands of financial centres. The unpredictable centres in the top
                        right of the chart have a higher sensitivity to changes in the instrumental factors and a
                        higher variance of assessments. These centres have the highest potential future
                        movement. The stable centres in the bottom left have a lower sensitivity to changes in
                        the instrumental factors and a lower variance of assessments.

                        We have only plotted the top 40 centres (for clarity) but it is worth noting that most of
                        the centres lower in the index would be in the dynamic and unpredictable areas of the
                        chart if plotted.

                    Chart 45 | Stability Of The Top 40 Centres In GFCI 25

                                       Dynamic                                                                    Unpredictable

                                                                                                       Monaco           Casablanca
                                                                          Cayman Islands              Seoul

                                                                                                              Bermuda

                                                                                                                                       Luxembourg
Increasing Variance Of Assessments

                                                              Abu Dhabi                                       Osaka

                                                                                                                                          Kuala Lumpur
                                                           Dublin                     Wellington
                                                                                                         Taipei              Edinburgh
                                                  Madrid            Geneva
                                                                                                                            Guangzhou
                                                  Dubai           Frankfurt
                                                                                                       Melbourne         Montreal
                                                      Paris
                                       Washington DC
                                             San Francisco      Chicago Sydney      Vancouver
                                      Boston     Zurich
                                         Los Angeles        Tokyo
                                                       Toronto                                        Beijing
                                          Shanghai                                         Shenzhen
                                     London                                   Hong Kong
                                                              New York

                                     Singapore                                                                               Qingdao
                                                 Stable

                                                                Increasing Sensitivity To Instrumental Factors
34 | The Global Financial Centres Index 25
We can also look at the stability of rankings in the index over time. Chart 46 shows the
standard deviation of index rankings against the variance in assessments over the last 24
months.
Chart 46 | Standard Deviation In Index Rankings And Assessments Over Time
Dynamic Unpredictable
Tel Aviv
Casablanca Monaco
Cayman Islands Seoul
Increasing Standard Deviation Of GFCI Ratings
Bermuda
Luxembourg
Osaka
Kuala Lumpur Abu Dhabi
Wellington
Geneva Taipei Dublin
Edinburgh
Montreal Dubai Guangzhou
Frankfurt Madrid
Melbourne Paris
San Francisco Washington DC
Vancouver
Zurich Sydney Los Angeles
Toronto Boston
Chicago
Tokyo Beijing
Shanghai
London Shenzhen
New York
Hong Kong
Singapore
Stable
Qingdao
Increasing Standard Deviation Of Assessments
“The entire finance industry is so full of uncertainty
at the moment. Some think that being in
Australia shields us, but Sydney and Melbourne
need international trade.”
INVESTMENT BANKER BASED IN SYDNEYThe Global Financial Centres Index 25 | 35
Reputation
We look at reputation in the GFCI model by examining the difference between the
weighted average assessment given to a financial centre and the overall rating in the
index.
The first measure reflects the average score a centre receives from financial
professionals across the world, adjusted for time, with more recent assessments given
more weight. (see Appendix 3 for details).
The second measure is the GFCI rating itself, which represents the assessments
adjusted to take account of the instrumental factors. If a centre has a higher average
assessment than its GFCI rating, this indicates that respondents’ perceptions of a centre
are more favourable than the quantitative measures alone suggest.
Table 13 shows the top 15 centres with the greatest positive difference between the
average assessment and the GFCI rating. Eight of the top 15 centres in terms of
reputational advantage are in the Asia/Pacific region. Washington DC, New York, and
London also show a strong reputational advantage. This may be due to strong marketing
or general awareness.
Table 13 | GFCI 25 Top 15 Centres Assessments And Ratings — Reputational Advantage
Weighted Average GFCI 25 GFCI 25 Reputational
Centre - Top 15
Assessment Rating Advantage
Qingdao 832 694 138
Singapore 867 772 95
Wellington 740 647 93
Washington DC 776 689 87
Shanghai 845 770 75
New York 866 794 72
London 856 787 69
Sydney 805 736 69
Hong Kong 847 783 64
Stuttgart 694 633 61
Tokyo 815 756 59
San Francisco 782 727 55
Zurich 788 739 49
Shenzhen 769 730 39
Frankfurt 772 737 3536 | The Global Financial Centres Index 25
Table 14 shows the 15 centres with the greatest reputational disadvantage. This
indicates that respondents’ perceptions of a centre are less favourable than the
quantitative measures alone would suggest.
Table 14 | GFCI 25 Bottom 15 Centres Assessments And Ratings — Reputational Disadvantage
Weighted Average GFCI 25 GFCI 25 Reputational
Centre - Bottom 15
Assessment Rating Advantage
Bahamas 546 585 -39
Cyprus 528 572 -44
Monaco 641 686 -45
Glasgow 564 613 -49
Jakarta 558 607 -49
Kuwait City 568 625 -57
Guangzhou 639 708 -69
GIFT City-Gujarat 533 606 -73
Nairobi 480 564 -84
Riga 509 595 -86
Sofia 495 593 -98
Tianjin 451 589 -138
Chengdu 426 583 -157
Busan 452 636 -184
Dalian 308 520 -212
“I am actually feeling quite positive about the future
of financial services in London. This game is all
about trust and London still has a fantastic
reputation.”
ASSET MANAGER BASED IN LONDONThe Global Financial Centres Index 25 | 37
Industry Sectors
We investigate the differing assessments provided by respondents working in relevant
industry sectors by building the index separately using the responses provided only
from those industries. This creates separate sub-indices for Banking, Investment
Management, Insurance, Professional Services and Government & Regulatory Sectors.
Table 15 shows the top 15 financial centres in these five industry sectors. London
remains in third place in Investment Management and has dropped from second to
third in Professional Services.
Table 15 | GFCI 25 Industry Sector Sub-Indices — Top Fifteen
Investment Professional Government &
Rank Banking Insurance
Management Services Regulatory
1 London New York New York New York London
2 Shanghai Hong Kong London Hong Kong New York
3 New York London Hong Kong London Hong Kong
4 Hong Kong Shanghai Singapore Singapore Singapore
5 Singapore Singapore Shanghai Shanghai San Francisco
5 Beijing Toronto Zurich Tokyo Zurich
7 Frankfurt Tokyo Tokyo Toronto Shanghai
8 Tokyo Beijing Frankfurt Sydney Sydney
9 Toronto Dubai Shenzhen Zurich Frankfurt
10 Dubai San Francisco San Francisco Dubai Tokyo
11 Zurich Zurich Sydney Los Angeles Seoul
12 San Francisco Cayman Islands Paris Boston Melbourne
13 Shenzhen Boston Beijing Frankfurt Dubai
14 Abu Dhabi Luxembourg Toronto San Francisco Toronto
15 Paris Frankfurt Geneva Cayman Islands Boston38 | The Global Financial Centres Index 25
Brexit
Since the United Kingdom voted to leave the Europe Union (Brexit) in June 2016, we have
asked respondents to the GFCI online questionnaire about their opinions on the effect that
Brexit will have on certain leading European financial centres. The results are shown in
table 16 below.
Table 16 | The Anticipated Effect Of Brexit On Certain European Financial Centres
Paris
Frankfurt Very Negative
Luxembourg
Moderately
Zurich Negative
Little Effect
Guernsey
Jersey Moderately
Positive
Dublin
Very Positive
Edinburgh
London
It is interesting, but perhaps unsurprising, that the two leading UK financial centres in the
United Kingdom (London and Edinburgh), are the two centres that respondents believe will
suffer the largest negative effects.
The centres that respondents believe will benefit the most from Brexit are Frankfurt,
followed by Paris, Luxembourg, Zurich, and Dublin. We will follow these numbers with
interest in the forthcoming months.
“Zurich is not in the European Union but a growing
number of banking friends think that
we are ideally placed to gain business
as a result of London losing out .”
INVESTMENT BANKER BASED IN ZURICHThe Global Financial Centres Index 25 | 39
FinTech
We have been asked by a number of finance professionals about the prospects of us
producing a comparable index to the GFCI but focusing on the financial centres that are the
most competitive locations for fostering a FinTech industry. We have not yet collected
sufficient data to produce a full report but the questionnaire responses to date give us a
few interesting clues:
Table 17 | The Leading FinTech Centres
Center Rating
London 843
New York 830
Singapore 830
Shanghai 799
San Francisco 791
Tokyo 768
Shenzhen 732
Frankfurt 707
Tel Aviv 692
Paris 680
Berlin 673
Sydney 667
Toronto 660
Amsterdam 651
Dublin 630
Respondents feel that the four most important elements to attract FinTech start-ups are (in
order) the regulatory environment, the availability of skilled people, access to finance and
ICT Infrastructure.
Respondents feel that the four most important areas of FinTech activity currently are (in
order) Big Data Analytics, Cyber Security, Payment Transaction Systems and Trading
Platforms.
We will continue to monitor responses to this areas of our online questionnaire with
interest. If you would like to participate please do so at: globalfinancialcentres.net/survey.40 | The Global Financial Centres Index 25
Size Of Organisation
We have analysed how the leading centres in the index are viewed by respondents
working for organisations of difference sizes. New York is favoured over London in
three of the size categories that we use. London has a strong lead in mid-sized organisa-
tions (500 to 1,000 employees) but remains behind New York in terms of the largest or-
ganisations. Singapore scores consistently high across all categories.
Chart 47 | GFCI 25 Average Assessments By Respondents’ Organisation Size (Number Of
Employees)
920
900
880
860
840
820
New York
800
London
780
Hong Kong
760
Singapore
740
Shanghai
720
Fewer than 100 100 to 500 500 to 1,000 1,000 to 2,000 2,000 to 5,000 More than 5,000The Global Financial Centres Index 25 | 41
Appendix 1: Assessment Details
Table 18 | GFCI 25 Details Of Assessments By Centre
GFCI GFCI ----- Assessmemts ----- GFCI GFCI ----- Assessmemts -----
Centre 25 25 Centre 25 25
Number Average St. Dev Number Average St. Dev
Rank Rating Rank Rating
New York 1 794 1,013 867 134 Astana 51 631 264 619 255
London 2 787 964 858 143 Brussels 52 630 359 633 191
Hong Kong 3 783 957 846 137 Bangkok 53 629 264 630 161
Singapore 4 772 654 867 124 Mauritius 54 628 114 596 253
Shanghai 5 770 798 838 147 Stockholm 55 627 173 611 223
Tokyo 6 756 445 814 153 Cape Town 56 626 128 639 188
Toronto 7 755 342 768 154 Kuwait City 57 625 78 562 251
Zurich 8 739 538 786 159 Calgary 58 621 115 617 185
Beijing 9 738 819 765 149 Istanbul 59 620 190 585 206
Frankfurt 10 737 648 771 177 Lisbon 60 619 181 613 204
Sydney 11 736 366 802 162 Mexico City 61 616 108 588 194
Dubai 12 733 506 735 178 Prague 62 614 139 610 184
Boston 13 732 397 751 155 Glasgow 63 613 168 569 207
Shenzhen 14 730 515 769 142 Oslo 64 612 123 593 215
Melbourne 15 729 254 753 173 Rio de Janeiro 65 611 80 598 226
San Francisco 16 727 386 782 162 Sao Paulo 66 609 109 595 221
Bahrain 67 608 136 618 201
Los Angeles 17 724 364 753 158
Jakarta 68 607 129 560 215
Montreal 18 722 181 716 175
GIFT City-Gujarat 69 606 106 525 253
Vancouver 19 721 207 744 164
Warsaw 70 605 187 601 221
Chicago 20 717 380 739 157
Budapest 71 603 103 590 195
Cayman Islands 21 713 182 679 224
British Virgin Islands 72 602 162 615 244
Casablanca 22 712 115 697 227 St Petersburg 73 601 143 589 209
Tel Aviv 23 710 121 671 247 Helsinki 74 599 106 560 189
Guangzhou 24 708 438 649 179 Guernsey 75 598 185 572 209
Bermuda 25 705 84 676 216 Copenhagen 76 597 212 595 201
Abu Dhabi 26 702 383 695 196 Liechtenstein 77 596 143 602 222
Paris 27 699 524 709 177 Riga 78 595 76 512 226
Geneva 28 698 358 713 183 Sofia 79 593 67 500 221
Qingdao 29 694 945 828 119 Gibraltar 80 591 145 570 240
Luxembourg 30 691 321 684 207 Tianjin 81 589 256 477 246
Osaka 31 690 169 713 199 Panama 82 588 118 576 255
Washington DC 32 689 374 777 166 Reykjavik 83 587 103 569 222
Monaco 33 686 177 646 228 Isle of Man 84 586 151 575 220
Taipei 34 676 162 682 185 Bahamas 85 585 132 551 228
Edinburgh 35 674 316 664 181 Rome 86 584 208 582 195
Seoul 36 668 359 648 223 Chengdu 87 583 905 448 213
Madrid 37 667 265 648 180 Moscow 88 582 349 573 207
Dublin 38 658 393 663 182 Malta 89 581 175 563 219
Kuala Lumpur 39 652 299 638 193 Buenos Aires 90 580 63 556 237
Riyadh 91 575 127 537 228
Wellington 40 647 68 735 187
Mumbai 92 573 213 552 188
Amsterdam 41 646 443 665 191
Cyprus 93 572 142 531 222
Doha 42 642 171 657 217
Tallinn 94 569 88 565 236
Munich 43 641 270 672 191
Baku 95 567 129 534 187
Vienna 44 640 207 628 220
New Delhi 96 565 201 551 179
Milan 45 638 241 644 174 Nairobi 97 564 61 493 226
Busan 46 636 197 467 225 Manila 98 562 167 535 189
Jersey 47 635 218 601 212 Hangzhou 99 561 141 560 220
Johannesburg 48 634 123 617 202 Almaty 100 560 344 558 231
Stuttgart 49 633 84 692 215 Dalian 101 520 862 319 157
Hamburg 50 632 246 644 200 Athens 102 519 111 498 23442 | The Global Financial Centres Index 25
Appendix 2: Respondents’ Details
Table 19 | GFCI 25 Respondents By Industry Sector
Number of % of
Industry Sector
Respondents Respondents
Banking 697 29%
Finance 159 7%
Government & Regulatory 109 5%
Insurance 149 6%
Investment Management 308 13%
Professional Services 379 16%
Trade Association 97 4%
Trading 129 5%
Not Specified 346 15%
Total 2373 100%
Table 20 | GFCI 25 Respondents By Region
Number of % of
Region
Respondents Respondents
Western Europe 687 29%
Asia/Pacific 1014 43%
North America 153 6%
Middle East End Africa 194 8%
Eastern Europe And Central Asia
115 5%
Latin America And the Caribbean
44 2%
Multi-Regional 166 7%
Total 2373 100%
Table 21 | GFCI 25 Respondents By Size Of Organisation
Number of % of
Size of Organisation
Respondents Respondents
Fewer than 100 604 25%
100 to 500 477 20%
500 to 1,000 407 17%
1,000 to 2,000 287 12%
2,000 to 5,000 171 7%
More than 5,000 406 17%
Not Specified 21 1%
Total 2373 100%The Global Financial Centres Index 25 | 43
Appendix 3: Methodology
The GFCI provides ratings for financial centres calculated by a ‘factor assessment model’
that uses two distinct sets of input:
Instrumental factors: objective evidence of competitiveness was sought from a wide
variety of comparable sources. For example, evidence about the telecommunications
infrastructure competitiveness of a financial centre is drawn from the ICT Development
Index (supplied by the United Nations), the Networked Readiness Index (supplied by the
World Economic Forum), the Telecommunication Infrastructure Index (by the United
Nations) and the Web Index (supplied by the World Wide Web Foundation). Evidence
about a business-friendly regulatory environment is drawn from the Ease of Doing
Business Index (supplied by the World Bank), the Government Effectiveness rating
(supplied by the World Bank) and the Corruption Perceptions Index (supplied by
Transparency International) amongst others.
A total of 133 instrumental factors are used in GFCI 25 of which 53 were updated since
GFCI 24 and five are new to the GFCI. Not all financial centres are represented in all the
external sources, and the statistical model takes account of these gaps.
Financial centre assessments: by means of an online questionnaire, running
continuously since 2007, We received 3,708 responses to the questionnaire in the 24
months to December 2018. Of these, 2,373 respondents provided 29,065 valid
assessments of financial centres. Financial centres are added to the GFCI questionnaire
when they receive five or more mentions in the online questionnaire in response to the
question: “Are there any financial centres that might become significantly more
important over the next two to three years?”
A centre is only given a GFCI rating and ranking if it receives more than 150 assessments
from other centres within the previous 24 months in the online survey. Centres in the
GFCI that do not receive 50 assessments in a 24 month period are removed and added
to the Associate list until the number of assessments increases.
At the beginning of our work on the GFCI, a number of guidelines were set out.
Additional Instrumental Factors are added to the GFCI model when relevant and
meaningful ones are discovered:
• indices should come from a reputable body and be derived by a sound
methodology;
• indices should be readily available (ideally in the public domain) and be regularly
updated;
• updates to the indices are collected and collated every six months;
• no weightings are applied to indices;
• Indices are entered into the GFCI model as directly as possible, whether this is a
rank, a derived score , a value, a distribution around a mean or a distribution
around a benchmark;You can also read