The Global Fire Atlas of individual fire size, duration, speed and direction
←
→
Page content transcription
If your browser does not render page correctly, please read the page content below
Earth Syst. Sci. Data, 11, 529–552, 2019
https://doi.org/10.5194/essd-11-529-2019
© Author(s) 2019. This work is distributed under
the Creative Commons Attribution 4.0 License.

                   The Global Fire Atlas of individual fire size,
                         duration, speed and direction
          Niels Andela1,2 , Douglas C. Morton1 , Louis Giglio3 , Ronan Paugam4 , Yang Chen2 , Stijn Hantson2 ,
                                  Guido R. van der Werf5 , and James T. Randerson2
            1 Biospheric Sciences Laboratory, NASA Goddard Space Flight Center, Greenbelt, MD 20771, USA
                  2 Department  of Earth System Science, University of California, Irvine, CA 92697, USA
              3 Department of Geographical Sciences, University of Maryland, College Park, MD 20742, USA
                      4 Centre Européen de Recherche et de Formation Avancée en Calcul Scientifique,

                                             URA1875, CNRS, Toulouse, France
                      5 Faculty of Science, Vrije Universiteit Amsterdam, Amsterdam, the Netherlands

                                  Correspondence: Niels Andela (niels.andela@nasa.gov)

                                  Received: 3 August 2018 – Discussion started: 5 September 2018
                           Revised: 20 March 2019 – Accepted: 23 March 2019 – Published: 24 April 2019

      Abstract. Natural and human-ignited fires affect all major biomes, altering ecosystem structure, biogeochem-
      ical cycles and atmospheric composition. Satellite observations provide global data on spatiotemporal patterns
      of biomass burning and evidence for the rapid changes in global fire activity in response to land management
      and climate. Satellite imagery also provides detailed information on the daily or sub-daily position of fires that
      can be used to understand the dynamics of individual fires. The Global Fire Atlas is a new global dataset that
      tracks the dynamics of individual fires to determine the timing and location of ignitions, fire size and duration,
      and daily expansion, fire line length, speed, and direction of spread. Here, we present the underlying method-
      ology and Global Fire Atlas results for 2003–2016 derived from daily moderate-resolution (500 m) Collection
      6 MCD64A1 burned-area data. The algorithm identified 13.3 million individual fires over the study period, and
      estimated fire perimeters were in good agreement with independent data for the continental United States. A
      small number of large fires dominated sparsely populated arid and boreal ecosystems, while burned area in agri-
      cultural and other human-dominated landscapes was driven by high ignition densities that resulted in numerous
      smaller fires. Long-duration fires in boreal regions and natural landscapes in the humid tropics suggest that fire
      season length exerts a strong control on fire size and total burned area in these areas. In arid ecosystems with
      low fuel densities, high fire spread rates resulted in large, short-duration fires that quickly consumed available
      fuels. Importantly, multiday fires contributed the majority of burned area in all biomass burning regions. A first
      analysis of the largest, longest and fastest fires that occurred around the world revealed coherent regional pat-
      terns of extreme fires driven by large-scale climate forcing. Global Fire Atlas data are publicly available through
      http://www.globalfiredata.org (last access: 9 August 2018) and https://doi.org/10.3334/ORNLDAAC/1642, and
      individual fire information and summary data products provide new information for benchmarking fire models
      within ecosystem and Earth system models, understanding vegetation–fire feedbacks, improving global emis-
      sions estimates, and characterizing the changing role of fire in the Earth system.

Published by Copernicus Publications.
530                                                                                      N. Andela et al.: The Global Fire Atlas

1   Introduction                                                   vidual fires in time and space, with demonstrated improve-
                                                                   ments for isolating ignition points and constraining final fire
Worldwide, fires burn an area about the size of the Euro-          perimeters (Frantz et al., 2016; Andela et al., 2017). In addi-
pean Union every year (423 Mha yr−1 ; Giglio et al., 2018).        tion to the size and ignition points of individual fires, other
The majority of burned area occurs in grasslands and sa-           studies used daily or sub-daily detections of fire activity to
vannas where fires maintain open landscapes by reducing            track growth dynamics of fires (Loboda and Csiszar, 2007;
shrub and tree cover (Scholes and Archer, 1997; Abreu et           Coen and Schroeder, 2013; Veraverbeke et al., 2014; Sá et
al., 2017). However, all major biomes burn. Climate controls       al., 2017). Together, these studies highlight the strengths and
global patterns of fire activity by driving vegetation produc-     limitations of using daily or sub-daily satellite imagery to
tivity and fuel buildup as well as fuel moisture (Bowman et        derive information about individual fires and their behavior
al., 2009). Humans are the dominant source of ignition in          over time.
most flammable ecosystems, but human activities also reduce           Here, we present the Global Fire Atlas of individual fires
fire sizes through landscape fragmentation and fire suppres-       based on a new methodology for identifying the location and
sion (Archibald et al., 2012; Taylor et al., 2016; Balch et al.,   timing of fire ignitions and estimating fire size and duration,
2017).                                                             and daily expansion, fire line length, speed, and direction of
   Over the past 18 years, socioeconomic development and           spread. The Global Fire Atlas is derived from the Moderate
corresponding changes in human land use have considerably          Resolution Imaging Spectroradiometer (MODIS) Collection
reduced fire activity in fire-dependent grasslands and savan-      6 (Col. 6) burned-area dataset (Giglio et al., 2018), which
nas worldwide (Andela et al., 2017). At the same time warm-        includes an estimated day-of-burn data layer at a 500 m res-
ing climate has dried fuels and has increased the length of fire   olution. Individual fire data were generated starting in 2003,
seasons across the globe (Jolly et al., 2015), which is partic-    when combined data from the Terra and Aqua satellites be-
ularly important in forested ecosystems with abundant fuels        gan to provide greater burn date certainty. The algorithm for
(e.g., Kasischke and Turetsky, 2006; Aragão et al., 2018).         the Global Fire Atlas tracks the daily progression of indi-
Fire activity increases nonlinearly in response to drought         vidual fires at a 500 m resolution to produce a set of met-
conditions in populated areas of the humid tropics (Alen-          rics on individual fire behavior in standard raster and vector
car et al., 2011; Field et al., 2016), resulting in large-scale    data formats. Together, these Global Fire Atlas data layers
degradation of tropical ecosystems (van der Werf et al., 2008;     provide an unprecedented look at global fire behavior and
Morton et al., 2013b; Brando et al., 2014) and extensive pe-       changes in fire dynamics during 2003–2016. The data are
riods of poor air quality (Johnston et al., 2012; Lelieveld et     freely available at http://www.globalfiredata.org (last access:
al., 2015; Koplitz et al., 2016). Moreover, increasing pop-        9 August 2018) and https://doi.org/10.3334/ORNLDAAC,
ulation densities in highly flammable biomes also amplify          and new years will be added to the dataset following the
the socioeconomic impact of wildfires related to air quality       availability of global burned-area data.
or damage to houses and infrastructure (Moritz et al., 2014;
Knorr et al., 2016). Despite the importance of understand-
ing changing global fire regimes for ecosystem services, hu-       2   Data and methods
man well-being, climate and conservation, our current under-
standing of changing global fire regimes is limited because        Here, we developed a method to isolate individual fires from
existing satellite data products detect actively burning pixels    daily moderate-resolution burned-area data. The approach
or burned area but not individual fires and their behavior.        used two filters to account for uncertainties in the day of
   Frequent observations from moderate-resolution, polar-          burn, in order to map the location and timing of fire igni-
orbiting satellites may provide information on individual fire     tions and the extent and duration of individual fires (Fig. 1).
behavior in addition to estimates of total burned area. Several    Subsequently, we tracked the growth dynamics of each indi-
recent studies have shown that fire-affected pixels can be sep-    vidual fire to estimate the daily expansion, fire line length,
arated into clusters based on spatial and temporal proximity.      speed, and direction of spread. Based on the Global Fire
This information can be used to study the number and size          Atlas algorithm, burned area was broken down into seven
distributions of individual fires (Archibald and Roy, 2009;        fire characteristics in three steps (Fig. 1b). First, burned area
Hantson et al., 2015; Oom et al., 2016), fire shapes (Nogueira     was described as the product of ignitions and individual fire
et al., 2016; Laurent et al., 2018) and the location of ig-        sizes. Second, fire size was further separated into fire dura-
nition points (Benali et al., 2016; Fusco et al., 2016). One       tion and a daily expansion component. Third, the daily fire
limitation of fire-clustering algorithms that rely on spatial      expansion was subdivided into fire speed, the length of the
and temporal proximity of fire pixels is the inability to sep-     fire line and the direction of spread. The Global Fire Atlas
arate individual fires within large burn patches that contain      algorithm can be applied to any moderate-resolution daily
multiple ignition points, a frequent phenomenon in grassland       global burned-area product, and the quality of the resulting
biomes. To address the possibility of multiple ignition points,    dataset depends both on the Fire Atlas algorithm as well as
other algorithms have specifically tracked the spread of indi-     the underlying burned-area product. Here, we applied the al-

Earth Syst. Sci. Data, 11, 529–552, 2019                                            www.earth-syst-sci-data.net/11/529/2019/
N. Andela et al.: The Global Fire Atlas                                                                                         531

gorithm to the MCD64A1 Col. 6 burned-area dataset (Giglio          all local minima were mapped within the original field of
et al., 2018), and the minimum detected fire size is there-        burn dates (Fig. 2a and b). Next, each local minimum was re-
fore one MODIS pixel (approximately 21 ha). Several studies        placed by the next burn date of the surrounding grid cells, and
have shown that the MCD64A1 Col. 6 burned-area product is          a new map of local minima was created. If the original local
a considerable improvement compared to the previous gen-           minimum remained as a part of a new, larger local minimum
eration of moderate-resolution global burned-area products         with a later burn date, the fire followed a logical progression
(Giglio et al., 2018; Humber et al., 2019; Rodrigues et al.,       in time and space, and the original local minimum was re-
2019). We also present a preliminary accuracy assessment of        tained. If the local minimum disappeared, the original local
the higher-order Global Fire Atlas products using indepen-         minimum was likely the product of an inconsistency within
dent fire perimeter data for the continental US and active-fire    the field of burn dates rather than a true ignition point and the
detections to assess estimated fire duration and the temporal      burn date was adjusted forward in time to remove the origi-
accuracy of individual fire dynamics.                              nal local minimum. This step can be repeated several times,
                                                                   with each new iteration further reducing the number of local
2.1   Individual fires: ignitions, size, perimeter and
                                                                   minima and increasing the confidence in ignition points, yet
      duration
                                                                   each iteration also results in a greater adjustment of the orig-
                                                                   inal burn date information (Fig. A1 in Appendix A). Here,
Large burn patches are often made up of multiple individual        we implemented three iterations of the ignition point filter
fires that may burn simultaneously or at different points in       to remove most local minima that did not spread forward
time during the fire season, particularly in frequently burn-      in time while limiting the scope of burn date adjustments
ing grasslands and savannas with a high density of ignitions       (Figs. 2c and d, A1 and A2). For short duration fires, the
from human activity. Separating large clusters of burned area      ignition points were retained associated with the largest pos-
into individual fires is therefore critical to any understanding   sible number of iterations. In all cases, if several local min-
of the fire regime in human-dominated landscapes. To isolate       ima were connected through a single cluster of grid cells with
individual fires, clusters of adjacent burned area for a given     the same burn date, only the local minimum with the earliest
fire season (12 months centered on the month of maximum            burn date or largest number of grid cells was retained, unless
burned area) were subdivided into individual fires based on        the required adjustment of the burn date was larger than the
the spatial structure of estimated burn dates in the MCD64A1       specified burn date uncertainty in the MCD64A1 product. If
burned-area product. Although we allow individual fires to         the final ignition location consisted of multiple 500 m grid
burn from one fire season into the next, we processed the          cells, we used the center coordinates to produce the ignition
data on a per-fire-season basis in each 10◦ ×10◦ MODIS tile.       point shapefile. By design, the ignition point filter cannot ad-
In the rare case that a pixel burned twice during a single fire    just the earliest burn date of a fire and thus has no influence
season (< 1 %), we retained only the earliest burn date. This      on estimated fire duration.
approach results in a small reduction of total burned area in         To establish the location and date of ignition points, as
order to create standardized annual data layers in both grid-      well as to track the daily growth and extent of individual
ded raster and shapefile formats. To locate candidate ignition     fires, we used a fire persistence threshold that determined
points within each burned-area cluster, we mapped the “local       how long a fire may take to spread from one 500 m grid cell
minima”, defined as a single grid cell or group of adjacent        into the next, taking both fire spread rate and satellite cov-
grid cells with the same burn date surrounded by grid cells        erage into account (Fig. A3). For example, if ignition points
with later burn dates. However, because of variability in or-      were adjacent to a fire that burned earlier in the season, this
bital coverage and cloud cover, burn date estimates are some-      threshold allowed the ignition points to be mapped as sep-
what uncertain (Giglio et al., 2013), which results in many lo-    arate local minima despite the presence of adjacent burned
cal minima that may not correspond to actual ignition points.      grid cells with earlier burn dates. On the other hand, if an ac-
We applied a three-step procedure to address burn date uncer-      tive fire is covered by dense clouds or smoke, multiple days
tainty and distinguish individual fires. First, we developed a     can pass before a new observation can be made, resulting in
filter to adjust the burn date of local minima that do not cor-    a break in fire continuity and increasing the risk of artificially
respond to ignition points. Second, we set a “fire persistence”    splitting single fires into multiple parts. Using such a thresh-
threshold that determines how long a fire may take to spread       old is particularly important to distinguish individual fires in
from one 500 m grid cell into the next, to distinguish individ-    frequently burning savannas and highly fragmented agricul-
ual fires that are adjacent but that occurred at different times   tural landscapes, where many individual small fires may oc-
in the same fire season. Third, we developed a second filter       cur within a relatively short time span. Because there are no
to correct for outliers in the burn date that occurred along the   reference datasets on global fire persistence, we used a spa-
edges of large fires. Each of these steps is described in detail   tially varying fire persistence threshold that depends on fire
below.                                                             frequency (Andela et al., 2017). We assumed that frequently
    The ignition point filter is based on the assumption that      burning landscapes are generally characterized by faster fires
the fires progress continuously through time and space. First,     and higher ignition densities, increasing the likelihood of

www.earth-syst-sci-data.net/11/529/2019/                                             Earth Syst. Sci. Data, 11, 529–552, 2019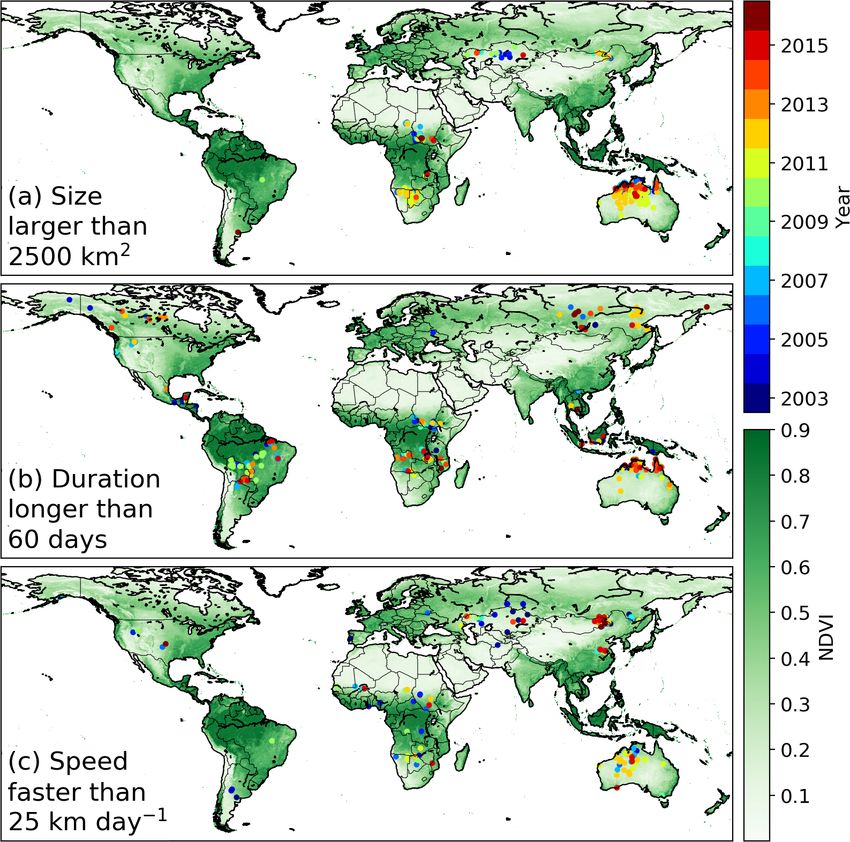
532                                                                                              N. Andela et al.: The Global Fire Atlas

Figure 1. Flowchart showing the data-processing steps and resulting products. (a) The Global Fire Atlas algorithm tracks individual fires
and their day-to-day behavior based on the MCD64A1 Col. 6 500 m daily burned-area product starting in 2003. (b) Decomposition of burned
area into seven different components of the fire regime in the Global Fire Atlas. The output includes two annual shapefile layers (.shp) of the
ignition location and individual fire perimeters, with corresponding database files (.dbf) providing summary information for each individual
fire, including the seven key characteristics. In addition, four per-fire-year global raster maps on the 500 m sinusoidal MODIS grid (.tif)
provide details on the day-to-day fire behavior. Finally, data are summarized in a monthly 0.25◦ gridded product based on average values of
individual fires. Global Fire Atlas data layers are described in more detail in Table A1.

having multiple ignition points within large burn patches,                actively burning fires meet, as on day 255 for the example
while infrequently burning landscapes will generally be char-             fires shown in Fig. 2, grid cells that burned on the day of
acterized by slower fire spread rates and/or fewer ignitions.             the merger were divided based on nearest distance to the fire
In addition, frequently burning landscapes often have a pro-              perimeter on the previous day.
nounced dry season characterized by low cloud cover, while                   Burn date uncertainty may also lead to multiple “extinc-
infrequently burning landscapes may experience a shorter                  tion points”, outliers in the estimated day of burn along the
dry season with greater obscuration by clouds. Therefore, we              edges of a fire. Environmental conditions such as cloud cover
used a 4 d fire persistence threshold for 500 m grid cells that           complicate the precise estimation of the date of fire extinc-
burned more than three times during the study period (2003–               tion, as rainfall events extinguish many fires, and pixels at
2016), and a 6, 8 and 10 d fire persistence period for grid cells         the edge of the fire may be partially burned and therefore
that burned three times, twice or once, respectively. These               harder to detect. In addition, the contextual relabeling phase
threshold values broadly correspond to biomes, with shorter               of the MCD64A1 algorithm increases burn date uncertainty
persistence values for tropical regions and human-dominated               for extinction points based on a longer consistency threshold
landscapes and longer threshold values for temperate and bo-              (Giglio et al., 2009). We used a second filtering step to adjust
real ecosystems with high fuel loads (Fig. A3).                           the burn date for extinction points (if required). Outliers were
   Based on the location and date of the established igni-                adjusted to the nearest burn date back in time if (1) they rep-
tion points and the fire persistence thresholds, we tracked the           resented a cluster no more than one to four grid cells (0.21–
growth of each individual fire through time to determine its              0.9 km2 ) along the edge of a fire that was as least 10 times
size, perimeter and duration (Fig. 2f). For each day of the               larger, and if (2) the difference in burn dates was larger than
year, we allowed individual fires to grow into the areas that             the fire persistence threshold of the adjacent grid cells and
burned on that specific day, as long as the difference in burn            thus mapped as a new fire along the edge of the larger fire. If
dates between two pixels was equal to or smaller than the                 these criteria were met, the outliers were adjusted to the near-
fire persistence threshold of the pixel of origin. When two               est burn date back in time and incorporated within the larger

Earth Syst. Sci. Data, 11, 529–552, 2019                                                     www.earth-syst-sci-data.net/11/529/2019/
N. Andela et al.: The Global Fire Atlas                                                                                                  533

Figure 2. Algorithm example accounting for uncertainty in the “day of burn” and identifying individual fires within large clusters of adjacent
burned pixels. (a) The original MCD64A1 Col. 6 day of burn for one burned patch in the Brazilian Cerrado (in the year 2015), and (b) local
minima or “ignition points” identified within the original day-of-burn data layer. (c) Burn date adjustment based on the filter that removes
local minima that do not progress continuously through time and space (positive adjustment), and (d) the corresponding estimate of ignition
points based on the adjusted day-of-burn field. (e) Further burn date adjustment based on the removal of outliers along the edge of the fire
(negative adjustment of extinction points), and (f) the final estimate of ignition locations and dates by the Global Fire Atlas, based on the
combined adjustments shown in (e). In (f), the red and blue lines indicate the final fire perimeters.

neighboring fire. However, if these criteria were not met (e.g.,         over, fire dynamics tend to be highly variable in space and
for burned areas larger than four grid cells), the original burn         time. To understand the spatial variability and distribution of
dates and ignition points were left unadjusted, resulting in             fire speeds, we therefore used an alternative method to esti-
separate fires. For the example fires shown in Fig. 2, the ad-           mate the speed and direction of fire spread for each individual
justment of these outliers affected four grid cells (Fig. 2e)            500 m grid cell.
and effectively reduced the number of ignition points (and                  To estimate the speed and direction of spread (Fig. 3), we
resulting individual fires) from five (Fig. 2d) to two (Fig. 2f).        calculated the most likely path of the fire to reach each in-
After adjusting these outliers (extinction points) and includ-           dividual 500 m grid cell based on shortest distance. More
ing them within the larger fires, we estimated the size (km2 ),          specifically, for each grid cell we estimated the shortest route
duration (d) and perimeter (km) of each individual fire based            to connect the grid cell between two points: (1) the near-
on the adjusted burn dates.                                              est point on the fire line with the same day of burn and
                                                                         (2) the nearest point on the previous day’s fire line. This route
                                                                         was forced to follow areas burned on the specific day. For
2.2   Daily fire expansion: fire line, speed and direction of
                                                                         each point on this route, or “fire path”, the speed of the fire
      spread
                                                                         (km d−1 ) was estimated as the length of the path (km) di-
The revised day-of-burn estimates were used to track the                 vided by 1 d (d−1 ) and the direction as the direction of the
daily expansion (km2 d−1 ) and length of the fire line (km)              next grid cell on the fire path. Since each grid cell is sur-
for each individual fire. The daily estimates of fire line length        rounded by eight other grid cells, this resulted in eight possi-
were based on the daily perimeter of the fire, where we as-              ble spread directions: north, northeast, east, southeast, south,
sumed that once the fire reached the edge of the burn scar               southwest, west and northwest. For ignition points that repre-
this part of the perimeter stops burning after 1 d (Fig. 3a).            sented a cluster of 500 m grid cells with the same burn date,
The expansion of the fire (km2 d−1 ) is the area burned by               we assumed that the fire originated in the center point of the
a fire each day. The average speed of the fire line (km d−1 )            cluster (pixel with largest distance to the final fire perimeter
can now be calculated as the expansion (km2 d−1 ), divided               by the end of day 1) and spreads towards the perimeter of the
by the length of the fire line (km) on the same day. How-                fire by the end of day 1 over the course of 1 d. For single pixel
ever, this estimate of fire line includes the head, flank and            fires, we assumed the fire burned across 463 m (1 pixel) dur-
backfire, while it is typically the head fire that moves fastest         ing a single day, and we did not assign a direction of spread.
and may be responsible for most of the burned area. More-                Similarly, fires of all sizes that burned on a single day were

www.earth-syst-sci-data.net/11/529/2019/                                                     Earth Syst. Sci. Data, 11, 529–552, 2019
534                                                                                              N. Andela et al.: The Global Fire Atlas

Figure 3. Sub-daily estimates of fire progression can be used to estimate spatiotemporal variation in fire speed and direction of spread.
(a) Daily progression of the fire line, (b) interpolated estimates of sub-daily time of arrival, (c) fire speed (km d−1 ) and (d) direction of
spread. The light gray areas in (a) are burned areas between fire lines and correspond to areas of relatively high fire speed. White areas were
not burned.

not assigned a direction of spread. We corrected estimates of             Suite (VIIRS) instrument aboard the Suomi National Polar-
both speed and direction for the orientation between 500 m                orbiting Partnership (Suomi-NPP) satellite (Schroeder et al.,
grid cells on the MODIS sinusoidal projection that vary with              2014). Active-fire detections provide accurate information
location. When a particular grid cell formed part of multiple             on the burn date, particularly in ecosystems with low fuel
fire paths, the earliest time of arrival or the highest fire speed        loads where fires will typically be only active during a sin-
and corresponding direction of spread were retained. This as-             gle day in each particular grid cell. We compared the date of
sures a logical progression of the fire in time and space and             active-fire detections from VIIRS within each larger 500 m
corresponds to fires typically moving fastest in a principal              MODIS grid cell (based on VIIRS center point) to the ad-
direction and then spreading more slowly along the flank.                 justed MCD64A1 day of burn to understand the temporal
                                                                          precision of the derived Global Fire Atlas products. If sev-
                                                                          eral active-fire detections were available for a single 500 m
2.3   Preliminary accuracy assessment                                     MODIS grid cell, we reported the day closest to the temporal
                                                                          mean. We compared all 500 m MODIS grid cells with cor-
Few large-scale datasets are available on daily or sub-daily
                                                                          responding active-fire detection during the overlapping data
fire dynamics, highlighting the novelty of the Global Fire At-
                                                                          period (2012–2016) for four different ecosystems globally:
las dataset but also posing challenges for validation. Here, we
                                                                          (1) forests (including all forests), (2) shrublands (including
used four alternative datasets to carry out an initial accuracy
                                                                          open and closed shrublands), (3) woody savannas, and (4) sa-
assessment. First, we used active-fire detections to assess the
                                                                          vannas and grasslands, with the land cover type derived from
temporal accuracy of the Global Fire Atlas burn date. Sec-
                                                                          MODIS MCD12Q1 Col. 5.1 data for 2012 using the Univer-
ond, we compared fire perimeters to independent fire perime-
                                                                          sity of Maryland (UMD) classification (Friedl et al., 2002).
ter data for the continental US. Third, we combined the in-
                                                                             We compared fire perimeters from the Global Fire At-
dependent data on fire perimeters with active-fire detections
                                                                          las to fire perimeter estimates from the Monitoring Trends
to evaluate the Global Fire Atlas fire duration estimates. Fi-
                                                                          in Burn Severity (MTBS) project during their overlapping
nally, we compared Global Fire Atlas data to a small (man-
                                                                          period (2003–2015). The MTBS project provides semiauto-
ually compiled) dataset of daily fire perimeters from the US
                                                                          mated estimates of fire perimeters based on 30 m Landsat
Forest Service.
                                                                          data for fires with a minimum size of 1000 acres (405 ha)
   To evaluate burn dates in the Global Fire Atlas, we used
                                                                          in the western US and 500 acres (202 ha) in the eastern
the 375 m resolution active-fire detections (VNP14IMGML
                                                                          US (Eidenshink et al., 2007; Sparks et al., 2015). To deter-
C1) derived from the Visible Infrared Imaging Radiometer

Earth Syst. Sci. Data, 11, 529–552, 2019                                                     www.earth-syst-sci-data.net/11/529/2019/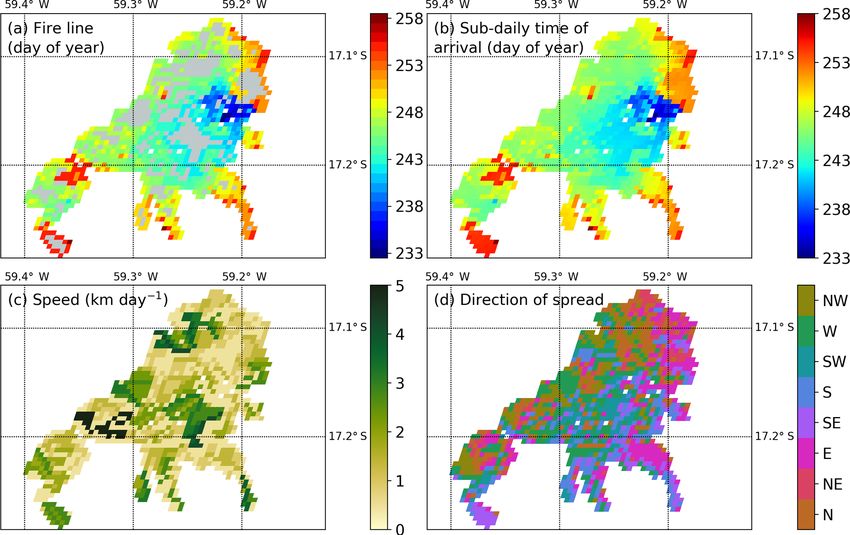
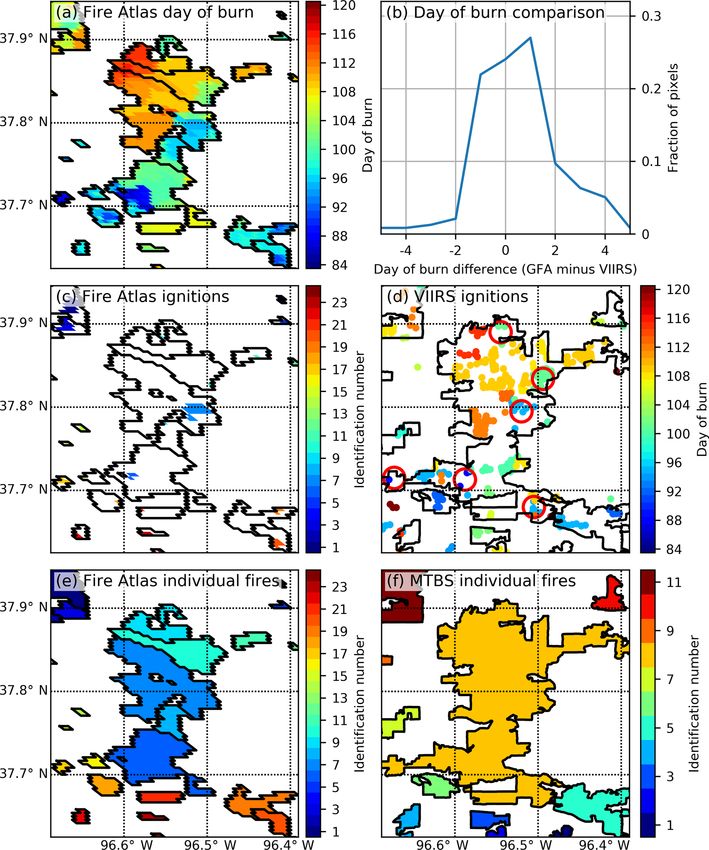
N. Andela et al.: The Global Fire Atlas                                                                                       535

mine overlap between MTBS and Fire Atlas perimeter esti-           3     Results
mates, we rasterized the MTBS perimeters onto the 500 m
MODIS sinusoidal grid, including all 500 m grid cells with         3.1    Preliminary accuracy assessment
their center point within the higher-resolution (30 m) MTBS
fire perimeter. For all overlapping fire perimeters, we com-       At the pixel scale, estimated burn dates from burned-area and
pared the original MTBS fire perimeter information with the        active-fire products were comparable (Fig. 4), with greater
Fire Atlas estimates of fire perimeters. In cases with multi-      variability across biomes than from minor burn date adjust-
ple overlapping perimeters, fires with the largest overlapping     ments in the Global Fire Atlas algorithm. Burn dates esti-
surface area were compared.                                        mated from MODIS burned-area and VIIRS active-fire de-
   We also combined MTBS fire perimeters with VIIRS                tections were least comparable in high-biomass ecosystems
active-fire detections to derive an alternative estimate of fire   with lower fire spread rates. In forests and woody savannas
duration (2012–2015). To estimate fire duration from these         24 % and 35 % of burned pixels were detected on the same
products, we first determined the median burn date of each         day and 54 % and 67 % within ±1 d, respectively (Fig. 4a and
fire according to the MCD64A1 burned-area data. Subse-             c). With decreasing biomass, the direct correspondence be-
quently, we included all VIIRS active-fire detections before       tween burn dates from burned-area and active-fire detections
and after the median or “center” burn date until a period of       increased to 41 % (same day) and 80 % (±1 d) in shrublands
three fire-free days was reached. Any active-fire detections       (Fig. 4b) and 40 % (same day) and 75 % (±1 d) in savan-
that occurred outside this timeframe were excluded to avoid        nas and grasslands (Fig. 4d). These differences likely stem
overestimation of the fire duration due to smoldering or pos-      from the combined increase in the uncertainty of burn date in
sible false detections before or after the fire. Two thresholds    higher-biomass ecosystems and the influence of fire persis-
were used to select a subset of MTBS and Fire Atlas perime-        tence (multiple active-fire days in a single 500 m grid cell) on
ters to assess the accuracy of estimated fire duration. Fires      the ability to reconcile the timing of burned-area and active-
were first matched based on perimeters, with a maximum             fire detections in these ecosystems. Several factors may ac-
tolerance of a threefold difference in length between perime-      count for the positive bias in the 500 m day of burn from
ters. Second, we further selected MTBS perimeters with VI-         burned-area compared to active-fire detections, including or-
IRS active-fire detections for at least 25 % of the 500 m Fire     bital coverage, cloud and smoke obscuration, and different
Atlas grid cells. These thresholds excluded 51 % of the over-      thresholds between burned-area and active-fire algorithms re-
lapping fire perimeters but reduced errors originating from        garding the burned fraction of a 500 m grid cell. The adjust-
cloud cover or differences in the underlying burned-area es-       ments we made to the burn date in the Global Fire Atlas,
timates (e.g., resolution, methodology) to evaluate estimated      required to effectively determine the extent and duration of
fire duration. Similar to the assessment of burn date accu-        individual fires, had a relatively small effect on the overall
racy, comparisons of fire perimeters and fire duration with        accuracy assessment but tended to reduce the negative bias in
MTBS data over the continental US were grouped into four           burn dates and increase the positive bias compared to the un-
land cover types: (1) forests, (2) shrublands, (3) woody sa-       derlying MCD64A1 Col. 6 product (see red and black lines in
vannas, and (4) savannas and grasslands.                           Fig. 4). In line with these findings, we found good agreement
   For specific large wildfires across the western US, the US      between a 3 d running average of the Global Fire Atlas and
Forest Service National Infrared Operations (NIROPS; https:        US Forest service estimates of daily fire expansion but re-
//fsapps.nwcg.gov/nirops/, last access: 1 September 2018)          duced correspondence for daily estimates of fire growth rates
estimates daily fire perimeters for fire management purposes       due to uncertainty in the day of burn of the burned-area prod-
by collecting aircraft high-resolution infrared imagery. This      uct (Fig. B1 in Appendix B).
imagery is manually analyzed by trained specialists to ex-            For fire perimeters, the best agreement between the Global
tract the active fire front. Although these data provide a         Fire Atlas and MTBS was found in forests and shrublands,
wealth of information, only a small number of fires are com-       where the Global Fire Atlas reproduced 65 % and 61 %
pletely and precisely documented. We were able to extract          of the observed variance in MTBS fire perimeters, respec-
15 large fires from the NIROPS database for which daily            tively (Fig. 5). Less agreement was found for woody savan-
perimeter information was available. Although insufficient         nas (38 %) and savannas and grasslands (41 %). Overall, the
for full-scale validation, the comparison with NIROPS data         Global Fire Atlas underestimated fire perimeter length in all
provides valuable insights into the strengths and shortcom-        of the vegetation classes. However, uncertainty exists in both
ings of the Global Fire Atlas estimates of individual fire size,   datasets. Orthogonal distance regression (ODR) accommo-
duration and expansion rates. In addition to per-fire averages,    dates uncertainties in both datasets and generally resulted in
we compared day-to-day expansion rates (km2 d−1 ) of indi-         slopes closer to the 1 : 1 line, indicating closer correspon-
vidual large fires across both datasets. If multiple Global Fire   dence, on average, in absolute perimeter estimates for the
Atlas perimeters overlapped with a single US Forest Service        two datasets. An in-depth comparison of the performance
fire perimeter, we compared the fires with the largest over-       of the Global Fire Atlas and the MTBS datasets for sev-
lapping surface area.                                              eral grassland fires in Kansas (US) suggested that differences

www.earth-syst-sci-data.net/11/529/2019/                                             Earth Syst. Sci. Data, 11, 529–552, 2019
536                                                                                          N. Andela et al.: The Global Fire Atlas

                                                                       Shrublands, woody savannas, and savannas and grasslands
                                                                       had lower correlations, with 27 %, 30 %, and 33 % of the
                                                                       variance explained, respectively. The orthogonal distance re-
                                                                       gression resulted in slopes close to the one-to-one line for
                                                                       shrublands and savannas and grasslands, indicating reason-
                                                                       able agreement. Fire duration was clearly underestimated for
                                                                       forested ecosystems with high fuel loads, as fires may con-
                                                                       tinue to smolder for days (resulting in active-fire detections)
                                                                       after the fire has stopped expanding.
                                                                           The comparison of Global Fire Atlas data to a small
                                                                       dataset (n = 15) of daily perimeters of large wildfires in pri-
                                                                       marily forested cover types mapped by the US Forest Service
                                                                       yielded good correspondence between estimates of fire size,
                                                                       duration and expansion rate (Fig. 7). The improved compar-
                                                                       ison of fire size (cf. Figs. 5a and 7a) could be related to the
                                                                       US Forest Service data being more accurate than MTBS but
                                                                       likely also represents the good performance of the Global
                                                                       Fire Atlas (e.g., compare Fig. 7a, b, and c to d, e, and f)
                                                                       and underlying burned-area products (Fusco et al., 2019) for
                                                                       relatively large fires. In contrast to the suggested underesti-
                                                                       mate of fire duration shown in Fig. 6a, these data suggest
Figure 4. Global comparison of burn dates derived from the             the Global Fire Atlas may slightly overestimate fire duration.
MCD64A1 burned-area product, the Global Fire Atlas and VI-             This difference may reflect the fact that active-fire detections
IRS active-fire detections (2012–2016). (a) Forests, (b) shrublands,   may be triggered by smoldering while the burned-area prod-
(c) woody savannas, and (d) savannas and grasslands. Negative val-
                                                                       uct will only register the initial changes in surface reflectance
ues indicate pixels with a burned-area day of burn earlier than the
corresponding VIIRS active-fire detection, zero indicates no differ-
                                                                       from fire. Both comparisons (Figs. 6, 7b and e) suggest the
ence in day of burn between both datasets, and positive numbers        Global Fire Atlas may overestimate the duration of smaller
indicate a delayed detection of burned-area compared to active-fire    fires with relatively short duration, likely based on the un-
detections.                                                            certainty in underlying burn dates. Based on a small under-
                                                                       estimate of overall burned area and an overestimate of fire
                                                                       duration by the Global Fire Atlas, the average daily fire ex-
originated both from the underlying burned-area datasets and           pansion rates based on US Forest Service data were higher
the methodologies (Fig. B2). For this particular grassland in          than estimates based on Global Fire Atlas data (Fig. 7c and
Kansas, the MCD64A1 product estimated less burned area                 f).
compared to the Landsat-based MTBS dataset, resulting in
fragmentation of larger burn scars into disconnected patches.          3.2   Characterizing global fire regimes
However, the daily temporal resolution of the MCD64A1
burned-area product allowed for recognition of individual ig-          Over the 14-year study period, we identified 13 250 145 in-
nition points within larger burn patches of fast-moving grass-         dividual fires with an average size of 4.4 km2 (Table 1) and
land fires that cannot be separated using infrequent Land-             minimum size of one MODIS pixel (21 ha or 0.21 km2 ). On
sat imagery (Fig. B2). In addition, the 30 m spatial resolu-           average, the largest fires were found in Australia (17.9 km2 ),
tion of the MTBS perimeters may result in more irregular-              boreal North America (6.0 km2 ) and Northern Hemisphere
ity and therefore in longer fire perimeter estimates compared          Africa (5.1 km2 ), while Central America (1.7 km2 ), equato-
to the 500 m resolution Fire Atlas perimeters. Combined,               rial Asia (1.8 km2 ) and Europe (2.0 km2 ) had the smallest
these trade-offs in spatial and temporal resolution resulted           average fire sizes (Table 1). Spatial patterns of the number
in less agreement between fire perimeters in woody savannas            of ignitions and fire sizes were markedly different and often
(Fig. 5c) and savannas and grasslands (Fig. 5d).                       inversely related (Fig. 8). Burned area in agricultural regions
   Initial assessment of the accuracy of fire duration esti-           and parts of the humid tropics, particularly in Africa, resulted
mates from the Global Fire Atlas highlighted differences in            from high densities of fire ignitions and relatively small fires,
the sensitivity of satellite-based burned-area and active-fire         consistent with widespread use of fire for land management.
products to fire lifetime (Fig. 6). Similar to fire perimeters,        Large fires accounted for most of the burned area in arid re-
the best agreement in fire duration estimates was found for            gions, high latitudes, and other natural areas with low pop-
forests, where the Global Fire Atlas reproduced 51 % of the            ulation densities and a sufficiently long season of favorable
observed variance of the fire duration estimates based on              fire weather (Fig. 8).
combining MTBS fire perimeters with active-fire detections.

Earth Syst. Sci. Data, 11, 529–552, 2019                                                www.earth-syst-sci-data.net/11/529/2019/
N. Andela et al.: The Global Fire Atlas 537
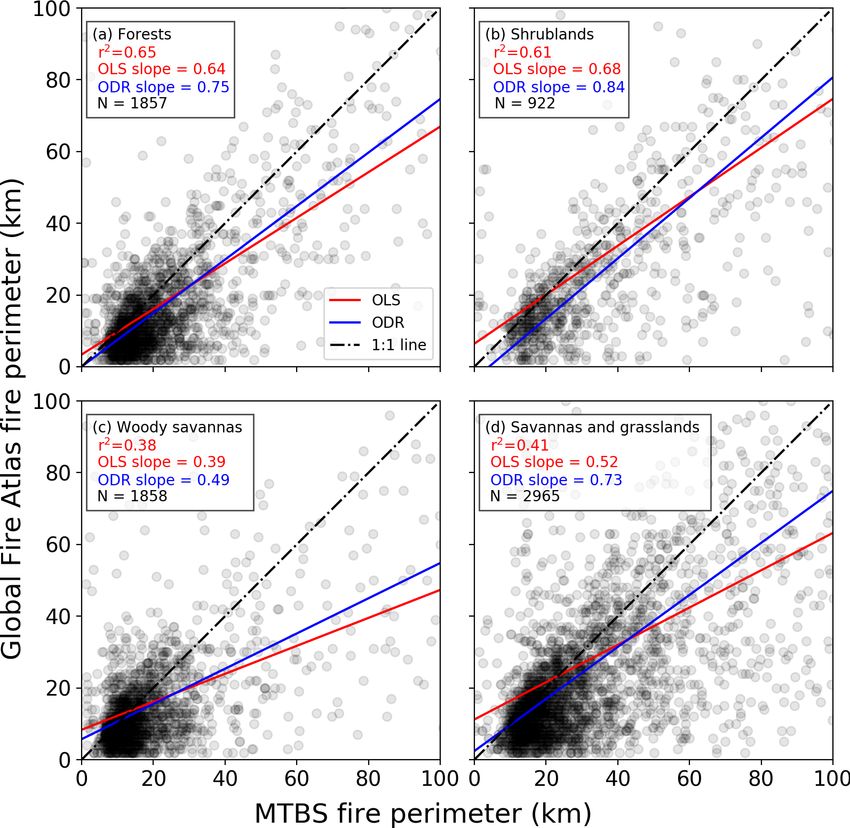
Figure 5. Comparison of fire perimeter estimates based on the Global Fire Atlas and MTBS for the continental US (2003–2015). (a) Forests,
(b) shrublands, (c) woody savannas, and (d) savannas and grasslands. Red lines indicate the slope between both datasets based on ordinary
least squares (OLS) with corresponding r 2 values, while blue lines are based on orthogonal distance regression (ODR). For the scatterplots,
darker gray or black indicates a greater density of points.
Global patterns of fire duration and expansion rates pro- found in Central America (0.3 km2 d−1 ), equatorial Asia
vide new insight about the occurrence of large fires, as the (0.3 km2 d−1 ) and Southeast Asia (0.4 km2 d−1 ; Table 1).
size of each fire (km2 ) is the product of fire duration (d) The fastest fires occurred in arid grasslands and shrub-
and daily fire expansion rate (km2 d−1 ). Individual fires that lands (Fig. 10a), where fuel structure, climate conditions
burned for a week or more occurred frequently across the and emergent properties of large wildfires contribute to high
productive tropical grasslands and in boreal regions (Fig. 9a, fire spread rates. Relatively high fire speeds were also ob-
Table 2). In these regions, fire duration exerted a strong con- served in some parts of the boreal zone, particularly in cen-
trol on fire size and total burned area. On average, human- tral and western Canada. The lowest fire velocities were ob-
dominated landscapes, such as deforestation frontiers or agri- served in infrequently burning humid tropical regions where
cultural regions, experienced smaller and shorter fires com- fire spread was influenced by higher fuel loads and humid-
pared to natural landscapes (Table 2). Fire duration was also ity (Table 1). At all scales, estimated fire direction exhibited
relatively short in semiarid grasslands and shrublands char- considerable complexity (Fig. 10b). With some regional ex-
acterized by high daily fire expansion rates, based on the ceptions, no clear dominant spread direction was found in
development of long fire lines (Fig. 9b and c) and high South America or Africa. Based on the underlying 500 m
velocity. In these semiarid regions, fire duration and size data layers, landscape structure and drainage patterns played
were likely limited by fuel availability and connectivity. In an important role in controlling individual fire spread direc-
line with these findings, the largest average daily expan- tion in the humid tropics. Fire spread direction also varied
sion rates were found in Australia (1.7 km2 d−1 ), Northern considerably within individual fires, and the dominant direc-
Hemisphere Africa (0.9 km2 d−1 ) and Southern Hemisphere tion typically represented less than half of the pixels. Fire
Africa (0.9 km2 d−1 ), and the smallest expansion rates were spread direction was more consistent in the arid tropics, as
demonstrated by the northwest and southeast orientation of
www.earth-syst-sci-data.net/11/529/2019/ Earth Syst. Sci. Data, 11, 529–552, 2019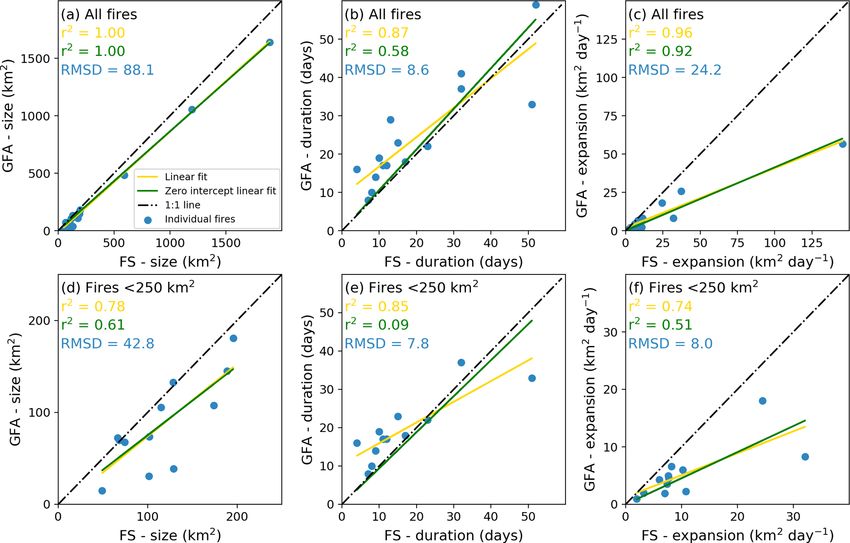
538 N. Andela et al.: The Global Fire Atlas
Figure 6. Comparison of fire duration estimates from the Global Fire Atlas and the combination of VIIRS active-fire detections within MTBS
fire perimeters for the continental US (2012–2015). (a) Forests, (b) shrublands, (c) woody savannas, and (d) savannas and grasslands. Red
lines indicate the slope between both datasets based on ordinary least squares (OLS) with corresponding r 2 values, while blue lines are based
on orthogonal distance regression (ODR). For the scatterplots, darker gray or black indicates a greater density of points. This comparison was
made for a subset of MTBS and Global Fire Atlas perimeters using selection criteria for perimeter overlap and VIIRS active-fire detections
described in Sect. 2.3.
fire spread in Australia, consistent with the dominant wind 2017). The largest fire in the Global Fire Atlas occurred
directions. At midlatitudes, we found evidence for more east- in northern Australia, burning across 40 026 km2 (about the
ward and westward fire progression in Europe and Asia and a size of Switzerland or the Netherlands) over a period of 72 d
northwest and southeast spread direction in North America, with an average speed of 19 km d−1 , following the 2007 La
broadly consistent with the orientation of mountain ranges Niña. The longest fires burned for over 2 months in sea-
and other topographic features within the key biomass burn- sonal regions of the humid tropics and high-latitude forests
ing regions. (Fig. 11b). Drought conditions in 2007 and 2010 caused mul-
tiple fires to burn synchronously for over 2 months across
tropical forests and savannas in South America. The highest
3.3 Fire extremes
fire velocities typically occurred in areas of low fuel loads.
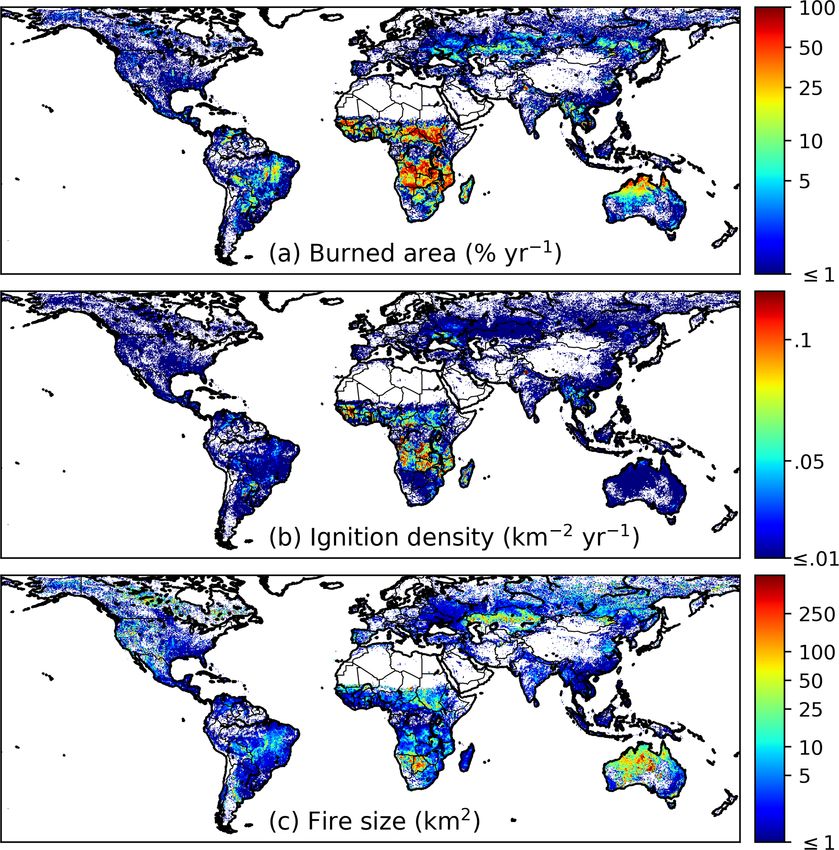
The world’s largest individual fires were mostly found While fires larger than 2500 km2 were nearly absent from
in sparsely populated arid and semiarid grasslands and arid grass and shrublands in North and South America, pat-
shrublands of interior Australia, Africa, and Central Asia terns of extremely fast-moving fires in arid grass and shrub-
(Fig. 11a). Strikingly, fires of these proportions were nearly lands were similar to other continents. Fast-moving fires also
absent in North and South America, possibly due to higher show evidence of synchronization, for example with several
landscape fragmentation and different management prac- extremely fast fires that burned across the steppe of eastern
tices, including active fire suppression. In arid regions of Kazakhstan during 2003 (Fig. 11c).
Southern Africa and Australia, large fires typically followed
La Niña periods (e.g., 2011 and 2012), when increased rain-
fall and productivity increase fuel connectivity (Chen et al.,
Earth Syst. Sci. Data, 11, 529–552, 2019 www.earth-syst-sci-data.net/11/529/2019/N. Andela et al.: The Global Fire Atlas 539 Figure 7. Comparison of Global Fire Atlas (GFA) and US Forest Service (FS) data for a selected number of large wildfires in the US. Comparison of (a) fire size, (b) duration and (c) average daily expansion rate for all fires (N = 15); (d), (e) and (f) are like (a), (b) and (c) but for fires smaller than 250 km2 (N = 12). Correlation coefficients are provided based on linear regression with (yellow) and without (green) an intercept, assuming a nonzero intercept could indicate a structural offset between both datasets. Root-mean-square deviations (RMSD) are reported in blue. Table 1. Fire attributes for each Global Fire Emissions Database (GFED) region during 2003–2016. Ignitions are the summed ignitions over the study period (2003–2016). For size, duration, expansion and speed we report the mean values for individual fires and also the mean weighted by fire size (the latter estimate is provided in parentheses). For ignitions, regions with over a million ignitions are shown in bold font and lower values in italic font. For other fire aspects, values equal to or above the global average are shown in bold font and below the global average in italic font. A map of the GFED regions is shown in Appendix B (Fig. B3a). GFED region Ignitions (2003–2016) Size (km2 ) Duration (d) Expansion (km2 d−1 ) Speed (km d−1 ) World 13 250 145 4.4 (395.9) 4.5 (14.7) 0.6 (14.5) 0.9 (3.2) Boreal North America 57 613 6.0 (202.8) 5.4 (23.3) 0.5 (6.8) 1.0 (4.3) Temperate North America 137 900 2.9 (136.7) 4.7 (13.4) 0.5 (8.8) 0.8 (3.7) Central America 229 245 1.7 (28.3) 4.3 (12.2) 0.3 (1.5) 0.7 (1.4) Northern Hemisphere South America 242 359 3.1 (50.1) 5.1 (12.4) 0.5 (3.3) 0.8 (2.1) Southern Hemisphere South America 1 320 177 3.0 (90.6) 4.7 (13.8) 0.5 (4.8) 0.7 (2.3) Europe 71 233 2.0 (30.7) 4.6 (10.3) 0.4 (2.7) 0.7 (2.0) Middle East 86 783 2.3 (22.0) 4.0 (9.8) 0.5 (2.1) 0.8 (1.9) Northern Hemisphere Africa 3 517 808 5.1 (186.2) 4.4 (14.7) 0.7 (8.6) 0.9 (3.0) Southern Hemisphere Africa 5 000 436 4.3 (232.5) 4.5 (13.5) 0.7 (9.6) 0.9 (2.6) Boreal Asia 363 279 3.7 (116.8) 4.5 (15.6) 0.5 (6.8) 1.0 (4.1) Central Asia 807 739 3.2 (339.7) 4.2 (11.5) 0.5 (22.7) 0.8 (5.6) Southeast Asia 937 810 2.2 (27.8) 4.1 (13.2) 0.4 (1.8) 0.7 (1.8) Equatorial Asia 117 870 1.8 (13.5) 5.5 (16.4) 0.3 (0.8) 0.7 (1.3) Australia and New Zealand 358 807 17.9 (2030.6) 5.0 (20.5) 1.7 (59.5) 1.2 (6.1) www.earth-syst-sci-data.net/11/529/2019/ Earth Syst. Sci. Data, 11, 529–552, 2019
540                                                                                                N. Andela et al.: The Global Fire Atlas

Table 2. Fire attributes by GFED fire type during 2003–2016. Ignitions are the summed ignitions over the study period (2003–2016). For
size, duration, expansion and speed we report the mean values for individual fires and also the mean weighted by fire size (the latter estimate
is provided in parentheses). For agriculture, we only included fires with greater than 90 % of burned area classified as cropland. For ignitions,
fire types with over a million ignitions are shown in bold font and lower values in italic font. For other fire aspects, values equal to or above
the global average are shown in bold font and below the global average in italic font. A map of the GFED fire types is shown in Appendix B
(Fig. B3b).

            GFED fire type      Ignitions (2003–2016)     Size (km2 )    Duration (d)     Expansion (km2 d−1 )      Speed (km d−1 )
            All                             13 250 145    4.4 (395.9)       4.5 (14.7)                0.6 (14.5)            0.9 (3.2)
            Boreal forest                      197 124    5.2 (149.2)       5.4 (20.1)                 0.6 (6.5)            1.0 (4.2)
            Temporal forest                    178 909     2.5 (84.1)       4.1 (14.0)                 0.4 (4.2)            0.8 (2.8)
            Deforestation                      909 826     1.4 (28.7)       3.8 (13.7)                 0.3 (1.4)            0.6 (1.4)
            Savanna                          9 809 719    5.1 (447.5)       4.6 (14.9)                0.7 (16.2)            0.9 (3.4)
            Agriculture                      1 631 918     1.4 (26.4)       3.4 (10.3)                 0.3 (2.0)            0.7 (1.9)

Figure 8. Average global burned area (MCD64A1), ignition den-              Figure 9. Average fire duration (a), fire line length (b) and daily ex-
sity and fire size over the study period 2003–2016. For any given          pansion (c) over the study period 2003–2016. Fire size (see Fig. 8c)
location, burned area in panel (a) can be represented as the product       is the product of fire duration (a) and daily fire expansion (c).
of ignitions per year shown in (b) and fire size shown in (c).

                                                                           the burned area resulted from a small number of large fires
4   Discussion                                                             (Fig. 8). Fire sizes declined along gradients of increasing
                                                                           rainfall and human activity, with larger numbers of small fires
The Global Fire Atlas is the first freely available global                 in the humid tropics or other human-dominated landscapes.
dataset to provide daily information on seven key fire charac-             Multiday fires were the norm across nearly all landscapes,
teristics: ignition timing and location, fire size and duration,           with some large fires in productive tropical grasslands and
and daily expansion, fire line length, speed, and direction of             boreal regions burning for over 2 months during drought pe-
spread based on moderate-resolution burned-area data. Over                 riods (Fig. 11). The dominant control on fire size also var-
the 2003–2016 study period, we identified over 13 million                  ied across ecosystems: fire duration was the principal con-
individual fires (≥ 21 ha) (Table 1). Characteristics of these             trol on fire size in boreal forests, whereas fuels limited the
fires varied widely across ecosystems and land use types. In               size of fast-moving fires in arid grasslands and shrublands
arid regions and other fire-prone natural landscapes, most of              (Figs. 9 and 10). Characterizing fire behavior across large

Earth Syst. Sci. Data, 11, 529–552, 2019                                                      www.earth-syst-sci-data.net/11/529/2019/
N. Andela et al.: The Global Fire Atlas 541 Figure 10. Average fire speed (a) and the dominant direction of fire spread (b) over the study period 2003–2016. For each 0.25◦ grid cell the direction was estimated as the dominant fire spread direction of fires larger than 10 km2 within the grid cell. We focused on larger fires (≥ 10 km2 ) to determine the dominant spread direction because large fires will generally express a clearer spatiotemporal structure of fire spread at a 500 m daily resolution. Pie charts show the fraction of individual larger fires (≥ 10 km2 ) by dominant spread direction for each continent. scales is key for understanding fire–vegetation feedbacks, 2015). Our findings suggest that an increase in the length emissions estimates, fire prediction and effective fire man- of the fire season may be the dominant driver for increases agement, as well as for building mechanistic models of fires in fire activity in these ecosystems, as fire duration was a within ecosystem models. Satellite remote sensing has been strong control on eventual fire size and burned area (Figs. 8, widely used to characterize global pyrogeography (Archibald 9 and 11). Investigating fire–climate interactions and human et al., 2013) and fire–climate interactions (Westerling et al., controls on burned area using the Fire Atlas data layers will 2006; Alencar et al., 2011; Morton et al., 2013a; Field et al., benefit management efforts and scientific investigations, as 2016; Young et al., 2017). Despite this progress, large-scale fire alters vegetation structure (Bond et al., 2005; Staver et understanding of individual fire behavior has remained lim- al., 2011), biogeochemical cycles (Bauters et al., 2018; Pel- ited by the availability of consistent global-scale data prod- legrini et al., 2018) and climate (Randerson et al., 2006; Ward ucts. Analysis and future refinement of the Global Fire Atlas et al., 2012). may be useful in this context, providing new insight about The Global Fire Atlas provides several new constraints the response of fires to different global change drivers. that could improve the representation of fires in ecosystem Both climate and human activity exert a strong control on and Earth system models. Fire models embedded in dynamic global burned area (Bowman et al., 2009) and contribute to vegetation models are important tools for understanding the rapidly changing fire regimes worldwide (Jolly et al., 2015; changing role of fires in the Earth system and the impacts Andela et al., 2017; Earl and Simmonds, 2018). Moreover, of fires on ecosystems (Hantson et al., 2016; Rabin et al., increasing human presence in fire prone ecosystems requires 2017). Most global models of fire activity are calibrated us- increased efforts to actively manage fires for ecosystem con- ing satellite-derived estimates of total burned area or active servation and human well-being (Moritz et al., 2014; Knorr fires (Hantson et al., 2016), rather than individual fire char- et al., 2016). The ignition location, spread and duration of acteristics such as fire size. As a result, many of these fire individual fires can be used to address new questions in the models capture the spatial distribution of global fire activ- field of fire–climate interactions and the changing influence ity but not burned-area trends (Andela et al., 2017) or the of human activity on fire behavior, as each of these metrics interannual variability that may occur as a consequence of may respond differently to variability or change. For exam- changes in fire spread rate or duration. Models range from ple, recent studies have suggested that climate warming and simple empirical schemes to complex, process-based repre- drying may increase fire size and burned area in the tropics sentations of individual fires (Hantson et al., 2016; Rabin et (Hantson et al., 2017) and at higher latitudes (Yang et al., al., 2017). Process-based models estimate burned area as the www.earth-syst-sci-data.net/11/529/2019/ Earth Syst. Sci. Data, 11, 529–552, 2019
542                                                                                           N. Andela et al.: The Global Fire Atlas

                                                                         behavior (van Leeuwen and van der Werf, 2011; Parker et
                                                                         al., 2016; Reisen et al., 2018), while improved knowledge of
                                                                         fire–climate interactions is crucial for emissions forecasting
                                                                         (Di Giuseppe et al., 2018).
                                                                            The Global Fire Atlas methodology builds on a range of
                                                                         previous studies that have used daily moderate-resolution
                                                                         satellite imagery to estimate individual fire size (Archibald
                                                                         and Roy, 2009; Hantson et al., 2015; Frantz et al., 2016; An-
                                                                         dela et al., 2017), shape (Nogueira et al., 2016; Laurent et
                                                                         al., 2018), duration (Frantz et al., 2016) and spread dynamics
                                                                         (Loboda and Csiszar, 2007; Coen and Schroeder, 2013; Sá
                                                                         et al., 2017). We provide the first fire-progression-based al-
                                                                         gorithm to map individual fires across all biomes, including
                                                                         the first global estimates of the timing and location of igni-
                                                                         tions, fire size and duration, and daily expansion, fire line
                                                                         length, speed, and direction of spread. Several previous stud-
                                                                         ies have estimated fire size distributions based on a flood fill
                                                                         algorithm, where all neighboring pixels within a certain time
                                                                         threshold are classified as the same fire (Archibald and Roy,
                                                                         2009; Hantson et al., 2015). Interestingly, we found simi-
                                                                         lar spatial patterns of fire size (cf. Fig. 8 and Archibald et
Figure 11. Location and year of the largest, longest and fastest fires   al., 2013; Hantson et al., 2015), although absolute estimates
over the study period 2003–2016. (a) Fires larger than 2500 km2 ,        may show large differences based on the “cutoff” value used
(b) fires longer than 60 d and (c) fires with an average veloc-          within the flood fill approach (Oom et al., 2016) and, to a
ity higher than 25 km d−1 . The background image depicts mean            lesser extent, based on the fire persistence threshold used
MODIS normalized difference vegetation index (NDVI, 2003–
                                                                         here. Spatial patterns of fire size and duration also compared
2016), an indicator for large-scale vegetation patterns and available
                                                                         favorably with estimates of Frantz et al. (2016) for south-
fuels.
                                                                         ern Africa (Fig. 9a) and estimates of fire speed by Loboda
                                                                         and Csiszar (2007) for Central Asia (Fig. 10a). Here, we
                                                                         compared our results to fire perimeter estimates from the
product of fire ignitions and size, while many models in-                MTBS (Eidenshink et al., 2007; Sparks et al., 2015). Moder-
clude a dynamic rate of spread to determine eventual fire                ate agreement was found for forested ecosystems and shrub-
sizes (e.g., SPITFIRE; Thonicke et al., 2010) but use arbi-              lands, but results differed more in grassland biomes (Fig. 5).
trary threshold values for key parameters such as fire dura-             Interestingly, we found that the poor agreement in grasslands
tion (Hantson et al., 2016). We found that global patterns of            stemmed from differences in the spatial and temporal resolu-
fire duration, ignition, size and rate of spread (i.e., speed) var-      tion of the burned-area estimates (Fig. B2). In line with pre-
ied widely across ecosystems and human land management                   vious studies, we found that the coarser resolution (500 m) of
types, and thus these Global Fire Atlas data products provide            the MODIS burned-area data used to develop the Global Fire
additional pathways to benchmark models of various levels                Atlas sometimes underestimated overall burned area (e.g.,
of complexity. While only a few models include multiday                  Randerson et al., 2012; Rodrigues et al., 2019; Roteta et
fires (e.g., Pfeiffer et al., 2013; Le Page et al., 2015; Ward           al., 2019), fragmenting individual large fires. However, the
et al., 2018), we found that multiday fires were the norm                Landsat-based MTBS data at 30 m resolution were unable to
across most biomes and that fire duration forms an important             distinguish individual fires within large burn patches of fast-
control on eventual fire sizes and burned area in many natu-             moving grassland fires based on infrequent Landsat satellite
ral ecosystems with abundant fuels. Similarly, many models               overpasses (Fig. B2).
assume relatively homogeneous fuel beds, while our results                  An initial accuracy assessment of Global Fire Atlas fire
suggest that landscape features and vegetation patterns result           perimeter estimates for the continental US revealed sev-
in highly heterogeneous fuel beds that form a strong con-                eral important limitations and opportunities for further de-
trol on fire spread (speed and direction). Large differences in          velopment of individual fire characterization using satellite
fire behavior across ecosystems and management strategies                burned-area data. In addition to the accuracy assessment of
may improve fire emissions estimates and emission forecast-              fire perimeters, we also investigated the temporal accuracy
ing, particularly when combined with active-fire detections              of the Global Fire Atlas (Fig. 4), as well as the fire dura-
to better characterize different fire stages including the smol-         tion estimates (Fig. 6) based on active-fire detections. Low
dering phase (Kaiser et al., 2012). Recent studies have shown            to moderate correlations (r 2 ranging from 0.3 to 0.5) were
that fire emission factors may vary widely depending on fire             found between Global Fire Atlas fire duration estimates and

Earth Syst. Sci. Data, 11, 529–552, 2019                                                  www.earth-syst-sci-data.net/11/529/2019/
You can also read