The Graduate School February 2021 Meeting Board of Trustees
←
→
Page content transcription
If your browser does not render page correctly, please read the page content below
• The Graduate School
 February 2021 Meeting
 • Board of Trustees

The Graduate School
The Graduate School at Clarkson University was reconstituted on July 1, 2016 after the
merger of Clarkson University and Union Graduate College (UGC) on February 1, 2016.

The Graduate School aims to:
(1) Expand the world reach and diversity of the Clarkson community
(2) Advance the prominence of research and scholarship enterprise
(3) Build a best-of-class admission, graduate and alumni experience that assures lifetime
    engagement
(4) Deliver a financial plan with net return on investment to ensure the successful
    implementation of fulfilling the University’s goals and strategies.

Annually, the Graduate School serves well over 1500 students, enrolled in over 60 research
and professional degree programs across three campuses (Potsdam, Capital Region,
Beacon) and Online.

                                                                                             2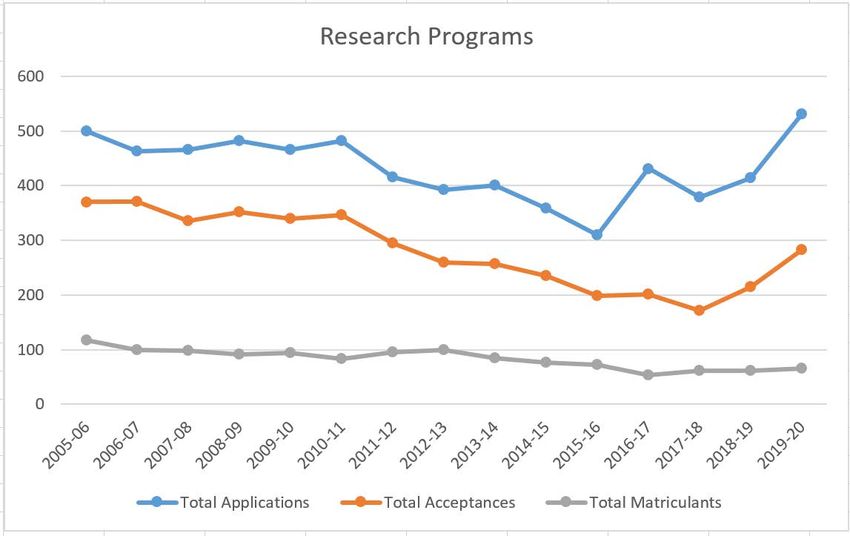
Graduate School
Admissions
Snapshot
(as of 1/4/2021)

Full spreadsheet included in data portal

Graduate programs recruit continuously, with
multiple entry terms in both semesters and
quarters. This is ongoing for AY 2021; thus,
enrollments will be higher than presented here.

Research programs are comprised mainly of
Potsdam based programs: Arts and Sciences,
Engineering (Potsdam), and Institute
for a Sustainable Environment

Professional programs comprised mainly of:
Business (Potsdam, CRC and Online),
Engineering (CRC), Health
Sciences (Potsdam), Education (CRC), and
Interdisciplinary (Beacon, CRC, Potsdam
and Online)

                                                  3
Graduate Enrollments, Revenue and Discount Rates Year-
To-Date Distributions
Graduate School Net Revenue Dashboard and Data for AY 2021 (as of 1/4/2021)
Academic Year 2020-2021 recruiting and admissions
continue for remaining terms. Data shown represent
enrollments, revenue and discount rates for YTD only.

Quarter-based programs continuing to recruit and enroll for
FY 2021 terms include Online MBA and Healthcare
Management and CRC Engineering.

Research programs are comprised mainly of
Potsdam based programs:
- Arts and Sciences
- Engineering (Potsdam)
- Institute for a Sustainable Environment

Research programs typically have higher
discount rates due to TAships which are not
revenue generating.

Professional programs comprised mainly of:
- Business (Potsdam, CRC and Online)
- Engineering (CRC)
- Health Sciences (Potsdam)
- Education (CRC)
- Interdisciplinary (Beacon, CRC, Potsdam and Online)

Professional programs typically have lower
discount rates and are greater revenue generating.

                                                                              4
Research Graduate Student GRE Score Trends
For applied, admitted and enrolled research graduate students

                                                                      Graduate Student GRE Scores(2009-2020)
                                                                              Admitted and Enrolled
General trends of GRE scores
over past 10 years are steady              170
for applied, accepted and matriculated
research graduate students.                165

Data for all research programs and         160
for domestic and international students.
                                           155

                                           150

                                           145

                                           140

                                           135

                                           130
                                                 2009   2010   2011     2012       2013    2014        2015      2016      2017       2018   2019   2020

                                                                  Applied Verbal          Applied Quantitative     Admitted Verbal
                                                                  Admitted Quantitative   Enrolled Verbal          Enrolled Quantitative

                                                                                                                                                           5
Graduate Research Program Student Enrollment Trends
Total graduate student applications, acceptances and matriculations into research programs

Trend of applications into graduate research programs
show a period of steadiness followed by a decline
from 2010 through 2015 then an increase post 2015.

Trend of total admitted students into graduate research
programs largely follow the application trends, mainly
a decline from 2010 through 2015 then an increase
post 2015.

Trend of total matriculated students into graduate
research programs show a steady trend through
around 2012 then a period of decline post 2013.

Note that the Clarkson-UGC merger was in 2016
and the Graduate School was reconstituted in the same
year and 2016-2017 was the first academic year
with the new structure in place.

                                                                                             6
Graduate Student Race and Ethnicity Trends
Counts and trends are for all graduate students across all programs
(Five year snapshot)
Graduate Student Race/Ethnicty Trends (2014-2019)
1000
900
Number of Students
800
700
600
500
400
300
200
100
0
2014-15 2015-16 2016-17 2017-18 2018-19
7Graduate Student Trends of Top Undergraduate
Institutions Attended (2017-2020)
For Professional Programs: For Research Programs:
8Impacts to Recruitment, Admissions and Retention
Covid Scholarships utilized in recruitment and admissions
Fall 2020: Nearly $250,000 of scholarship funds dispersed with 42 students received scholarship funds
Spring 2020: Nearly $215,000 of scholarship funds dispersed with 43 students received scholarship funds
Sum of Scholarship Scholarship Description
Acad Plan Covid 19 Alumni Relief-Fall CRC Covid19 Relief-Fall OT COVID19 Scholarship Grand Total
Covid-19 played a major role in admissions EM-MS $ 147,431 $ 147,431
and enrollment cycles for AY 2020 and MGMTD-MBA $ 13,759 $ 13,759
continues in AY2021. MGMT-MBA $ 41,586 $ 41,586
OT-MS $ 20,000 $ 20,000
Financial aid and scholarships to support recruitment PT-DPT $ 25,000 $ 25,000
and retention helped students during this difficult Grand Total $ 214,017 $ 13,759 $ 20,000 $ 247,776
period as students lost employment benefits and
financial means. Count of Scholarship Scholarship Description
Acad Plan Covid 19 Alumni Relief-Fall CRC Covid19 Relief-Fall OT COVID19 Scholarship Grand Total
International student recruitment and admissions was EM-MS 16 16
MGMTD-MBA 10 10
heavily impacted especially with the travel bans.
MGMT-MBA 6 6
OT-MS 5 5
PT-DPT 5 5
Grand Total 27 10 5 42
Sum of Scholar Scholarship Description
Acad Plan Covid19 Alumni Relief-Spring CRC Covid19 Alumni Relief-Wint GENG Covid-10 Alumi Scholarshi OT COVID19 Scholarship Grand Total
EM-MS $ 134,769.20 $ 134,769.20
MGMT-MBA $ 51,387.00 $ 51,387.00
MGMTD-MBA $ 21,547.00 $ 21,547.00
OT-MS $ 5,000.00 $ 5,000.00
CE-MS $ 1,665.60 $ 1,665.60
Grand Total $ 186,156.20 $ 21,547.00 $ 1,665.60 $ 5,000.00 $ 214,368.80
Count of ID Scholarship Description
Acad Plan Covid19 Alumni Relief-Spring CRC Covid19 Alumni Relief-Wint GENG Covid-10 Alumi Scholarshi OT COVID19 Scholarship Grand Total
EM-MS 16 16
MGMTD-MBA 15 15
MGMT-MBA 9 9
OT-MS 2 2
CE-MS 1 1
Grand Total 25 15 1 2 43 9Graduate Research Student Support
Financial support for research graduate students typically fall into two categories, namely Teaching
Assistantships (TAships) and Research Assistantships (RAships)
Teaching Assistantships reside in the individual schools and departments. Admission decisions and
Teaching Assistant assignments are made at the individual department levels. The number of
TAships across all programs is relatively constant.
Research Assistantships generally fall into several categories, mainly RAships supported by
externally funded research projects or internally supported research fellowships. For some
international students, RAships are also supported by the students’ host countries. Admissions
decisions and RA assignments are made at the program and department levels. The number of
RAships is impacted by external research funding and projects.
10Graduate School Outreach Efforts
In partnership with the academic programs, many initiatives are underway to grow our reach to increase quality
graduate students, including:
• Grad Fairs: Our counselors attended many more grad fairs than in past years, as all were virtual and costs were low.
We expanded geographically and added universities that have yielded students for us in recent years, based on our
enrollment data. Student attendance at events was not as high as hoped. Inquiry data continues to be reviewed to
determine strongest feeder programs.
• GRE test takers: We have been purchasing GRE test-taker lists and are adding these leads to our campaigns,
focusing on students whose profile matches our programs and admission standards.
• Webinars: Graduate Admissions is hosting more online info sessions for prospective students. This approach began
as a way to replace in-person Open Houses at CRC and has evolved. An advantage is that programs across
campuses now take part. Faculty participation definitely draws interest from prospective students.
• GFSD: We purchased a list of US citizens or permanent residents who have applied for the Graduate Fellowship for
STEM Diversity. They are included in marketing campaigns and direct outreach based on program of interest.
• FindAPhD.com: This is both domestic and international, and gives us a chance to advertise opportunities for specific
TA and RA positions. We purchased a bank of listings, so more will be posted as positions are approved.
• Unibuddy: We have created a graduate ambassador program so prospects are now able to connect with current
students. These result in leads for follow-up outreach.
11Graduate Student Yield Efforts
Responding to increasing pressures and challenges to yielding domestic applications and enrollments:
• GRE requirement: The pandemic has only increased the momentum for waiver requests related to the GRE. Current
undergraduate students grew up in an era of SAT-optional admission and they have come to expect test-optional
policies as graduate applicants. Also, in many studies, the GRE has not been strongly linked to graduate student
performance or degree completion.
• Timelines: Research indicates that students are most likely to accept the first offer of a funded admission. So, if our
funding decisions can be made earlier in the review cycle than we normally make them, we can impact yield.
• Time to decision: As mentioned above, getting decisions through admission committees quickly raises yield,
especially if paired with a funding offer. If funding information isn’t immediately available, it makes the most sense to
offer admission and partial funding, with clear information about when assistantship decisions will be finalized. We
are working with departments to clarify timelines related to this.
• Economy: In recent years, before the pandemic, the job market was strong and US students in STEM fields were
more likely to pursue employment than graduate study.
12Program Year
Type 2014-15 2015-16 2016-17 2017-18 2018-19 2019-20
Graduate School Completion Certificate
Master 147
32
363
13
297
11
392
54
348
55
397
All graduate degrees awarded 2015-2020 Phd - Professional 19 25 24 22 20 20
(does not include December 2020 completions)
Phd - Research 29 19 32 46 39 22
Grand Total 195 439 366 471 461 494
13Graduate School PhD Completions
PhDs Awarded AY2012-AY2020 (does not include December 2020 completions)
2011-12 2012-13 2013-14 2014-15 2015-16 2016-17 2017-18 2018-19 2019-20
ENGINEERING
Chemical Engineering 3 1 5 3 0 8 8 1 2
Civil & Env. Engineering 6 4 2 3 3 3 4 5 1
Electrical & Computer Eng 3 2 2 5 3 0 7 6 4
Engineering Science 1 0 3 1 0 0 4 1 0
Mechanical Engineering 2 7 4 6 2 3 8 4 5
Total Engineering 15 14 16 18 8 14 31 17 12
SCIENCES
Bioscience & Biotechnology - - 1 0 0 0 2 3 1
Chemistry 6 5 6 5 6 8 4 6 1
Computer Science 1 0 2 0 0 1 0 1 0
Mathematics 1 3 5 1 3 3 5 5 3
Physics 1 1 1 1 1 3 1 4 3
Total Sciences 9 9 15 7 10 15 12 19 8
INTERDISCIPLINARY (Including Institute for a Sustainable Environment)
Environmental Science & Eng 2 2 3 1 1 1 3 1 1
Materials Science & Engineering - 1 1 3 0 2 0 2 1
Total Other 2 3 4 4 1 3 3 3 2
TOTAL DEGREES AWARDED 26 26 35 29 19 32 46 39 22
14Admits That Didn’t Come To Clarkson Column Labels
Graduate Student Trends of Row Labels
DREXEL UNIVERSITY
2016 2017 2018 2019 2020 Grand Total
7 5 37 49
SUNY BINGHAMTON 5 25 27 11 13 81
Institutions Admitted UNIVERSITY OF TEXAS AT DALLAS
MISSOURI STATE UNIVERSITY
33 32 13 20 12
12
110
12
WESTERN MICHIGAN UNIVERSITY 12 12
Students Selected to UNIVERSITY OF HOUSTON
UNIVERSITY OF CENTRAL FLORIDA
38 5
27 10 20 10
10 53
67
Attend over Clarkson UNIVERSITY OF NEBRASKA-LINCOLN
BOSTON UNIVERSITY
PENNSYLVANIA STATE UNIVERSITY
2 5
8
10 7 19 10
10
10
17
18
46
NOVA SOUTHEASTERN UNIVERSITY 6 6
Top universities that graduate students who FORDHAM UNIVERSITY 16 6 22
FLORIDA STATE UNIVERSITY 22 6 28
were admitted to Clarkson eventually selected MISSOURI UNIVERSITY OF SCIENCE AND TECHNOLOGY 17 4 6 27
to attend instead of Clarkson STEVENS INSTITUTE OF TECHNOLOGY 6 26 10 2 6 50
COLUMBIA UNIVERSITY 3 3 3 5 14
(five year trend 2016-2020) UNIVERSITY OF COLORADO DENVER 5 5 10
UNIVERSITY OF MISSISSIPPI 5 5 10
LOUISIANA STATE UNIVERSITY - AG 18 5 23
UNIVERSITY OF CONNECTICUT 4 2 13 5 24
RUTGERS -THE STATE UNIVERSITY OF NJ -NEW BRUNSWIC 8 3 5 16
UNIVERSITY OF LOUISVILLE 11 5 5 21
SUNY UNIVERSITY AT ALBANY 19 10 4 28 5 66
UNIVERSITY OF TEXAS - SAN ANTONIO 5 5
TUFTS UNIVERSITY 4 5 9
MANHATTANVILLE COLLEGE-GRADUATE MASTER OF ARTS 4 4
UNIVERSITY OF KENTUCKY 18 6 4 28
UNIVERSITY OF SCRANTON 9 4 13
NORTHWESTERN UNIVERSITY 2 15 4 4 25
IONA COLLEGE 4 4
UNIVERSITY OF COLORADO BOULDER 2 4 6
CORNELL UNIVERSITY 2 4 4 4 14
LAMAR UNIVERSITY - BEAUMONT 6 5 4 15
UNIVERSITY OF TEXAS RIO GRANDE VALLEY 4 4
COLORADO SCHOOL OF MINES 13 4 17
UNIVERSITY OF CINCINNATI 7 6 4 17
VIRGINIA POLYTECH AND STATE UNIV 12 4 16
15Graduate Student Assistantships (Potsdam)
16Graduate International Student Mix
Master's PhD
Fall 2014 Fall 2015 Fall 2016 Fall 2017 Fall 2018 Fall 2019 Fall 2020 Fall 2014 Fall 2015 Fall 2016 Fall 2017 Fall 2018 Fall 2019 Fall 2020
ENGINEERING
USA 39 29 29 31 51 37 40 27 28 24 23 23 19 24
International 32 24 28 24 17 18 9 58 63 65 69 67 60 50
SCIENCES
USA 16 9 5 11 10 15 18 37 38 43 45 43 41 38
International 14 7 6 13 9 7 5 43 40 38 40 43 45 50
BUSINESS
USA 72 84 93 56 55 124 119 - - - - - 0 0
International 27 22 14 9 7 9 7 - - - - - 0 0
INTERDISCIPLINARY (Including Institute for a Sustainable Environment)
USA 101 130 149 142 211 241 205 9 7 5 3 2 4 5
International 11 20 22 23 33 29 15 10 7 8 9 7 6 7
TOTAL GRAD STUDENTS 312 325 346 309 393 480 418 184 183 183 189 185 175 174
Master's PhD
Fall 2014* Fall 2015 Fall 2016 Fall 2017 Fall 2018 Fall 2019 Fall 2020 Fall 2014* Fall 2015 Fall 2016 Fall 2017 Fall 2018 Fall 2019 Fall 2020
TOP 4 COUNTRIES
China 48 34 28 26 15 15 4 36 37 38 42 36 25 21
India 15 16 17 15 12 13 13 20 17 14 15 17 16 17
Sri Lanka 8 10 8 7 4 4 3 9 9 13 11 16 15 14
Iran 2 2 3 2 3 1 0 27 27 26 27 19 16 9
TOTAL INT'L STUDENTS 84 73 70 69 66 63 36 111 110 111 118 117 111 107
% OF INT'L STUDENTS 87% 85% 80% 72% 52% 52% 56% 83% 82% 82% 81% 75% 65% 57%
* Potsdam Campus Only, No CRC
** Does not include GHSC program
*** Online MBA program moved to CRC in Fall 2017, decreasing School of Business totals. 17Faculty Advising Load for PhD Students: Fall 2020 Snapshot
Total Faculty Advising Load Per Faculty
Faculty** Advising PhDs 1 PhD Student 2 PhD Students 3 PhD Students 4 PhD Students 5 PhD Students 6+ PhD Students
ENGINEERING
Chemical & Biomolecular Eng 10 8 2 4 1 1 - -
Civil & Environmental Eng 17 8 6 0 2 - - -
Electrical & Computer Eng 21 13 5 4 0 2 1 1
Mechanical & Aeronautical Eng 22 13 5 5 1 1 1 -
Total Engineering 70 42 18 13 4 4 2 1
SCIENCES
Biology 11 6 3 1 1 - - 1
Chemistry & Biomolecular Sci 8 7 0 2 1 - 2 2
Mathematics 11 10 6 1 1 0 2 1
Computer Science 8 6 3 1 0 0 1 1
Physics 6 5 2 3 2 - 1 -
Total Sciences 44 34 14 8 5 0 6 5
INTERDISCIPLINARY (Including Institute for a Sustainable Environment)
School of Arts & Sciences*** 35 1 1 - - - - -
School of Business 30 2 2 - - - - -
Inst for a Sustainable Environ 3 3 3 - - - - -
Institute for STEM Education 1 0 - - - - - -
Materials Science & Engineering 0 - - - - - - -
Total Other 69 6 6 0 0 0 0 0
TOTAL FACULTY ADVISING 183 82 38 21 9 4 8 6
* Includes both faculty members for co-advised students
** Total faculty includes assistant, associate and full professors
*** School of Arts & Sciences faculty other than those listed under Sciences
18Graduate Student Association
The Clarkson University Graduate Student Association (GSA) continued to build a strong graduate
student community, especially during the difficulty period when most of the students were not on
campus as a result of the Covid-19 restrictions.
GSA conducted many virtual events, both social and professional, over the semester – some events
drawing more student participation in the virtual setting.
19Questions
20You can also read