THE GREATER CAPE TOWN WATER FUND - BUSINESS CASE ASSESSING THE RETURN ON INVESTMENT FOR ECOLOGICAL INFRASTRUCTURE RESTORATION - The Nature Conservancy
←
→
Page content transcription
If your browser does not render page correctly, please read the page content below
THE GREATER CAPE TOWN WATER FUND
ASSESSING THE RETURN ON INVESTMENT FOR ECOLOGICAL INFRASTRUCTURE RESTORATION

BUSINESS CASE
NOVEMBER 2018
LEAD AUTHORS                                      CONTRIBUTING AUTHORS                           EDITOR
The Nature Conservancy                            Anchor Environmental Consultants               Yellowbrick
Louise Stafford, Daniel Shemie, Timm              Jane Turpie and Katherine Forsythe             Sonja Mitchell
Kroeger, Tracy Baker, Colin Apse

WITH SPECIAL THANKS TO
Mark Botha, Independent consultant; Gail Cleaver-Christie, CapeNature; Christine Colvin, World Wide Fund for Nature; Peter Flower, City of
Cape Town; Professor Graham Jewitt, University of Kwa-Zulu Natal; Gisela Keyser, City of Cape Town; David le Maitre, Council for Scientific
and Industrial Research; Kerri Savin, Nedbank; Johan van der Merwe, City of Cape Town; Professor Brian van Wilgen, Stellenbosch University

GENEROUS SUPPORTERS

STEERING COMMITTEE

PUBLIC PARTNERS

CONTACT
Ms. Louise Stafford, Director of Water Funds, South Africa | The Nature Conservancy
Block E, The Terraces, Steenberg Office Park | Cape Town, Western Cape, South Africa
Telephone: +27 21 201 7391 | Louise.Stafford@TNC.org

NATURE.ORG/CAPE-TOWN-WATER

                                                                                                    GREATER CAPE TOWN WATER FUND BUSINESS CASE   |1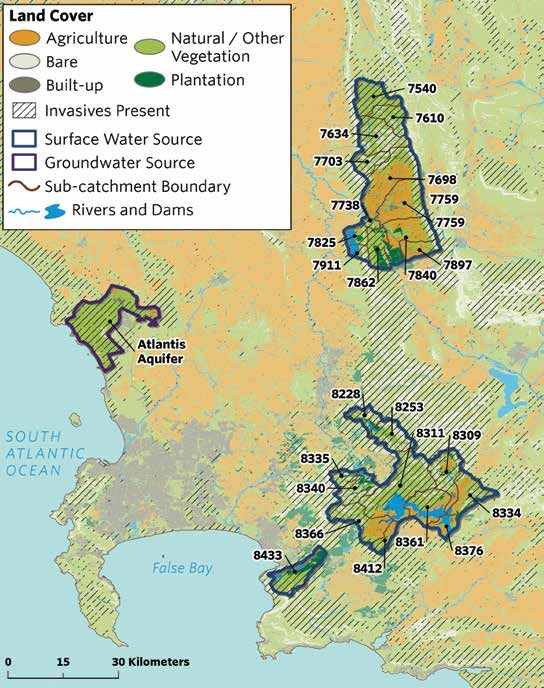
CONTENTS
       List of Figures...............................................................................................................................................................................3
       Abbreviations...............................................................................................................................................................................4
       Glossary.........................................................................................................................................................................................5
       Foreword........................................................................................................................................................................................6
       Executive Summary....................................................................................................................................................................8
            The role of the Greater Cape Town Water Fund......................................................................................................10
       Introduction..................................................................................................................................................................................11
             From source to tap...........................................................................................................................................................12
             Ecological infrastructure.................................................................................................................................................12
             A Water Fund for the Greater Cape Town Region...................................................................................................13
             Bridging the gap................................................................................................................................................................14
       The Western Cape Water Supply System............................................................................................................................15
            Demand to outstrip supply............................................................................................................................................16
            The high cost of “new” water........................................................................................................................................17
            Where the water comes from.......................................................................................................................................18
            Alien plant invasion.........................................................................................................................................................19
            Current initiatives to control invasive alien plants in the WCWSS.....................................................................22
       Evaluating the cost competitiveness of catchment restoration.....................................................................................24
            Six-step analysis...............................................................................................................................................................26
            Summary............................................................................................................................................................................38
       Additional ecological infrastructure interventions to secure water.............................................................................39
            Wetland restoration........................................................................................................................................................39
            Managing decommissioned forestry areas...............................................................................................................41
            Opportunity cost of decommissioning the plantations..........................................................................................42
       		 Case Study – Steenbras a City of Cape Town owned plantation............................................................................42
       Next steps for the Greater Cape Town Water Fund..........................................................................................................43
       Conclusion....................................................................................................................................................................................44
       Appendices
           A. Return on investment methodology......................................................................................................................46
           B. Water management legislative and regulatory environment..........................................................................47
           C. Technical studies.........................................................................................................................................................47
           D. Models used for analysing water losses due to invasive plants.....................................................................48
               Description of WR2005 software
       		 Description of ResSim model
           E. Unit Reference Value..................................................................................................................................................49
           F. Scenarios........................................................................................................................................................................50
           G. Wetland prioritisation criteria.................................................................................................................................51
           H. DEA Environmental Programmes and links.........................................................................................................52
           I. Sources for spatial data...............................................................................................................................................52
       Notes..............................................................................................................................................................................................53
       Photo Credits...............................................................................................................................................................................55

2   | GREATER CAPE TOWN WATER FUND BUSINESS CASE
LIST OF FIGURES
EXECUTIVE SUMMARY
Figure E1: Water supply gain and unit cost (URV) comparison between different
      catchment restoration and other supply options....................................................................................................9

MAIN SECTION
Figure 1: The population is growing while water supply has flatlined...........................................................................11
Figure 2: Example of black wattle tree invasion by Theewaterskloof dam..................................................................12
Figure 3: A Water Fund is a funding and governance mechanism that enables water users
      to invest collectively in catchment restoration alongside upstream communities.........................................14
Figure 4: Western Cape Water Supply System users include the Cape Town metropolitan area,
      the agricultural sector, smaller municipalities, and communities.......................................................................15
Figure 5: Share of water demand in the Western Cape Water Supply System..........................................................16
Figure 6: Unit cost comparison and estimated water yield potential of grey infrastructure
      solutions under consideration by the city..................................................................................................................17
Figure 7: Over two-thirds of sub-catchments are invaded by alien plants..................................................................19
Figure 8: Pine tree invasion.......................................................................................................................................................20
Figure 9: Invasive alien plant coverage of surface water sub-catchments, showing percentage
      of sub-catchment where invasive plants are present and the percentage of sub-catchment
      with condensed invasive plants....................................................................................................................................21
Figure 10: Estimating the cost competitiveness of catchment restoration by
      invasive alien plants (IAP) removal involved a series of analyses.......................................................................25
Figure 11: Invasive alien plant density distribution across the sub-catchments.........................................................27
Figure 12: Current water yield reduction as a result of alien plant invasion in the sub-catchments.....................28
Figure 13: Estimated water yield reduction could double within 30 years without
      the modeled invasives control programme...............................................................................................................29
Figure 14: Invasive plants are already established over expansive areas in the WCWSS........................................30
Figure 15: Clearing cost is made up of different components.........................................................................................31
Figure 16: Environmental conditions such as rugged terrain and steep cliffs impact on cost.................................32
Figure 17: Priority sub-catchments identified for delivering the highest ROI..............................................................34
Figure 18: Discounted restoration timeline for priority sub-catchments.....................................................................35
Figure 19: Water supply gain and unit cost (URV) comparison between
      different catchment restoration and other supply options...................................................................................38
Figure 20: Wetlands play an important role in catchment hydrology...........................................................................39
Figure 21: Priority wetlands in the WCWSS.........................................................................................................................40
Figure 22: The Steenbras plantation causes water yield reduction of 1.2 Mm3..........................................................42

                                                                                                                                         GREATER CAPE TOWN WATER FUND BUSINESS CASE     |3
ABBREVIATIONS
       CSIR.................................................. Council for Scientific and Industrial Research

       DEA................................................... Department of Environmental Affairs

       DWS................................................. Department of Water & Sanitation

       DWAF............................................... Department of Water Affairs and Forestry

       EI........................................................ Ecological Infrastructure

       IAP.................................................... Invasive alien plant

       GCTWF............................................ Greater Cape Town Water Fund

       GEF.................................................... Global Environmental Facility

       GIS..................................................... Geographic Information Systems

       MAR.................................................. Mean Annual Run-off

       MLD.................................................. Million liters per day

       MTO.................................................. Mountain to Ocean

       NPV .................................................. Net Present Value

       PD...................................................... Person-day

       ROI.................................................... Return on Investment

       R......................................................... South African rand

       SANBI............................................... South African National Biodiversity Institute

       TMG.................................................. Table Mountain Group

       TNC................................................... The Nature Conservancy

       WCWSS........................................... Western Cape Water Supply System

       WFW................................................ Working for Water

       WMA................................................ Water Management Area

       UBCEG............................................. Upper Breede Collaborative Extension Group

       URV................................................... Unit Reference Values

       USD................................................... United States dollar

4   | GREATER CAPE TOWN WATER FUND BUSINESS CASE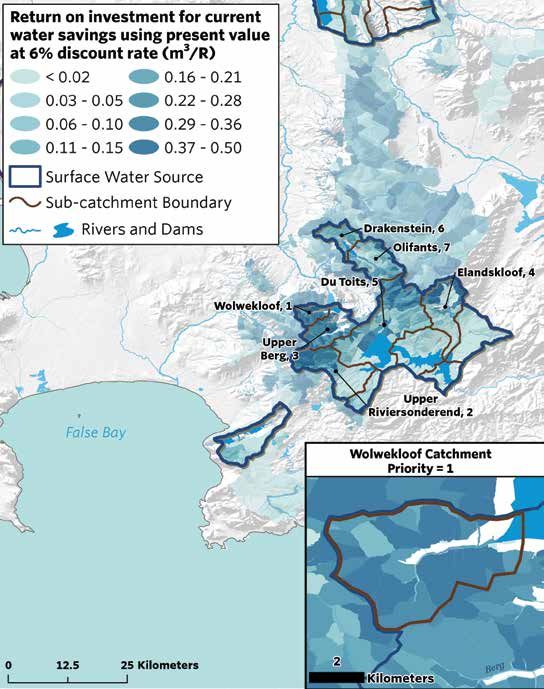
GLOSSARY
Currency                                                           Millions of cubic meters (Mm3)
All monetary values are expressed primarily in South African       The default volumetric unit of water in this document is the
rand (R) and if United States dollars (USD) are used they are      cubic meter, typically expressed in millions given the large
based on the late October, 2018 exchange rate.                     volumes of water discussed in this document. One cubic
                                                                   meter is equivalent to 1000 liters, making the conversion
Catchment                                                          quite simple.
Catchment is the area of land that drains water from a divide
or ridge to an outlet location such as a stream channel,           Unit reference value (URV)
which may also lead into waterbodies such as bays or dams.         The URV was developed by the South African Department of
The word catchment is used interchangeably with the terms          Water Affairs as a means of comparing the cost of delivering
watershed and drainage basin                                       water from different water supply schemes, by estimating
                                                                   the cost in rands of delivering one cubic meter of water.
Dam                                                                The URV of a project is calculated by dividing the present
Dam is an artificial body of water used for water storage          value of the total cost of the infrastructure (construction,
before it is supplied for later use. This report follows the       maintenance, operational) by the discounted stream of
terminology used in South Africa. Therefore, the term “dam”        water generated over the economic life of the project. It
is used to describe what might be termed a “reservoir” in the      therefore does take the growth in savings over time into
USA and many other countries.                                      account, making it comparable to other investments.

Discount Rate                                                      Water Fund
Refers to the interest rate used in discounted cash flow           A Water Fund is a funding and governance mechanism
analysis to determine the present value of future cash flows.      that enables water users to provide financial and technical
                                                                   support collectively in catchment restoration alongside
Ecological infrastructure                                          upstream communities.
Ecological infrastructure is the nature-based equivalent of grey
                                                                   Water security
or engineered infrastructure. It forms and supports a network
of inerconnected structural elements such as catchments,           Societies can enjoy water security when they successfully
rivers, riparian areas and natural corridors supporting habitats   manage their water resources and services to: satisfy
and movement of animals and plants.1                               household water and sanitation needs in all communities;
                                                                   support productive economies in agriculture, industry,
Ecosystem services                                                 and energy; develop vibrant, livable cities and towns;
The benefits people obtain from ecosystems. The Millennium         restore healthy rivers and ecosystems; and build resilient
Ecosystem Assessment 2 categorised ecosystem services as           communities that can adapt to change.
provisioning, regulating, cultural, and supporting services.
                                                                   Wetland
Greater Cape Town Region                                           Land which is transitional between terrestrial and aquatic
For the purpose of this document, the Greater Cape Town            systems where the water table is usually at or near the
Region refers to the service area of the Western Cape              surface, or the land is periodically covered with shallow
Water Supply System (WCWSS) and includes the Cape                  water, and which land in normal circumstances supports
Town Metropolitan area, the agricultural sector, and smaller       or would support vegetation typically adapted to life in
municipalities and communities who depend on the                   saturated soil.3
WCWSS for their water supply.

Invasive alien plants
Invasive alien plants are introduced vegetation that
is non-native to an ecosystem, and which may have
adverse economic and environmental impacts.
They can impact negatively on biodiversity through
competition and disrupt local ecosystems and
ecosystem function.

                                                                                                 GREATER CAPE TOWN WATER FUND BUSINESS CASE   |5
FOREWORD
       By Dr. Guy Preston, Deputy Director-General of Environmental Affairs, National Resources Management Programme

       The summer of 2017/18 saw the cumulative impact           likely be seen to be some combination of building
       of one of the worst recorded droughts in the south-       new dams, raising the walls of existing dams, building
       western Cape. Unprecedented restrictions were put         desalination plants, water transfers, groundwater
       in place, to curtail the use of water by agriculture,     abstraction, water re-use, rainwater harvesting
       industry, residential use and others. Human population    and other choices. Catchment management — and
       has grown at a high rate; industry has grown;             particularly the control of certain invasive alien plant
       water quality has declined; redressing the political      species — is one of the other choices.
       devastation of apartheid demands more water to be
       used by those so callously denied in the past, and the    The difficulty that the authorities have is that
       spectre of climate change looms large. The authorities    understanding the real costs and benefits of the
       have been compelled to confront the social, economic      different interventions is complex. There is also a
       and ecological choices for water security.                tendency to look at simplistic financial costs, rather
                                                                 than understanding the externalities associated with
       There is no doubt that demand-side management             each choice that can indicate more accurately where
       of water is the first obvious step in seeking water       investments should be made, and which may be
       security (including addressing “unaccounted-for”          sustainable in the long-term.
       water — that lost to leaks, poor metering and theft).
                                                                 A resource-economic assessment of choices will
       However, it is not sufficient on its own. There will be   confirm that the management of catchments, and
       a need to augment the supply of water over time,          particularly the control of invasive plants in our
       and the authorities face some difficult choices in        mountains (the “water factories”), riparian areas,
       deciding what interventions to prioritise. These will     wetlands and groundwater-recharge areas, is

6   | GREATER CAPE TOWN WATER FUND BUSINESS CASE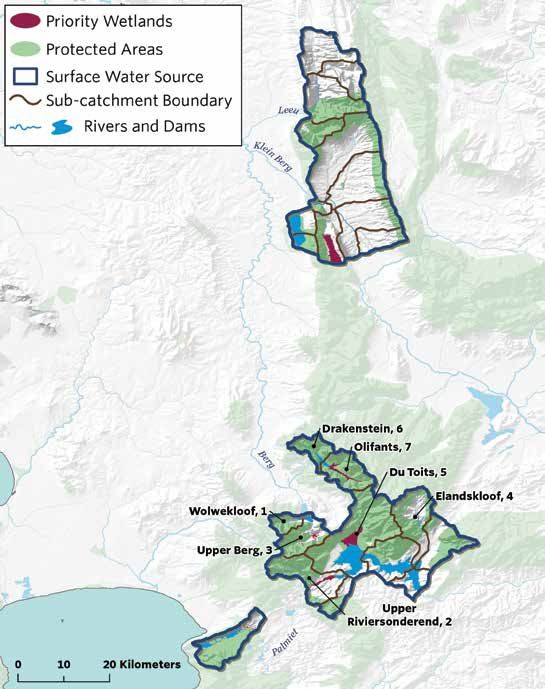
essential. Other than for demand-side management,          management. Based on compelling data that can
it has the highest return on investment. Moreover, a       inform authorities and the public alike about their real
failure to do the work timeously will lead to escalating   choices, it may well bring on board the private sector
costs, as invasive plants spread and grow.                 in supporting the authorities to address priority sub-
                                                           catchments, and restore the ecological infrastructure
The knee jerk responses of building a new dam              for optimal outcomes. It may also enable us to find
or desalination plant are not truly alternatives to        a better combination of incentives, disincentives
catchment management. Desalination plants are              (including the application of our laws), advocacy and
expensive and can never address agricultural needs.        research, in our quest to address the decline of our
Building new dams is difficult and does not solve the      life-support systems.
problem of the supply needed to fill the dams.
                                                           The Working for Water programme is a
The old Department of Forestry used to be                  partnership intervention of the Departments of
responsible for managing catchments, and without           Environmental Affairs, of Water and Sanitation, and
their work our task would be almost impossible now.        of Agriculture, Forestry and Fisheries, as well as
The Government’s Working for Water programme               various partner entities such as the South African
picked up the dropped baton in 1995, and has cleared       National Biodiversity Institute, the Water Research
some 3.3 million hectares of land across the country.      Commission, the Council of Scientific and Industrial
But the invasives are still spreading faster than they     Research, and the Agricultural Research Council. We
are being controlled, and particularly in the more         welcome the call for action represented in the Greater
inaccessible areas like our mountain catchments.           Cape Town Water Fund, and will seek to align our
The Greater Cape Town Water Fund is a most                 ongoing efforts to mutual benefit. Done well, this may
welcomed intervention to present the business              well be a model for similar interventions in other key
case for a return on investment in catchment               areas across the country.

                                                                                      GREATER CAPE TOWN WATER FUND BUSINESS CASE   |7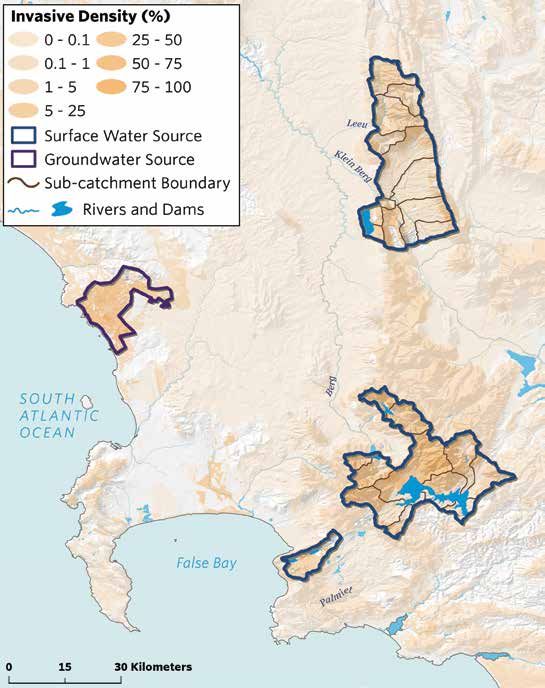
EXECUTIVE SUMMARY
       This Business Case puts forward ecological               THE CASE FOR ECOLOGICAL
       infrastructure restoration as a critical component
       of efforts to enhance water security for all users of    INFRASTRUCTURE
       the Western Cape Water Supply System (WCWSS).            While until recently the focus has been on “grey”, or
       Funding and coordination of restoration will be          engineered, infrastructure solutions to combat water
       catalysed by a collective action Water Fund that         scarcity, there is another cost-effective option with
       pools financial support across multiple public and       the potential to augment water supply. Long-term
       private water users and others interested in             water security in the Greater Cape Town Region, as
       ecological infrastructure solutions to Greater Cape      elsewhere, begins at the source with the ecological
       Town’s water challenges.                                 infrastructure (native vegetation, wetlands, etc.) that
                                                                regulates source water quality and supply.
       AVOIDING DAY ZERO                                        Over two-thirds of the sub-catchments supplying
       Water security is a major concern for the City of Cape   the WCWSS are affected by alien plant invasions,
       Town which faced the possibility of running out of       reducing the amount of water that reaches the rivers
       water following a three-year drought between 2015        and dams that feed the region by 55 billion liters
       and 2018. The day the taps would run dry, dubbed         (55 Mm3) per year. In a place where every drop of
       “Day Zero”, was narrowly avoided but the threat          water counts, these losses are significant. These
       remains. Cape Town’s population is growing fast, at      plants, trees such as pine and eucalyptus, quickly
       a rate of about 2.6% a year, while climate models        replace native species if unmanaged and threaten the
       show decreased rainfall accompanied with increased       diversity of native plant life in the Cape Floral Region,
       temperatures in the future, increasing the risk of       where 70% of plants are found nowhere else on the
       water shortages.                                         planet, and alter the habitat for the region’s fauna.
                                                                Invasive alien plants alter soil ecology, increase the
       Water demand is predicted to outstrip current supply     frequency and severity of wildfires and significantly
       in the Greater Cape Town Region by 2021. Current         impact river flow and aquifer recharge.
       forecasts suggest that an additional 300 - 350
       million liters (0.3 – 0.35 million cubic meters) of      Despite ongoing efforts to remove invasive trees by
       water a day will be needed by 2028 to ensure supply      programmes such as Working for Water, the problem
       meets demand. Over R8 billion ($540 million USD          is increasing. In response, a coalition of partners —The
       at the late October 2018 exchange rate) in public        Nature Conservancy, National Department of Water
       funding is being considered for augmenting water         and Sanitation, National Department of Environmental
       supply through investments in deep aquifer drilling,     Affairs (Environmental Programmes), Provincial
       desalination, water reuse and increased surface water    Department of Environmental Affairs and Development
       storage to meet the required demand.                     Planning, City of Cape Town, SANBI, CapeNature,
                                                                Coca-Cola Peninsula Beverages, Nedbank, Remgro Ltd,
                                                                and WWF — came together under the auspices of the
                                                                Greater Cape Town Water Fund Steering Committee.
                                                                The Committee commissioned studies to evaluate
                                                                the impact of nature-based solutions on water supply,
                                                                beginning with targeted removals of alien plant
                                                                invasions, and determine whether investing at scale in
                                                                catchment restoration is cost competitive with other
                                                                supply-side solutions.

                                                                .

8   | GREATER CAPE TOWN WATER FUND BUSINESS CASE
RETURN ON INVESTMENT ANALYSIS AND RESULTS
The business case analysis models a 30-year period, scenario. Importantly, invasive alien plant removal
discounting both costs and water gains at 6% for would already yield up to an additional 50 billion liters
surface water sub-catchments. (50 Mm3) within five years. Approximately 350 job
opportunities will be created in the first five years of
A six-step process was followed to identify priority implementation, as removing alien plant invasions is
source water sub-catchments for invasive alien very labour intensive.
plant removal and to understand the return on
investment associated with implementing these Catchment restoration is significantly more cost-
interventions at scale effective than other water augmentation solutions,
supplying water at one-tenth the unit cost of
Seven of the twenty-four sub-catchments were alternative options (Figure E1).It produces greater
identified as priorities for invasive alien plant removal. water yields than all other supply options except
They comprise a total of 54,300 hectares and are the desalination, which is far more costly. The results of
sub-catchments for Wemmershoek, Theewaterskloof, catchment restoration programmes will be evident
and Berg River dams. rapidly, with improved supply showing as soon as the
Results show that investing R372 million here ($25.5 first winter rains. Furthermore, catchment restoration
million USD; present value) will generate expected produces water yield gains into perpetuity if areas
annual water gains of 100 billion liters (100 Mm3) cleared of invasive alien plants are maintained.
within thirty years compared to the business as usual
CATCHMENT RESTORATION INCREASES WATER
SUPPLY AT THE LOWEST UNIT COST
Removal of IAPs in 7 Priority Sub-Catchments
Desalination
Groundwater Exploration
Water Reuse
Voelvlei Storage Scheme
Cease Forestry Steenbras
0 10 20 30 40 50 60
Unit Cost (URV in Rand/m3) Additional Water (Mm3/year)
Figure E 1. Water supply gain and unit cost (URV) comparison between different catchment restoration and other supply options (costs
include raw water treatment cost where applicable).
GREATER CAPE TOWN WATER FUND BUSINESS CASE |9ADDITIONAL ECOLOGICAL THE ROLE OF THE GREATER
INFRASTRUCTURE RESTORATION CAPE TOWN WATER FUND
While the focus of this Business Case is on invasive The Greater Cape Town Water Fund is bringing
plant removal to restore seven priority sub- together private and public sectors stakeholders
catchments supplying the WCWSS, the scope of the alongside local communities around the common
Water Fund will be broader in supporting additional goal of restoring the surface water and aquifer
ecological infrastructure interventions to secure catchments which supply our water. The Water Fund
water supply. The restoration of four priority wetlands aims to support and align with existing government
would be beneficial, as well as removal of Steenbras initiatives and act as a catalyst for systemic change
and Wemmershoek plantations and clearing forestry in catchment management by cost effective
exit areas, and restoration of the Atlantis Aquifer. use of on the ground resources, strengthened
Preliminary analysis has shown that an estimated capacity, and robust monitoring and evaluation. In
1.8 Mm³ of water is lost annually due to alien plant addition, the Water Fund will stimulate funding and
invasions on the Atlantis Aquifer alone. implementation of catchment restoration efforts
and, in the process, create jobs and momentum to
CONCLUSION
protect globally important biodiversity and build more
resilient communities in the face of climate change.
An investment of R372 million ($25.5 million USD)
will generate annual water gains of 50 billion liters
(50 Mm3) a year within five years compared to
business-as-usual — equivalent to one-sixth of the
city’s current supply needs — increasing to 100
billion liters a year (100 Mm3) within 30 years.
Water gains are achieved at one-tenth the unit cost
of alternative supply options.
The results of this business case demonstrate that
restoring the ecological infrastructure of priority sub-
catchments through invasive alien plant removal is a
cost-effective and sustainable means of augmenting
water for the Greater Cape Town Region.
10 | GREATER CAPE TOWN WATER FUND BUSINESS CASEINTRODUCTION
Water security is a major concern globally and grey infrastructure investments are being considered.
increasingly so in parts of the world where supply The looming Day Zero expedited the search for “new”
is struggling to meet demand because of climatic water with exploratory investments in desalination,
changes or human pressures, or both. Nowhere is deep aquifer drilling in the Table Mountain Group, the
this more true than for the Greater Cape Town Region, Cape Flats aquifer and additional abstraction from the
South Africa, where the City of Cape Town faced the Atlantis aquifer, water reuse and augmenting surface
possibility of running out of water following a three- water storage.
year drought between 2015 and 2018 — which would
have been a global first for as large a city. At the The City of Cape Town faces rapid population growth
height of the crisis, dam levels dropped below 20% at about 2.6% per year. Not only is Cape Town the
and Cape Town prepared for the day when the taps second largest city in South Africa, it is also a popular
would run dry, dubbed “Day Zero.” global tourism destination and the economic hub
of the Western Cape Province, accounting for 86%
Water demand is predicted to outstrip current of the province’s gross domestic product.4 Many
supply in the Greater Cape Town Region by 2021 national and multi-national corporations have their
due to steady population growth and changing head offices in the City or in adjacent towns serviced
rainfall patterns even in the absence of a drought by the same water supply scheme. Cape Town’s
like the recent one. The City of Cape Town has had population is estimated to reach 4.13 million in
remarkable success coping with this growth through 20185, making up the majority of the Western Cape
demand management schemes, most notably the Province’s total population.
reduction in losses due to leaks, and significant
POPULATION GROWTH AND WATER SUPPLY
700 6.0
600
5.0
WATER TREATED PER YEAR (million m3)
500
4.0 POPULATION (millions)
400
3.0
300
2.0
200
1.0
100
0 0
1950 1960 1970 1980 1990 2000 2010 2020
Figure 1. The population is growing while water supply is flatlining.
Water Supply Population Exponential Population Growth
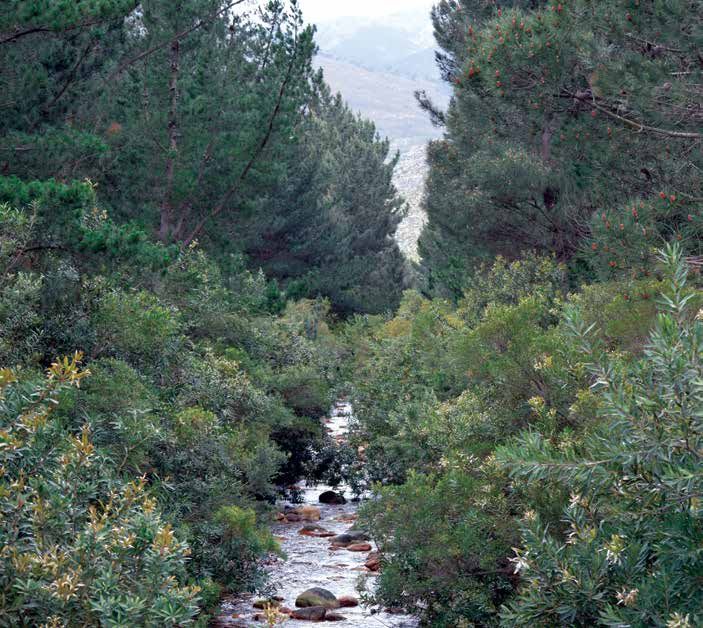
GREATER CAPE TOWN WATER FUND BUSINESS CASE | 11Figure 2. Example of black wattle tree invasion by Theewaterskloof dam.
Africa and other countries around the world. The
FROM SOURCE TO TAP life-history characteristics that make Pinus species
Long-term water security in the Greater Cape Town very suitable for commercial forestry also make
Region, as elsewhere, begins at the source. Healthy them highly invasive in the areas where they have
water catchments naturally store, filter and transport been introduced.6 These include the size of the seeds
rainfall to rivers and dams. As catchments become (small and wind dispersible), the short juvenile time
degraded however, water users from farmers to period (reach seed producing age quickly), and the
industry can expect treatment, pumping, and storage mean interval between large seed crops (increased
costs to increase. In addition, in catchments where overall seed input into environment).7 The wind-
the minimum water quality and quantity necessary dispersed seeds of Pinus species allow them to spread
for sustaining aquatic ecosystems is not met, the easily to surrounding areas.
health consequences for people and nature can
be disastrous. Base flows during the dry summer
seasons, for example, are critical to maintaining both
ECOLOGICAL INFRASTRUCTURE
aquatic health and water supply to many users. The good news is that degraded catchments can
be restored. Targeted investments in “ecological
Today many of the various sub-catchments feeding infrastructure” increase the hydrologic services
the Western Cape Water Supply System (WCWSS) provided naturally by a healthy catchment. Ecological
are in an alarmingly unnatural state. Invasive infrastructure is the nature-based equivalent of
alien plants such as pines, Australian acacias, and grey or engineered infrastructure. It forms and
eucalyptus cover large areas of the landscape. These supports a network of interconnected structural
plants alter soil ecology, increase the frequency and elements such as catchments, rivers, riparian areas
severity of wildfires and significantly impact river flow and natural corridors supporting habitats and
and aquifer recharge. Pinus radiata and P. pinaster are movement of animals and plants.8
highly invasive and have led to problems in South
12 | GREATER CAPE TOWN WATER FUND BUSINESS CASEAt scale, catchment restoration programmes
yield improved water availability and quality A WATER FUND FOR THE GREATER
while generating multiple social, economic, and CAPE TOWN REGION
environmental co-benefits, including resilience to
climate related shocks like floods and droughts.9 The vision of the Greater Cape Town Water Fund
Strategic investment in ecological infrastructure is to ensure healthy and resilient catchments
reduces operational costs, lengthens the life of existing providing sustainable water yields for current and
water supply infrastructure and helps avoid the need future generations.
for new projects — often with significant cost savings. The current Greater Cape Town Water Fund
In the Greater Cape Town Region, as in other parts (GCTWF) partnership includes The Nature
of the world, significant water security benefits Conservancy, National Department of Water and
can be achieved through ecological infrastructure Sanitation, National Department of Environmental
investments in the water source areas of the WCWSS. Affairs (Environmental Programmes), Provincial
Unfortunately, ecological infrastructure options are Department of Environmental Affairs and
often overlooked. Indeed, the Greater Cape Town Development Planning, City of Cape Town, SANBI,
Region has historically lacked a comprehensive CapeNature, Coca-Cola Peninsula Beverages,
catchment restoration plan, one that major water Nedbank, Remgro Ltd, and WWF. The GCTWF
users like the city, industry and farming community aims to address threats to water security at their
could well consider as a part of its portfolio of capital source through targeted investments in catchment
investments.10 restoration and long-term management, including
controlling invasive alien plants, rehabilitating
The purpose of this study is to determine whether wetlands and riparian areas and raising awareness
investing at scale in catchment restoration for the about stewardship of water resources.
Greater Cape Town Region is cost competitive with
other supply solutions. The Nature Conservancy (TNC) is a global non-profit
with more than a million members and a network of
The focus of this Business Case is primarily on over 3,500 staff including 600 scientists, working
the economics of controlling invasive plants in the in over 70 countries. The TNC South Africa office
surface source water areas of the WCWSS. The was established in August 2017. The Greater
proposed restoration timetable is both credible and Cape Town Water Fund builds upon TNC’s related
conservative and based on extensive consultation experience in Upper-Tana Nairobi Water Fund,
with local experts and communities. Water quantity, Africa’s first Water Fund, and North and South
in particular the timing of flow or recharge, is the America, where over 30 water funds are either
main focus of the benefit analysis. That said, the job operating or in development. In each case, the Water
creation and biodiversity impacts are also considered Fund serves as a governance and funding mechanism
given the labour intensity of restoration interventions whereby public and private downstream water users
and the globally significant biodiversity of the contribute collectively to upstream conservation
Western Cape. initiatives aimed at improving water quality and
quantity both upstream and downstream.
GREATER CAPE TOWN WATER FUND BUSINESS CASE | 13Figure 3. A Water Fund is a funding and governance mechanism that enables water users to invest collectively in catchment
restoration alongside upstream communities. More information can be found at waterfundstoolbox.org.
BRIDGING THE GAP
Water Funds have typically been established where A Water Fund does not replace government
there is a market failure (i.e., the price of water mandates, nor does it aim to compete for funding
does not reflect the true costs of delivering clean or duplicate efforts. TNC and the Greater Cape
water, including environmental and resource costs) Town Water Fund partnership aim to significantly
and where there is a need for coordination of bolster the ongoing efforts to control invasive alien
multiple public and private sector actors through plants. These restoration efforts will go hand in
a collective platform. Even when existing water hand with other existing interventions implemented
governance is linking the public and private sector by, for example, the City of Cape Town, Working for
relatively well, a Water Fund can be a good vehicle Water, and CapeNature to secure our water supply
to pool funding and financing from various sources, for the future. The GCTWF aims to work with relevant
including non-traditional sources of capital, and authorities and support the South African National
allocating those resources to priority interventions Biodiversity Institute (SANBI) Global Environmental
across the catchment. Facility (GEF) 6 project to create an enabling legal
and policy environment for sustainable water
resources management.
14 | GREATER CAPE TOWN WATER FUND BUSINESS CASETHE WESTERN CAPE WATER SUPPLY SYSTEM
The Greater Cape Town Region receives its water which involved the setting up of water collection
from sub-catchments of the Breede, Berg, and Olifants points and finding short term alternative sources. Not
Water Management Areas (WMAs) through the only did the looming crisis compel the authorities
Western Cape Water Supply System (WCWSS). The to act, but water dependent industries, business
WCWSS is in fact made up of 14 dams, of which five and communities were watching the declining dam
are regarded as “major” dams, and three aquifers levels with anxiety. The installation of rainwater
connected by an 11,600 km pipeline network, several capturing capacity, grey water systems, and sinking
storage reservoirs, pumping stations, and canals. The of boreholes were some of the immediate responses
main aquifers include the Atlantis Aquifer, which is by residents and businesses. The City of Cape Town
part of the West Coast aquifer to the north of Cape implemented a Water Demand Management Strategy
Town, the Table Mountain Group Aquifer (TMG) in which involved actions such as declaring severe
the Hottentots Holland mountain range beyond Cape water restrictions, limiting individual use to 50 liters/
Town, and the Cape Flats aquifer within the urban area. person/day, managing the remaining water in the
dams, and planning augmenting water from other
The City of Cape Town shares its water resources sources (ground water, re-use, and desalination).13
with the neighbouring district and local municipalities,
West Coast (Swartland, Saldanha & Berg), The recent drought cost more than 30,000
Drakenstein (Paarl and Wellington), and augments agricultural jobs in areas serviced by the Western
Stellenbosch’s supply, as well as the agricultural Cape Water Supply System and negatively impacted
sector downstream of the Theewaterskloof, Berg the tourism industry, bringing the importance of
River, and Voëlvlei dams. The current unrestricted water security to the forefront. Under the predicted
daily demand for water in the WCWSS is 1.35 billion population growth of 2.6% per year, the City of Cape
liters per day (1.35 million cubic meters per day – Town’s population may exceed 5 million within a
Mm3) shared by The City of Cape Town, agriculture decade. Population growth and associated economic
and smaller neighbouring municipalities (Figure 5). activities also increase water demand, predicted to
grow at 3% per year. An additional 300-350 MLD
DEMAND TO OUTSTRIP SUPPLY
(128Mm³ per year) would be required by 2028. to
avoid a situation where demand exceeds supply.14
Under the current planning scenario, it is predicted
that demand will exceed current WCWSS capacity
by 2021.12 The planning scenario assumes that SHARE OF WATER DEMAND IN THE
WESTERN CAPE WATER SUPPLY SYSTEM
(1) The City of Cape Town meets water restriction
targets; (2) Climate change or major drought does
not impact water availability; and (3) Dams do 7%
not need to release additional water to meet the
ecological reserve.
Day Zero refers to the point at which domestic
users would be disconnected from the reticulation 29%
system and supplied from watering points. Based 64%
on consumption scenarios, the WCWSS collective
dam levels for this were set at 13.5%, which would
provide three months’ worth of water at a greatly
reduced service volume of 350 Million liters per day
(MLD), less than one-third of normal deliveries. Day
Zero was only narrowly avoided in the first half of City of Cape Town Agriculture Other Municipal
2018. A disaster management plan was implemented
Figure 5. The City of Cape Town constitutes nearly two-thirds of
water demand.
GREATER CAPE TOWN WATER FUND BUSINESS CASE | 15Figure 4. Western Cape Water Supply System users include the Cape Town metropolitan area, the agricultural sector, smaller
municipalities, and communities.11
16 | GREATER CAPE TOWN WATER FUND BUSINESS CASETHE HIGH COST OF “NEW” WATER
Current supply augmentation solutions are average unit cost (Unit Reference Value or URV) of
estimated to cost 8 billion Rand ($540 million USD) new supply options is approximately R10 for each
in capital costs alone and to deliver 400 MLD for cubic meter of water supplied.15
the next 50 years. The City of Cape Town introduced
a “New water programme” whereby the WCWSS is Pumping and treating water is very energy intensive
augmented from alternative sources to achieve the and depending on the energy source, some water
additional supply required. The new supply options supply options will lock the city onto a higher
are estimated to have a combined capital cost of emissions path. While emission implications of
8 billion Rand (R) to deliver 400 million liters per water supply options are not considered here, such
day (MLD). Including operating cost, the estimated an assessment would further help the city make
informed choices.
UNIT COST AND POTENTIAL WATER SUPPLY GAINS
20
15
Rand per cubic meter
10
Desalination
+120
5
Re-use
Ground +70
Surface +100
+60
0
0 100 200 300 400
Additional Supply - Million Liters Per Day (MLD)
Figure 6. Unit cost comparison and estimated water yield potential of grey infrastructure solutions under consideration by the city.
Significant uncertainty remains around the unit costs (shaded sections in chart).16
GREATER CAPE TOWN WATER FUND BUSINESS CASE | 17WCWSS SOURCE WATER AREAS
The Greater Cape Town Region’s water comes from River, and Steenbras and the groundwater source,
an area spanning over 170,000 hectares which drain Atlantis Aquifer. Only 42% of these source water
into five major dams and the Atlantis aquifer. The catchment areas are under formal protection, 15%
majority (85%) of the areas upon which the Cape Town occur in privately owned mountain catchment areas
metropolitan area depends for its water are located and 43% on other land — agriculture, government,
outside municipal boundaries. The National Department private ownership and plantations.
of Water and Sanitation (DWS) manages three, and the
City of Cape Town two, of the major dams. The health of these catchments has been negatively
affected by several factors, including the degradation
The 25 source water areas of the WCWSS include of wetland and riparian areas, altered fire regimes —
the catchments upstream of the surface water dams, resulting in more frequent and intense fires, water
Voëlvlei, Theewaterskloof, Wemmershoek, Berg pollution, and invasive alien plants.
18 | GREATER CAPE TOWN WATER FUND BUSINESS CASEFigure 7. Over two-thirds
of sub-catchments are
invaded by alien plants.
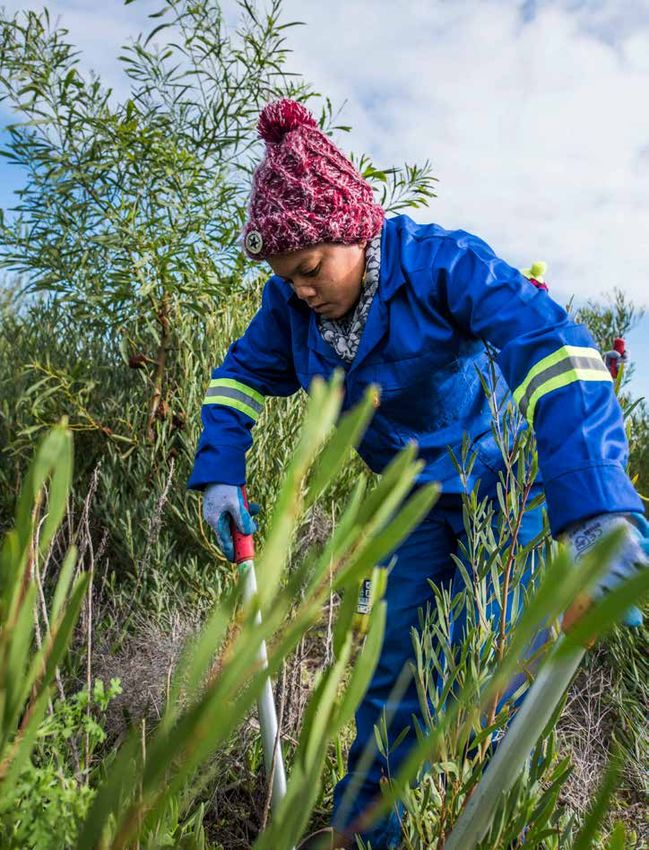
GREATER CAPE TOWN WATER FUND BUSINESS CASE | 19Figure 8. Pine tree invasion.
ALIEN PLANT INVASION
Over two-thirds of sub-catchments are invaded by plants are found nowhere else on the planet, and
alien plants. The state of many of the source water alter the habitat of native fauna.
sub-catchments feeding the WCWSS is being heavily
degraded by invasive alien plants. These plants, which The impact that invasive alien plants have on
unlike the native fine-leaf fynbos vegetation are trees, modifying catchment hydrology, and therefore water
quickly replace native species if unmanaged. They availability, is significantly determined by the species
alter soil ecology, increase the frequency and severity type and the density of the invasion.17 18 Woody
of wildfires and significantly impact river flow and plant species, such as Australian acacia, pine and
aquifer recharge. eucalyptus, which dominate invasives cover in these
source catchments, have higher evapotranspiration
Invasive alien plants threaten the diversity of native rates and use up to 20% more water than the
plant life in the Cape Floral Region, where 70% of region’s native fynbos vegetation. This leads to
20 | GREATER CAPE TOWN WATER FUND BUSINESS CASEattendant decreases in surface water run-off as well condensed to their equivalent 100% density within a
as a reduction in infiltration or deep percolation to sub-catchment (for a definition of density categories,
aquifers. Because woody plant species have deeper see Box 1, P26).19 For example, a sub-catchment
rooting systems than herbaceous landcover, they are may have widespread coverage of invasive plants,
also able to access and extract more groundwater but at a low density. The influence of plants in such
even in times of low rainfall, allowing their growth a catchment will be potentially much lower than in
cycles to persist. Over time, these species become a catchment where invasive alien plants occur at a
more established as they can outcompete herbaceous high density particularly when these woody species
native species and their density increases. This establish themselves in riparian zones. In catchments
increased density magnifies their influence on water with widespread high density invasive alien plants,
partitioning among evapotranspiration, surface water removal of these species will result in an immediate
run-off, and groundwater and aquifer recharge leading and significant response in local hydrology, specifically
to an overall reduction in water availability. increased surface water run-off.
Figure 9 illustrates overall invasive alien plant presence
in sub-catchments alongside what the percentage
of coverage would be if those alien species were
PERCENT INVASIVE ALIEN PLANT COVER
8376
8228
7897
7840
7759
7698
8361
8412
Sub-Catchment Number
8334
8366
7825
7738
8340
7862
8340
8433
8376
7911
8311
7540
8253
7703
7634
7610
0% 10% 20% 30% 40% 50% 60% 70% 80% 90% 100%
Percent of Catchment with Invasives Present
Percent of Sub-Catchment with Condensed Invasive Alien Plants Percent of Sub-Catchment with Invasive Alien Plants
Figure 9. Invasive alien plant coverage of surface water sub-catchments, showing percentage of sub-catchment where invasive plants
are present and the percentage of sub-catchment with condensed invasive plants.
GREATER CAPE TOWN WATER FUND BUSINESS CASE | 21CURRENT INITIATIVES TO CONTROL INVASIVE ALIEN PLANTS IN THE WCWSS
The National Department of Environmental Affairs released to deal with over 50 invasive plant species
Environmental Programmes (DEA-EP) is the largest in South Africa, resulting in the complete cessation of
funder of ecological infrastructure restoration projects spreading for almost a quarter of them.21
in the WCWSS area. The Department’s Land User
Incentive Programme enables private landowners By 2014/15 the WFW Programme implemented over
and Non-Government Organisations (NGOs) to 300 individual projects with an annual budget of
apply for funding to control invasive alien plants on R1.5 billion.22 However, invasive alien plants remain
their land under certain conditions. The Working for a serious environmental problem in the WCWSS
Water (WFW) programme was introduced in 1995 despite these programmes being in place, even with
to control invasive plants in catchments using labour landowners being compelled to control invasive
intensive methods. By 2012, 2.5 million hectares plants on their lands under the National Biodiversity
across the country had received initial treatments Act 10, 2004 (Alien and Invasive Species Regulations
and an average of 2.7 follow-up treatments.20 This (2014)). Some of the main reasons for the persisting
and the more localised clearing efforts of other problem of alien plant invasion in catchments
players complement the progress made with were identified through stakeholder engagement
biological control. Biological control is the use of conducted by the GCTWF (Table 1). It is clear
natural enemies, predators or pathogens sourced from the factors identified that a new coordinated
from their areas of origin and subjected to stringent approach is need to tackle the problem of invasive
host specificity tests before they are released to alien plants, one that aligns stakeholders around
control invasive plants. Biological control has been shared goals and focuses funding on interventions
which demonstrate the highest return on investment.
22 | GREATER CAPE TOWN WATER FUND BUSINESS CASETable 1. Factors listed as main reasons for the persistence of the IAP problem in the Western Cape Water Supply System
(WCWSS) catchments.
Factor Result Recommendation
Absence of a coherent long-term Develop an integrated,
WCWSS-scale integrated ecological Duplication and gaps in efforts, lack of long-term ecological infrastructure
infrastructure restoration strategy continuity and inadequate progress strategy for source water
and implementation plan protection in the WCWSS
Ongoing catchment degradation, Prioritise sub-catchments for water
gaps in implementation, important resource protection, align control efforts
Lack of prioritisation and focus
areas for source water protection to clear and maintain priority areas while
not cleared, waste of resources maintaining previously cleared areas
Additional funding streams
Restrictive bureaucratic processes Re-invasion of cleared areas,
to supplement government
and red-tape, lack of flexibility ongoing spread of invasive alien
funding, implement demonstration
to respond in a timely manner plants leading to further degradation
projects, flexibility to respond
e.g. follow up after fire events of catchments and water losses
by following up after fires
Ongoing degradation and water losses,
Develop and implement a
Lack of monitoring, evaluation poor quality work not detected and
Monitoring and Evaluation framework
and reporting on progress against corrected on time, outcomes are not
adopt the system, analyse results
clear set of Specific, Measurable, measured in ecological or water terms, but
against set objectives and targets,
Achievable, Realistic, Timebound rather in terms of hectares treated, and job
assess impact, report progress, adapt
objectives and targets creation results in wasteful expenditure
management where required
and increase in spread of invasive plants
Information management inadequate,
fragmented and not at the appropriate
scale, the data is not readily available
Strategic, landscape-scale planning not
for decision-making, by the time it Develop a strategic spatially explicit,
possible due to data inconsistencies and
becomes available the information is out web-based, accessible information
gaps. Data not readily available
of date. Inconsistencies and data gaps. management system for the source
for planning or tracking progress at
Reliance on National Invasive water areas of the WCWSS
scale involving all relevant stakeholders
Alien Plant data set that is not readily
available and outdated in some instances
when eventually made available.
Lack on integration of control
methods such as fire. A key factor Integrate fire and biological
Inability to address alien plant
here is concerns about legal liability control with conventional control
invasions at scale, ongoing spread
when doing prescribed burns and methods, monitor impacts and
and increase in water losses
also the cost of doing them — so adapt management approach
almost no prescribed burning
Legislative changes and/or
changes in interpretation, enable
City prioritises costly augmentation
Legislative limitations preventing the City of Cape Town to play and
options, over cost effective
the City of Cape Town’s to play active role and invest in controlling
long-term nature-based solutions
a more active role and taking invasive plants and maintaining
such as controlling invasive plants
ownership of its water resources priority sub-catchments outside
in its water source areas
municipal boundaries, conditionally
to water allocation security
Support institutional
Inadequate resources for capacity building, and build an
Institutional failure and fragmentation
water source protection inclusive effective governance
structure for the WCWSS
GREATER CAPE TOWN WATER FUND BUSINESS CASE | 23EVALUATING THE COST COMPETITIVENESS
OF CATCHMENT RESTORATION
It is often challenging to compare the cost SIX-STEP PROCESS FOR ANALYSIS
effectiveness of catchment restoration with that
of conventional water supply infrastructure. The This section details the analytical steps implemented
latter benefits from decades of track record, which to allow a comparison of the cost-effectiveness of
makes estimating costs and predicting impact invasive alien plant control and other water supply
straightforward and reliable. Predicting the cost and options. As illustrated in Figure 10, the analysis
impact of most ecological infrastructure in contrast involved six main steps:
can be very challenging. Invasive alien plant control
1. Map the current and future extent of alien plant
is a notable exception, especially in South Africa
invasion in sub-catchments
where long-standing programmes like Working for
Water provide a strong basis for estimating costs and 2. Model current and future water loss due to invasive
operational considerations. Likewise, there is a strong alien plant invasion
scientific evidence base for the water yield impacts
of catchment restoration through controlling alien 3. Estimate the costs per hectare of invasive alien
plant invasions, which greatly reduces the uncertainty plant control based on local conditions
of water supply impacts. In short, there exists a solid
4. Rank areas by highest ROI, i.e., greatest water yield
foundation upon which to base investment decisions
per unit cost
about controlling invasive alien plants.
5. Build discounted restoration timeline for priority
Nevertheless, investing in a catchment restoration
sub-catchments, including full maintenance costs
programme at scale — one that would largely take
place outside of municipal boundaries — requires 6. Compare cost per cubic meter, expressed as Unit
not only a predictable impact and a strong financial Reference Value (URV) and potential yield gains of
case. For Cape Town, this financial case depends restoration programme to alternative water supply options
on how the cost to control alien plant invasions
and maintaining cleared and uninvaded areas and
the resulting water impact compare to those of
alternative water supply options.
The spatial scope of this study is limited to solely
those 24 sub-catchments that flow into five
main surface water dams — Theewaterskloof,
Wemmershoek, Berg River, Voëlvlei, and Steenbras.
24 | GREATER CAPE TOWN WATER FUND BUSINESS CASEYou can also read