THE HIDDEN ECONOMY IN BULGARIA AFTER THE ECONOMIC CRISIS

Page created by Dave Zimmerman
 
CONTINUE READING
THE HIDDEN ECONOMY IN BULGARIA AFTER THE ECONOMIC CRISIS

                                          Policy Brief No. 28, April 2011

The dynamics of the hidden economy is an important in-             MAIN POINTS
dicator of the state of a country’s institutions as well as
of its competitive potential. The hidden economy has a                The hidden economy has grown among businesses,
serious impact on private sector activities, the productiv-            but declined among the population. The social cost
ity and competitiveness of the workforce, on economic                  of the economic crisis is a declining employment
development and growth, as well as the social security                 among the groups with the lowest qualifications.
and support systems of the country. According to different
estimates about a third of the world’s GDP is within the                o   There is a rise in cases involving tax evasion,
“shadow turnover”. It is argued that the current financial                  avoidance of customs, fees, and excise du-
and economic crisis will result in an increase in the hidden                ties, as well as VAT fraud. As businesses suf-
economy in most European countries.1 The recent debt cri-                   fer through the recession, they become more
sis in Greece has exposed drastically the need to better                    likely to not declare part of their revenue and
account for and to grasp the implications of the existence                  economic activities.
on large hidden economy on economic performance. This                   o   There is a slight decrease in the incidence of
is even more pressing in the light of achieving Europe 2020                 undeclared payments - in 2010, 11.6 % of the
results and calculating each country’s contribution to the                  population reported having received a remu-
European Stability Mechanism and the Euro Plus Pact.                        neration higher than the one stated in the con-
                                                                            tract with their primary employer .

                                                                      Governmental measures to reduce the hidden
                                                                       economy do not seem to have produced the de-
                                                                       sired results.
                                                                      The general economic situation and development
                                                                       are more important for the dynamics of the hidden
1
 Olga Pavuk, 2009, “Shadow economy in the Baltics and around the       economy than government control measures.
world,” February 25, 2009, Riga.

                                                                               This study and publication are supported by the
                                                                                © Friedrich Ebert Foundation, Office Bulgaria,
                                                                     		                    Center for the Study of Democracy
No 28                                                                                                            POLICY BRIEF                                                                                                                              April 2011

Figure 1. Competitive Landscape of the Bulgarian Economy
(numbers show the position of Bulgaria in the ranking of 58 economies)

         E CO N O M I C                                                   GOVERNMENT                                                                      BUSINESS                                       INFRASTRUCTURE
       PERFORMANCE                                                         EFFICIENCY                                                                    EFFICIENCY

                                                                         11
                                                                                                                                                                                                                                                          2009
                               15                                                                                                                                                                                                                         2010
                  21                                         21          22 22
                                                                            25
                                               27
                                                                                                                                                                                                                             30
                  36                                                                                        35
     37                                                                                                     38                                                                                                               37
                                                             35                                                                                             43                            42            42                                                               42
                                                                                             37                        45                                                                               45                                                               44
                                                                                                                                                                              46                                                                            47
                                                                                             42                        50                 47                                              49                                                                49
                               44                                                                                                                                  52
     54                                                                                                                                     55              55                                                                           50
                                                                                                                                                                   53                                                                    51
                                                                                                                                                                              56

                                                                                                                                                                                                                                                                         Education
                               International

                                                                                         Institutional
               International
    Domestic

                                                                      Finance
                                                Employment

                                                                                                                                                                   Finance

                                                                                                                                                                             Management

                                                                                                                                                                                          and Values
                                                                                                                                                          Market
                                                                                                         Legislation

                                                                                                                       Framework
                                                                                                                                        Productivity &
                                                             Prices

                                                                                                                                                                                                       Infrastructure

                                                                                                                                                                                                                        Infrastructure

                                                                                                                                                                                                                                         Infrastructure

                                                                                                                                                                                                                                                           Environment
    Economy

                                                                                Policy

                                                                                          Framework
                                                                                Fiscal

                                                                                                                                                          Labor
                                Investment

                                                                                                                                                                                           Attitudes
                                                                       Public

                                                                                                                                                                                                                                                            Health and
                                                                                                          Business

                                                                                                                         Societal

                                                                                                                                          Efficiency

                                                                                                                                                                              Practices

                                                                                                                                                                                                                                            Scientific
                   Trade

                                                                                                                                                                                                                             Tech.
                                                                                                                                                                                                            Basic
Source: World Competitiveness Yearbook, IMD, 2009 and 2010.

Recent Economic Developments                                                                                                                   Together with Latvia and Lithuania, businesses in Bulgaria
and Hidden Economy Prospects                                                                                                                   saw the largest declines in sales, while the share of businesses
                                                                                                                                               that have accumulated debt or were behind in their financial
In Bulgaria the pre-crisis period was characterized by a                                                                                       obligations increased during 2009 to 2010. 4 There are warn-
sharp increase in revenues (especially tax revenues on                                                                                         ing signs for an increase in the number of “non-performing”
goods and services) and large capital inflows that fueled                                                                                      loans across all sectors (i.e. corporate, consumer, and mort-
employment growth between 2001 and 2008. Yet in 2009,                                                                                          gage), and the International Monetary Fund forecasts an up-
tax and non-tax revenues slumped, with only a few Bal-                                                                                         surge in the ratio of “bad and restructured” loans by 4 to 6.5
tic countries experiencing higher revenue losses than Bul-                                                                                     percentage points in 2010 and up to 1 percentage point in
garia.2 As Bulgaria’s trading partners suffered through the                                                                                    2011.5 It is yet unclear when and how these non-performing
recession, the volume of exports fell (especially at the end                                                                                   loans will affect the economy but there are signs that the
of 2008 and the first quarter of 2009) and the credit boom                                                                                     excess capacity they leave weigh on the economic recovery,
came to an end in 2009, with credit flows coming to a halt                                                                                     which started in the second half of 2010.
in the fourth quarter of 2008. The latter affected business-
es and households alike, and in 2009 the full impact of the                                                                                    While capital inflows and investments are expected to even
above shocks manifested itself in a drop in the country’s                                                                                      out at levels below the “boom years”,6 the expectations are
GDP for the first time since the crisis in 1996-1997.3 As a                                                                                    for a slow but gradual recovery of the Bulgarian economy.
result employment slumped, unemployment rose sharply                                                                                           Signs of recovery were already evident in the second quar-
and consumption declined leading to fears of protracted                                                                                        ter of 2010, when a rebound in exports significantly reduced
jobless recovery in 2011 – 2012.                                                                                                               the pace of contraction in real GDP. In spite of the existing

                                                                                                                                               4
                                                                                                                                                 World Bank, 2010, “The Impact of the Global Economic Crisis on the
2
   Reports show an increase in total employment by 20 percent during                                                                           Corporate Sector in Europe and Central Asia: Evidence from a Firm-Level
the period, largely owing to the construction, real estate, wholesales, and                                                                    Survey,” Enterprise Surveys Enterprise Note Series.
financial service sectors.                                                                                                                     5
                                                                                                                                                 IMF Country Report No. 10/159.
3
   IMF Country Report No. 10/159.                                                                                                              6
                                                                                                                                                 Ibid.

                                                                                                                                    2
THE IMPACT OF THE ECONOMIC CRISIS ON THE HIDDEN ECONOMY IN BULGARIA

depressed consumer confidence that negatively affects do-                             Figure 3. Number of Unemployed (in thousands)
mestic demand, a slight economic improvement is forecasted,                           and unemployment rate (%) in Bulgaria
with real GDP growth turning positive in 20107 (see Figure 2                            400                                                   15%
        8
below), current account deficit declining further,8 and infla-                          350
        6
                                                                                                                                                         Unemployed
tion remaining moderate.9 Moreover, a more visible recovery                             300                                                              persons
        4                                                                                                                           10,2%
is expected in 2011, with real GDP growth to 2-2½ percent                               250
                                                                                                                                              10%
        2
(Figure 2) primarily driven by external demand.10       EU-27                           200
                                                                                                                                                         Long-term
          0                                                                                                              6,8%                            unemployed

                                                                     Bulgaria           150                5,6%
Figure -22. Real GDP Growth (% change on annual basis)                                                                                        5%
                                                                                                                                                         Unemployment
                                                                                400     100                                             15%
    8    -4                                                                                                                                              rate
                                                                                350     50
    6    -6
                                                                                                                                                    Unemployed
                                                                                300       0                                                   0% persons
    4    -8                                                                                                                     10,2%
                                                                                250                 2008          2009           201010%
    2
              2005 2006 2007 2008 2009 2010 2011 2012
                                                                                                                                 Long-term
                                                                                      Source: Center for the Study of Democracy using data from the
                                                               EU-27            200
                                                                                                                                 unemployed
    0                                                                                 National Statistical Institute.
                                                                                                             6,8%
                                                                Bulgaria        150                 5,6%
    -2                                                                                                                                  5%
                                                                                                                                                    Unemployment
                                                                                100
    -4                                                                                 There seems to be a vast untapped potential
                                                                                                                               rate      among the
                                                                                    50
    -6                                                                                 share of the population that is of economically active age.
                                                                                     0 A significant proportion of the population
                                                                                                                         0%        of active age (i.e.
    -8
                                                                                           2008       2009      2010
                                                                                       15 to 64 years) is not productively employed leaving this hu-
         2005 2006 2007 2008 2009 2010 2011 2012
Note: data for 2011 and 2012 are estimates.                                            man capital available for hidden economic activities, which
Source: Center for the Study of Democracy using data from Eurostat.                    traditionally have lower levels of productivity and higher
                                                                                       rates of loss of qualification. As shown in Figure 4 below,
The recent financial and economic crisis affected the real econ-                       the number of people of active age (15 to 64 years old) left
omy of European countries, in terms of both GDP and employ-                            outside the official labor market either because they de-
ment.11 According to the World Bank (2010), the drop in “av-                           clared they do not seek employment (economically inactive)
erage permanent employment” was greatest in Bulgaria. Dur-                             or because they were discouraged increased in comparison
ing the third quarter of 2010, the share of employed persons                           to 2009 and reached approximately 1.69 million in 2010.
(15 years and over) out of the population (of the same age
group) was 47.5%. Compared to the same period in 2009,                                Figure 4. Workforce Dynamics (in thousands)
the number of employed persons dropped by 175.8 thousand
                                                                                          4000                                                                                                         5
and the correspondent drop in the employment ratio was 2.3

                                                                                                                                                                           Annual percentage change
                                                                                                                                                                                                       4
                                                                                          3500
percentage points. During the same quarter of 2010, the share                                                                                                                                          3
                                                                                                                                                                                                       2
of unemployed persons was 9.5% of the economically active                                 3000
                                                                                                                                                                                                       1
population, an increase of 2.8 percentage points from the third                           2500                                                                                                         0
                                                                                                                                                                                                      -1
quarter in the previous year. The latter translates into an addi-                         2000
                                                                                                                                                   Discouraged
                                                                                                                                                                                                      -2
tion of over 92 thousand unemployed individuals in the third                                                                                       Economically inactive                              -3
                                                                                          1500
quarter of 2010, compared to the same period in 2009.12                                                                                            Economically active                                -4
                                                                                          1000

                                                                                              500
7
   Both Eurostat and IMF forecasts foresee a real GDP growth between 0
to 0.4 percent in 2010.                                                                         0
8
   According to the IMF, coming to just below 3 percent of the country’s                              2008        2009          2010
GDP by the end of 2010.
9
   IMF, 2010, Bulgaria—September 2010 Staff Visit, Concluding State-                  Source: Center for the Study of Democracy using data from
ment, Sofia, October 5, 2010.                                                         the National Statistical Institute.
10
   IMF, 2010, Bulgaria—September 2010 Staff Visit, Concluding State-
ment, Sofia, October 5, 2010; see also Eurostats’ estimates.
11
   Friedrich Schneider, 2010, “The Influence of the economic crisis on                While the Bulgarian GDP is expected to grow again in
the underground economy in Germany and the other OECD-countries in
2010: a (further) increase.”                                                          2011, the level of employment during the same year is
12
   The National Statistical Institute, 2010, “Key Indicators for Bulgaria as          likely to stagnate (see Figure 5 below). Unemployment may
of 30.12.2010”: (http://www.nsi.bg/KeyInd/KeyInd2010-12.pdf).

                                                                                3
No 28                                                                           POLICY BRIEF                                                             April 2011

          continue rising and remain higher than current levels as                                        •    A continuous increase of labor costs throughout
          bankruptcy procedures kick in and enterprises considered                                             2010.16 Though considered normal given Bulgaria’s
          viable in 2009 / 2010 are forced to leave the market. As it                                          relatively low pay levels compared to the EU aver-
          is unlikely that an economic boom similar to the pre-crisis                                          age, in the context of the crisis such a tendency
          period will occur, forecasts warn that a considerable time is                                        may lead to rising unemployment and a pressure to
          needed before excess labor and resources are absorbed by                                             underreport employment and actual remuneration
          other sectors in the economy.13                                                                      (thus also leading to a loss of social protection);
                                                                                                          •    In light of the increase in unemployment, it is ex-
          Figure 5. The Growth of Employment in Bulgaria
                                                                                                               pected that a number of people will attempt to
          (annual percent change)
                                                                                                               make up for their loss of income in the formal econ-
                                     5
                                                                                                               omy through participating in the hidden economy;
         Annual percentage change

                                     4
                                     3
                                                                                                          •    Shrinking business activity is related to a drop in
                                     2
                                     1                                                                         state budget revenues. The latter may, in turn,
                                     0                                                                         translate into a poorer implementation of regula-
                                    -1
                                    -2                                                                         tory compliance, control, and audit procedures. In
active                              -3                                                                         addition it may lead to increasing pressure on the
tive                                -4
                                                                                                               state administration to “do something” to coun-
                                         2005    2006   2007    2008    2009    2010   2011
                                                                                                               ter hidden economy through administrative mea-
          Source: Center for the Study of Democracy using data from IMF.
                                                                                                               sures, which usually is counterproductive.

          At a company level, the crisis led to an increase in job                                   The existence of hidden and illegal activities in Bulgaria is also
          loss, bankruptcy, and closure of businesses. Common                                        related to the formation of organized crime structures and the
          measures adopted by firms in 2009 were the so-called                                       establishment of informal social and economic systems. The
          “soft measures” (e.g. unpaid leaves, wage and work time                                    price of entrepreneurship is high and is coupled with a heavy
          reductions) aimed at preserving the business while also re-                                administrative burden, while consumer demand is weak and
          taining selected employees.14 It was also associated with a                                unsophisticated17, thus involvement in the informal sector be-
          quick shedding of undeclared labor. Companies dismissed                                    comes an important means for a business start-up. Moreover,
          workers without contracts immediately and stopped pay-                                     informal employment in Bulgaria seems to be socially accepted.
          ing undeclared (envelope) wages, which led to a reduc-
          tion in hidden economy in the end of 200915. In addition                                   Hidden Economy Index 2010:
          it can be expected that the firms operating in the informal
                                                                                                     Components and Dynamics
          sector will go out of business at a higher rate and quicker
          as a result of the crisis.
                                                                                                     The current brief is a part of a series of studies commis-
                                                                                                     sioned by the Center for the Study of Democracy and
          All of the above factors add up to a complex macroeco-
                                                                                                     carried out by Vitosha Research, which have been calcu-
          nomic environment, in which it is realistic to expect a rise in
                                                                                                     lating and disseminating i) the hidden economy index of
          the proportion of the hidden economy due to:
                                                                                                     businesses and ii) the index of unreported economic ac-
                                    •    A notable drop in businesses’ revenues that makes           tivity of the population since 2002. Comparing the size
                                         firms more likely to avoid taxes and reduce social          and dynamics the Hidden Economy Index (for both busi-
                                         security contributions so as to preserve their profit       nesses and the population) over time allows for assessing
                                         margins and competitiveness on the market (or               the actual impact of implemented policies to tackle hidden
                                         simply to avoid bankruptcy);
                                                                                                     16
                                                                                                        As of the fourth quarter of 2010, the Labor Cost Index of Bulgaria marked
                                                                                                     the highest value in the EU – 126.7, against the EU-27 average of 105.4. Eu-
          13
             IMF Country Report No. 10/159                                                           rostat’s labor cost index shows the short-term development of the total cost
          14
             European Industrial Relations Observer (http://www.eurofound.europa.                    for employers, on an hourly basis, of employing the labor force (2008 = 100).
          eu/eiro/studies/tn1004019s/bg1004019q.htm).                                                17
                                                                                                        Bulgaria is the poorest member of the European Union, which means
          15
             CSD Policy Brief 20, “Policies to Counter the Effects of the Economic                   that other things being equal, the pull force of consumer demand is com-
          Crisis: Hidden Economy Dynamics 2009.”                                                     paratively lowest in this country.

                                                                                                 4
THE IMPACT OF THE ECONOMIC CRISIS ON THE HIDDEN ECONOMY IN BULGARIA

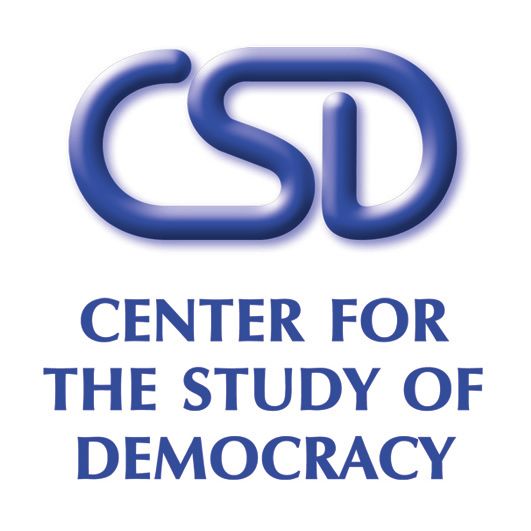
economic activities. Consistent with previous analyses, the              Figure 6. Hidden Economy Index 2002-2010
2010 Index includes the following elements:                                       5
                                                                                                                                               General index of
                                                                              4,5                                                              hidden economy
                                                                                  4
1) The size of the hidden economy summarizes the                              3,5                                                              Assessment of the
                                                                                                                                               size of the hidden
                                                                                  3
   subjective perceptions of business representatives of                                                                                       economy
                                                                              2,5                                                              Hidden labor
   the scope of hidden economy in the country in gen-                             2                                                            relations
                                                                              1,5
   eral, as well as in their respective sectors.                                  1
                                                                                                                                               Hidden turnover

                                                                              0,5
2) Hidden employment captures the practice of hiring                              0                                                            Redistribution

   workers without formal employment contracts or un-

                                                                              Ja er 2 4

                                                                              Oc st 7
                                                                                  ar 05
                                                                                  be 03

                                                                                  be 009
                                                                            De tob 008
                                                                              ve ch 2

                                                                                 Ju 007

                                                                                          0
                                                                                 Ap 003

                                                                                         0

                                                                                 gu 00
   der contracts with underreported remuneration (i.e.

                                                                                         0

                                                                                        01
                                                                                to 20
                                                                                nu 0
                                                                                m 20
                                                                                M r 20

                                                                               Au e 2

                                                                              ce er 2
                                                                                      2
                                                                                     y2

                                                                                     r2
                                                                                     r2

                                                                              Oc ril

                                                                                    n
                                                                                  be

                                                                                  b
                                                                                 ar
                                                                                m

                                                                                m
   envelope wages).

                                                                           ce
                                                                         De

                                                                                      No
3) Hidden turnover includes the incidence of various                     Note: The 2008 Index values are based on telephone interviews. All
   practices of concealing turnover in the respective in-                other values are based on data from face-to-face interviews.
   dustry or sector.                                                     Source: Hidden Economy Survey on Businesses 2010, Center for the
                                                                         Study of Democracy, Vitosha Research.
4) Hidden redistribution encompasses the practice of
   tax, customs and excise duty evasion or non-payment,
                                                                         Figure 7. Index of Unreported Economic Activity of the
   as well as the existence of VAT fraud schemes.
                                                                         Population 2003-2010
The 2010 Hidden Economy Index for the businesses and the In-                4,0
dex on Unreported Economic Activity of the population display
                                                                            3,5
opposing trends, which mirror the situation in 2009. While in                                                                                         Hidden
                                                                                                                                                      employment
                                                                            3,0
2009 a decrease in overall hidden economy was observed in
                                                                            2,5
the case of businesses vs. an increase in the index of unreported                                                                                     Hidden
                                                                            2,0                                                                       turnover
economic activity of the population, 2010 reveals the opposite
                                                                            1,5
trend. The overall index of hidden economy in the case of busi-                                                                                       Hidden
                                                                            1,0
nesses (and all its components – i.e. hidden economy size, hid-                                                                                       economy
                                                                                                                                                      activity
                                                                            0,5
den labor relations, hidden turnover, and redistribution) was on
                                                                            0,0
the rise, while the index of unreported economic activity of the
population (and all its components – i.e. hidden employment,
                                                                                                                      8

                                                                                                                                 09
                                                                                                 04
                                                                                       03

                                                                                                                                           0
                                                                                                           4

                                                                                                                    00

                                                                                                                                          01
                                                                                                          00

                                                                                                                             20
                                                                                                20
                                                                                      20

                                                                                                                  t2

                                                                                                                                          r2
                                                                                                          r2

                                                                                                                            er
                                                                                            ch
                                                                                  ry

                                                                                                                 us

                                                                                                                                      be
                                                                                                      be

turnover, and economic activity) actually decreased (Figures 6
                                                                                                                             b
                                                                              ua

                                                                                            ar

                                                                                                                  g

                                                                                                                          to

                                                                                                                                      m
                                                                                                      m

                                                                                                               Au
                                                                                            M
                                                                            br

                                                                                                                      Oc

                                                                                                                                  ce
                                                                                                     ve
                                                                           Fe

                                                                                                                                 De
                                                                                                 No

& 7). These opposing trends can be explained through the dif-
                                                                         Source: Hidden Economy Survey on Population 2010, Center for the
ferent effects over time that the crisis has on the businesses
                                                                         Study of Democracy, Vitosha Research.
vs. the population. As mentioned earlier, the notable drop in
businesses’ revenues has likely prompted a process of laying off         The dynamics of the sub-indexes reveal in a greater detail
the share of employees with no formal contracts in an attempt            the actual trends in the hidden economy in Bulgaria, in-
to stay afloat in the beginning of the crisis in 2009. As the lat-       cluding the potential impact of government measures to
ter group has no legally binding relations to their employers,           counteract informal economic activities:
the termination of their employment seems to be a logical and
simple step towards preserving the business’ profit margins.             Tax Evasion and Avoidance of Fees,
Furthermore, the fall of businesses’ revenues renders tax avoid-         Customs, and Excise Duties
ance and reduction of social security contributions more, likely,
which may, in turn, explain the increase observed in the case            There has been a notable increase in sub-index “Redistribu-
of the index of hidden economy for businesses. These results             tion” in 2010 (Figure 8), including a rise in the incidence of
point out to the preeminence of economic and social policies             cases involving tax evasion, avoidance of customs, fees, and
in tackling hidden economy as compared to administrative and             excise duties, as well as VAT fraud. This trend confirms the
control measures, which seem to have been the instrument of              suggestion that, as businesses suffer through the recession,
choice for the Bulgarian government during the crisis.                   they become more likely to not declare part of their revenue

                                                                     5
No 28                                                              POLICY BRIEF                                                                                        April 2011

and economic activities, so as to avoid paying for taxes and                  official employment and concealing a share of the officially
social security contributions. In addition it is likely that return-          declared remuneration. Thus, in the longer run, both business
ing to business growth in 2010 has not been smooth but has                    and population indexes on hidden employment are expected to
rather occurred deal by deal, which has motivated businesses                  converge and return to the general trend of decline in line with
to resort to the more flexible and cost reducing practices of the             improving business climate and economic conditions.
hidden economy. It should also be mentioned that policy wise
the results show that increased controls in 2009 and 2010                     Figure 9. Dynamics of the Indexes “Hired Without Contract”
have not prevented the hidden economy from increasing. This                   and “Hired Under Contract with Hidden Clauses” in the respec-
comes at the backdrop of an unsound increase in excise du-                    tive sectors over the period 2002-2010 (min = 0, max = 10)
ties in 2010, which has created huge smuggling pressure in                         5
                                                                                            4,32
some consumer markets, such as cigarettes. It is likely that                    4,5
                                                                                                                                    3,6
                                                                                   4
publicly voiced and revealed misunderstandings between the                                          3,11         3,31     3,35                       2,97                         3,02
                                                                                3,5
                                                                                        3,63                                                 2,64              2,52      2,7
Ministry of Finance and the Ministry of Interior have addition-                    3
                                                                                2,5
ally helped reduce the positive impact of introduced controls.                     2
                                                                                                    2,47         2,21     2,36     2,41              2,19
                                                                                1,5
                                                                                                                                             1,9                 1,9     1,86     1,91
Figure 8. Dynamics of Sub-index Redistribution                                     1
                                                                                0,5
and its Components                                                                 0
     4,5

                                                                                                                                                     07

                                                                                                                                                              08
                                                                                                                        04
                                                                                                   03

                                                                                                                                            7
                                                                                                                                   5

                                                                                                                                                                       9
                                                                                        2

                                                                                                                                                                                 0
                                                   Redistribution sub -

                                                                                                             3

                                                                                                                                          00
       4

                                                                                                                                  00

                                                                                                                                                                       00
                                                                                       00

                                                                                                                                                                                01
                                                                                                            00

                                                                                                                                                    20

                                                                                                                                                            20
                                                                                                                        20
                                                                                                   20

                                                                                                                                        y2
                                                                                                                              r2

                                                                                                                                                                    r2
                                                                                       r2

                                                                                                                                                                             r2
                                                                                                            r2
                                                   index

                                                                                                                                                ne

                                                                                                                                                          st
                                                                                                                    ril
                                                                                              ch

                                                                                                                             be

                                                                                                                                                                  be
                                                                                   be

     3,5

                                                                                                                                                                            be
                                                                                                                                       ar
                                                                                                        be

                                                                                                                                                         gu
                                                                                                                  Ap

                                                                                                                                               Ju
                                                                                             ar

                                                                                                                                    nu
                                                                                                                             to

                                                                                                                                                                 to
                                                                                 m

                                                                                                                                                                         m
                                                                                                        m

                                                                                                                                                     Au
                                                                                            M
                                                                                ce

                                                                                                                         Oc

                                                                                                                                                              Oc

                                                                                                                                                                       ce
                                                                                                                                   Ja
                                                                                                    ve
      3
                                                                              De

                                                                                                                                                                       De
                                                                                                   No

     2,5                                                                                                Share of people hired without a contract
                                                   Evasion/non-
       2                                           payment of taxes,                                    Share of people hired on contracts with ‘hidden’ clauses
     1,5                                           fees, customs, and
      1                                            excise duties
                                                                              Source: Hidden Economy Survey on Businesses 2010, Center for the
     0,5                                           VAT fraud                  Study of Democracy, Vitosha Research.
       0
                        4

            gu 007

                                                                              Table 1. Share of Employed under no Employment
       De be 08

                       9
                       5
            Ju 007
             be 03

                       0
                       2

            Ap 003
           to 200

                    00
           nu 00

                    01
                    00

                    0
                    0

          Au 2
         Oc st 2

         ce r 2
         Ja er 2
                 y2
         ve ch 2

                 r2
                 r2

                r2

         Oc ril

               ne

             be
     be

              ar
             b

                                                                              Contract under Primary and Secondary Employment (%)
           ar

           to

           m
  m

           m
           M
 ce
De

           No

                                                                              (Share of those who responded with a “No” to the question
Source: Hidden Economy Survey on Businesses 2010, Center for the
Study of Democracy, Vitosha Research.                                         “Do you have a signed contract with your employer?”)

Hidden Employment                                                                                           Febru-           March          August            Septem-            Decem-
                                                                                                            ary              2004           2008              ber                ber
                                                                                                            2003                                              2009               2010
As regards the population, and in line with the overall in-
                                                                               Without                      6.0              5.9            5.6               5.9                3.4
crease in official unemployment, the index results for 2010                    labor
confirmed that hidden employment has decreased in Bulgar-                      contract –
                                                                               primary
ia during 2010. Once again, a possible explanation is busi-                    employment
nesses’ initial reaction to counteract the effects of the crisis               Without                      77.4             59.1           51.48             50.96              38.1
on them, by laying off employees with no formal contracts.                     labor
                                                                               contract –
This, in turn, has also reduced the incidence of hidden eco-                   secondary
nomic activities among the population.                                         employment

                                                                              Source: Center for the Study of Democracy, 2010.
The practice of hiring of workers with no labor contract flat-
tened out and saw little change from 2009 to 2010. However,                   In 2010, 11.6 % of the population reported having received
instances of employment under a contract with hidden clauses                  a remuneration higher than the one stated in their contract
(envelope wages) have been on the increase since 2008 (Figure                 with the primary employer (Figure 10). This represents a slight
9). As mentioned above, in the context of a downturn, the fast-               decrease in the incidence of undeclared payments since
est way to reduce costs to businesses is to terminate unreported              2009, when the respective share of the population receiving
or informal contracts first and then proceed to cutting down                  higher than declared remuneration was close to 13 %. Tak-

                                                                          6
THE IMPACT OF THE ECONOMIC CRISIS ON THE HIDDEN ECONOMY IN BULGARIA

ing into account the contraction in economic activity in 2010,                   the higher social insecurity of undeclared employment and
businesses have actually registered this decline as a relative                   income, which was immediately shed by the firms in the face
increase of the share of envelope wages in their costs (Figure                   of the downturn. Hidden Economy Index data shows that the
9). The tendency to underreport actual remuneration has im-                      share of undeclared social security income in total social secu-
portant implications for the social security system, as under-                   rity payment of companies might have remained unchanged
reported remuneration is also related to reduced payments                        or might have even increased, as it was lower paid, lower
of social security contributions. Failing to tackle such issues                  qualified persons that have suffered the most in the down-
in time leads to hasty and unpopular policy decisions for cor-                   turn. This is in line with the very modest increase in the aver-
recting social security imbalances such as the transfer of pay-                  age social security income in 2010 as reported by the National
ments from private to the public social security fund in 2010.                   Social Security Institute.
Bulgaria needs to account for the lost income and design a
comprehensive set of long-term economic and enforcement                          Table 2. Base Amount for Payment of Social Security
measures to tackle hidden employment. Alternatively it must                      Contributions under Primary Employment (%)
be prepared to face social security deficits and crises with                     (“What is the base amount for social security contributions under
each economic downturn in the future.                                            your primary employment contract?”)

                                                                                                    Febru-                      Septem-     Decem-
                                                                                                             March    August
Figure 10. Incidence of Payment of Remuneration                                                     ary                         ber         ber
                                                                                                             2004     2008
                                                                                                    2003                        2009        2010
Higher than the Stated in the Contract under
                                                                                  The minimum       12,1     13,4     13,5      12,9        10,3
Primary Employment in the Past Month (%)                                          social security
(“In the past month, have you received remuneration higher than                   threshold,
the stated in the contract with your primary employer?”)                          although
                                                                                  the total
  15
                                                                                  sum of my
                                                         12,9                     remuneration
  12
                                                                      11,6        is higher
                                         12,0
   9
                           10,4
                                                                                  The minimum       10,3     14,3     9,5       12,6        5,9
             10,0
                                                                                  social security
   6                                                                              threshold,
                                                                                  which is what
   3                                                                              I am actually
                                                                                  paid
   0
                                                                                  The amount        6,7      8,3      15,0      15,5        8,4
       February 2003   March 2004   August 2008   September     December
                                                     2009         2010            stated in
                                                                                  my contract
Source: Index of the Hidden Economy on Population 2010, Center                    even though
for the Study of Democracy, Vitosha Research.                                     the total
                                                                                  sum of my
                                                                                  remuneration
                                                                                  is higher
Trends in Social Security Contributions
                                                                                  The amount        68,3     63,4     61,8      56,2        67,0
                                                                                  stated in
The share of the employed that are socially insured on pay                        my contract,
                                                                                  which is what
rates lower than their actual remuneration had almost dou-                        I am actually
bled by 2009 since the onset of this index in 2003. In 2010                       paid
there has been a notable drop in the share of the employed                        Other             2,6      0,6      0,3       2,8         1,5
insured in accordance to the amount stated in their contract,                     Base              348      314      378       395         466
while receiving a higher (undeclared) remuneration. The same
though to a much lesser extent applies to the proportion of                      Source: Center for the Study of Democracy, 2010.

employed insured only on the basis of the minimum social
security threshold, while actually receiving a higher remunera-                  Policy Actions on Hidden Economy:
tion (Table 2). The proportion of employed persons that are                      Effects and Recommendations
insured on the minimum social security threshold, which also
corresponds to their actual remuneration has also declined                       The bulk of the measures undertaken by the government
(from 12.9 % in 2009 to merely 5.9 % in 2010). This reveals                      in 2010 to counteract the hidden economy were largely

                                                                             7
No 28                                                             POLICY BRIEF                                                    April 2011

targeting the hidden business turnover and hidden remu-                        hidden economy, the Bulgarian government has continued to
neration. Examples of measures directly or indirectly affect-                  show preference for punitive and corrective measures. While
ing the hidden economy in 2010 include:                                        this might be understandable in the face of mounting criticism
                                                                               on Bulgaria for failures in its law enforcement, it has created
     •   checks and revisions carried out by the National
                                                                               an additional administrative burden for compliant companies
         Revenue Agency and the Chief Labor Inspectorate;
                                                                               and citizens and has strained the limited resources of regulato-
     •   a restriction to cash payments of over 5000  to be                    ry bodies. The Hidden Economy Index results show that these
         carried out only through a bank transfer (applica-                    seem to have not produced the expected results. Moreover,
         ble to all legal and natural persons);                                increased regulatory checks, in particular of the National Rev-
     •   the bill limiting cash payments also introduced                       enue Agency, the Food Safety Agency, the National Construc-
         changes to the Labor Code; these changes involve                      tion Control Directorate, etc. have targeted too broad constit-
         the requirement for payment of employees’ wag-                        uencies, which is unlikely to produce tangible results outside
         es through a non-cash bank transfer;                                  temporary media campaigns. The overall financial results of
                                                                               such actions for the implementing agencies remain unclear,
     •   as of 2011, each cash registry/fiscal device in Bul-
                                                                               while their deterrence effect – questionable.
         garia will be connected to the computer system of
         the National Revenue Agency. Information from
                                                                               Economic and financial policies, which have a much higher
         fiscal devices will be ​​automatically available to
                                                                               potential positive impact than administrative pressure, have
         NRA, allowing for a remote access to data and in-
                                                                               not been used effectively to aid increased controls in 2010.
         stantaneous inspections;
                                                                               In effect many of the budget policies have put more incen-
     •   eased start-up for businesses through a reduction                     tives for hiding economic activity than for entering the offi-
         in the minimum capital requirement from 5,000                         cial economy. The two most exemplary cases in this direction,
         leva to 2 leva, and a reduction in the rates for em-                  which have created high public interest in 2010, have been:
         ployer contributions to social security.18
                                                                                   •   the sharp increase in excise duties, which has cre-
     •   a proposal to prohibit persons, who are proven to                             ated incentives for smuggling of excise goods,
         have managed poorly a commercial property, from                               most notably cigarettes;
         managing another enterprise;
                                                                                   •   the raising of social security thresholds for agricul-
     •   suggested measures to include electronic pay-                                 tural producers and self-employed persons.
         ments for public sector services, which requires the
                                                                               Bulgaria has managed to preserve macroeconomic stability
         existence of POS terminals in hospitals and other
                                                                               during the crisis without external help, which is a success
         medical centers, academic institutions, post offic-
                                                                               in itself. But the government’s financial and budgetary pol-
         es, offices of municipalities, etc.19
                                                                               icy in 2010 has been unclear, at times appearing contra-
     •   the introduction of more controls on excise goods                     dictory and chaotic, which has caused uncertainty among
         trade: (a) direct connection between all petrol stations’             business leaders, increasing their incentives for engaging
         pumps and the National Revenue Agency for real time                   in hidden economic activity. This use of EU programs for
         data communication; (b) introducing stricter licensing                business development in the country as an instrument for
         for cigarette retail outlets; (c) installing monitoring de-           reducing informality has remained low. Many companies
         vices on alcohol producing facilities with direct con-                have given up support from European funds because of
         nection to Customs agency control system, etc.                        burdensome procedures and extremely risk averse public
                                                                               administration. Like in the case of most of the regulatory
Although past lessons have clearly demonstrated the impor-
                                                                               control and compliance system increased control on the
tance of prevention and stimulus measures in countering the
                                                                               use of EU funds has been rather formalized, resulting in
                                                                               across the board rise in compliance costs for beneficiaries,
18
   IFC, (2011), “Doing Business 2011: making a difference for Entrepre-        while not addressing the gravest risks and irregularities.
neurs”, the World Bank Group.
19
   Forum on “Electronic Payments Against the Grey Economy”, Proposed
measures by VISA Europe and its Bulgarian members to counteract the grey
economy in Bulgaria, Sofia, 14 February, 2010.

                                                                           8
You can also read