The High Cost of Short-Term Rentals in New York City - David Wachsmuth David Chaney Danielle Kerrigan Andrea Shillolo Robin Basalaev-Binder ...
←
→
Page content transcription
If your browser does not render page correctly, please read the page content below
The High Cost of
                        Short-Term Rentals
                         in New York City

David Wachsmuth
David Chaney
Danielle Kerrigan
Andrea Shillolo
Robin Basalaev-Binder
January 30, 2018
         A report from the
         Urban Politics and Governance research group
         School of Urban Planning
         McGill University
                                                        1
Executive Summary

This report provides a comprehensive analysis of Airbnb activity in New
York City and the surrounding region in the last three years (September
2014 - August 2017). Relying on new methodologies to analyze big data,
we set out to answer four questions:

    1. Where is Airbnb activity located in New York, and how is it changing?
    2. Who makes money from Airbnb in New York?
    3. How much housing has Airbnb removed from the market in New
       York?
    4. Is Airbnb driving gentrification in New York?

KEY FINDINGS:

•   Two Thirds of Revenue from Likely Illegal              Manhattan neighborhoods the increase is
    Listings: Entire-home/apartment listings account       more than $700.
    for 75% ($490 million) of total Airbnb revenue
    and represent 51% of total listings. 87% of        •   4,700 Ghost Hotels: There are 4,700 private-
    entire-home reservations are illegal under             room listings that are in fact “ghost hotels”
    New York State law, which means that 66% of            comprising many rooms in a single apartment.
    revenue ($435 million) and 45% of all New              These ghost hotels have removed 1,400 units
    York Airbnb reservations last year were illegal.       of housing from the long-term rental market,
                                                           and are a new tactic for commercial Airbnb
•   13,500 Units of Lost Housing: Airbnb has               operators to avoid regulatory scrutiny.
    removed between 7,000 and 13,500 units
    of housing from New York City’s long-term          •   28% of Revenue: Commercial operators that
    rental market, including 12,200 frequently             control multiple entire-home/apartment listings
    rented entire-home listings that were                  or large portfolios of private rooms are only
    available for rent 120 days or more and                12% of hosts but they earn more than 28% of
    5,600 entire-home listings available for rent          revenue in New York City.
    240 days or more.
                                                       •   Top 10% of Hosts: The top 10% of hosts
•   $380 More in Rent: By reducing housing                 earned a staggering 48% of all revenue last
    supply, Airbnb has increased the median                year, while the bottom 80% of hosts earned
    long-term rent in New York City by 1.4%                just 32%.
    over the last three years, resulting in a $380
    rent increase for the median New York tenant       •   200% and $100K More: The median host of
    looking for an apartment this year. In some            a frequently rented entire-home/apartment

                                                                                                             2
Executive Summary

    listing earned 55% more than the median           •   “Airbnb as a Racial Gentrification Tool”:
    long-term rent in its neighborhood last year.         In March 2017, InsideAirbnb.com released a
    This disparity between short-term and long-term       report that categorized host photographs in
    rents is driving Airbnb-induced housing loss          all predominantly Black NYC neighborhoods.
    and gentrification. Nearly 300 unique listings        That report’s key findings have been cited in
    earned $100,000 or more last year.                    this new report:
                                                          • Across all 72 predominantly Black New
•   Racialized Revenue: White neighborhoods                    York City neighborhoods, Airbnb hosts
    make systematically more money on                          are 5 times more likely to be white. In
    Airbnb than non-white neighborhoods.                       those neighborhoods, the Airbnb host
    Neighborhoods with high existing Airbnb                    population is 74% white, while the white
    revenue (generally in Midtown and Lower                    resident population is only 14%.
    Manhattan) are disproportionately white. But          • White Airbnb hosts in Black
    the fastest-growing neighborhoods for Airbnb               neighborhoods earned an estimated
    (particularly Harlem and Bedford-Stuyvesant)               $160 million, compared to only $48
    are disproportionately African American.                   million for Black hosts—a 530% disparity.
                                                          • The loss of housing and neighborhood
•   72% of the Population: Nearly three                        disruption due to Airbnb is 6 times more
    quarters of the population in neighborhoods                likely to affect Black residents, based
    at highest risk of Airbnb-induced                          on their majority presence in Black
    gentrification across New York is non-                     neighborhoods, as residents in these
    white, as Airbnb continues to have a strongly              neighborhoods are 14% white and 80%
    racialized impact across the city.                         Black.

                                                                                                           3
Table of Contents
EXECUTIVE SUMMARY p. 2
INTRODUCTION p. 5
1. WHERE IS AIRBNB ACTIVITY LOCATED, AND HOW IS IT CHANGING? p. 9
2. WHO MAKES MONEY FROM AIRBNB? p. 18
3. HOW MUCH HOUSING HAS AIRBNB REMOVED FROM THE MARKET? p. 25
4. IS AIRBNB DRIVING GENTRIFICATION? p. 34
APPENDIX: DATA AND METHODOLOGY p. 43
REFERENCES p. 47
AUTHORSHIP AND FUNDING p. 48
ACKNOWLEDGMENTS p. 48
ABOUT UPGO p. 48
4
Introduction
Community groups and housing advocates in cities across the world
have begun to sound the alarm about the impact Airbnb is having on
affordable housing in their communities, citing concerns about housing
supply lost, racialized gentrification, and impact on residents’ quality of
life. To understand Airbnb’s impact on housing in New York, this report
presents a comprehensive analysis of three years of Airbnb activity in New
York City and the surrounding region. It relies on the most comprehensive
third-party dataset of Airbnb activity available, and new methodologies for
spatial analysis of big data.
AIRBNB AND ITS CRITICS IN NEW
YORK
Community groups and housing advocates York, displacing and otherwise disproportionately
in cities across the world have begun to affecting Black residents while accruing wealth for
sound the alarm about Airbnb’s impact on white residents (Cox 2017).
affordable housing in their communities, citing
concerns about housing supply lost, racialized Quality of life is also a concern for residents who
gentrification, and impact on residents’ quality have seen their neighbourhoods transformed
of life (see, e.g., BJH Advisors 2016; Lee 2016; into de facto hotel districts (Cócola Gant 2016).
Samaan 2015; New York Communities for In the fall of 2016, residents of New Orleans,
Change 2015; Wachsmuth et al. 2017; Wieditz still recovering from Hurricane Katrina, held a
2017). Several years ago, a study by New York jazz funeral at city hall (with coffins reading “RIP
Communities for Change and Real Affordability real neighbors” and “RIP affordable housing”)
for All found that Airbnb took approximately 20% to mourn neighbourhoods lost to Airbnb tourism
of vacancies off the market in certain Manhattan in a protest (Litten 2016). Meanwhile, hotel
and Brooklyn zip codes, and up to 28% in the East associations complain that short-term rentals
Village neighborhood, even though it is technically effectively function as hotels but have an unfair
illegal to rent an entire unit for fewer than 30 days advantage because they don’t pay taxes and don’t
in most buildings. Overall, they estimated that comply with safety and zoning regulations.
the 20 neighborhoods most popular on Airbnb
have lost 10% of rental units (NYCC and RAFA Airbnb has effectively created a new category
2015). These neighborhoods are also featured in of rental housing—short-term rentals—which
Airbnb’s neighbourhood guides. More recently, a occupies a gap between traditional residential
study found that Airbnb hosts are prone to reject rental housing and hotel accommodation.
African-American guests even if it means a loss in Nonetheless, Airbnb’s impact on cities and
possible income (Edelman et al. 2017). Another housing markets is not well understood, in
another study found that short-term rentals are part because the company takes great pains to
growing faster in Black neighborhoods in New cloud its operations from scrutiny. The New York
5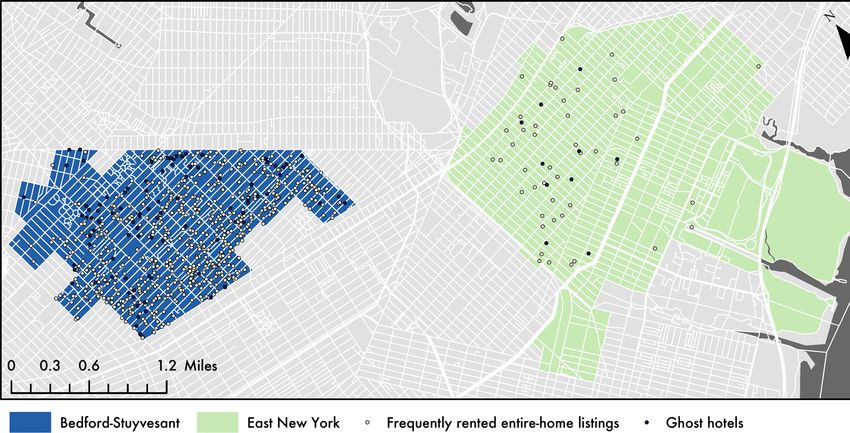
term is normally understood (occasional short-
term rentals of a family’s primary residence or a
room within the primary residence), but rather a
new form of de facto hotel.
Either concern, if justified, would represent a
serious problem for municipal authorities. But
reliable, up-to-date evidence has been hard to
come by. Accordingly, we set out to answer four
questions using rigorous empirical analysis:
1. Where is Airbnb activity located in New
York, and how is it changing?
2. Who makes money from Airbnb in New
York?
Attorney General, for example, was forced to 3. How much housing has Airbnb removed
subpoena Airbnb’s data for the city, which the from the market in New York?
company eventually provided only in anonymized 4. Is Airbnb driving gentrification in New
form. It was unclear how many transactions were York?
excluded, and the Attorney General’s office had to
accept the anonymization in good faith. The findings in this report are based on a
comprehensive study of three years of Airbnb
Airbnb’s business model has been particularly activity in the New York region. Relying on
controversial because it so clearly flouts existing estimates of Airbnb activity from the consulting
housing and land-use regulations in many or even firm Airdna, we measured and analyzed more
most of the cities in which it operates, and does so than 80 million data points, relying on new
in a fashion which appears to undermine policies spatial big data methodologies developed
aimed at protecting the supply of affordable specifically to analyze short-term rentals.
housing. Airbnb and its advocates insist that these (The methodology is outlined in detail in the
regulations must be updated to accommodate appendix.) We collected and analyzed data
the new possibilities presented by the sharing for the entire 20-million population New York
economy. Opponents argue that Airbnb aims metropolitan region, which includes significant
to avoid regulation and taxation, and threatens seasonal tourism destinations such as Long
affordable housing in cities. Island and the New Jersey Shore. These latter
areas receive large numbers of Airbnb tourists
each summer, and so are important components
REPORT OBJECTIVES of the region’s short-term rental activity. But
because the report’s focus is the relationship of
The report is motivated by the concerns short-term rentals to urban housing availability
increasingly raised by local communities and and affordability, we tend not to emphasize these
housing advocates that short-term rentals areas in our findings. Instead, we focus on New
are having a detrimental impact on housing York City. In general, we present all aggregate
availability and affordability in New York. These figures for a) New York City, b) the borough of
concerns are closely connected to a widespread Manhattan, c) the borough of Brooklyn, and d)
suspicion that a large amount of activity on short- the areas of the metropolitan region outside of
term rental platforms is not “home sharing” as the New York City.
6
SUMMARY OF KEY FINDINGS
The report provides detailed analysis of three $380 More in Rent: By reducing housing supply,
years of Airbnb activity in New York, including Airbnb has increased the median long-term rent
profiles of neighborhoods with disproportionate in New York City by 1.4% over the last three years:
shares of either total Airbnb activity or new a $380 rent increase for the median New York
growth. The key report findings are as follows: tenant looking for an apartment this year. In some
Manhattan areas the increase is $700 or more.
Two Thirds of Revenue from Likely Illegal
Listings: Entire-home/apartment listings 4,700 Ghost Hotels: There are 4,700 private-
account for 75% ($490 million) of total Airbnb room listings that are in fact “ghost hotels”
revenue and represent 51% of total listings. comprising many rooms in a single apartment
87% of entire-home reservations are illegal or building. These ghost hotels have removed
under New York State law, which means that 1,400 units of housing from the long-term rental
66% of revenue ($435 million) and 45% of all market, and represent a new tactic for commercial
Airbnb reservations in New York City last year Airbnb operators to avoid regulatory scrutiny.
were illegal.
28% of Revenue: Commercial operators that
13,500 Units of Lost Housing: Airbnb has control multiple entire-home listings or large
removed between 7,000 and 13,500 units of portfolios of private rooms are only 12% of hosts but
housing from New York City’s long-term rental earn more than 28% of revenue in New York City.
market, including 12,200 frequently rented
entire-home listings that were available for Top 10% of Hosts: The top 10% of hosts earned
rent 120 days or more and 5,600 entire-home a staggering 48% of all revenue last year, while
listings available for rent 240 days or more. the bottom 80% of hosts earned just 32%.
7
200% and $100K More: The median host of a            York is non-white, as Airbnb continues to have a
frequently rented entire-home/apartment listing      strongly racialized impact across the city.
earned 55% more than the median long-term
rent in its neighborhood last year. This disparity   “Airbnb as a Racial Gentrification Tool”:
between short-term and long-term rents is driving    In March 2017, InsideAirbnb.com released a
Airbnb-induced housing loss and gentrification.      report that categorized host photographs in all
Nearly 300 unique listings earned $100,000 or        predominantly Black NYC neighborhoods. That
more last year.                                      report’s key findings have been cited in this new
                                                     report: Across all 72 predominantly Black New
Racialized Revenue: White neighborhoods make         York City neighborhoods, Airbnb hosts are 5 times
systematically more money on Airbnb than non-        more likely to be white. In those neighborhoods,
white neighborhoods. Neighborhoods with high         the Airbnb host population is 74% white, while
existing Airbnb revenue (generally in Midtown and    the white resident population is only 14%. White
Lower Manhattan) are disproportionately white.       Airbnb hosts in Black neighborhoods earned an
But the fastest-growing neighborhoods for Airbnb     estimated $160 million, compared to only $48
(particularly Harlem and Bedford-Stuyvesant) are     million for Black hosts—a 530% disparity. The
disproportionately African American.                 loss of housing and neighborhood disruption due
                                                     to Airbnb is 6 times more likely to affect Black
72% of the Population: Nearly three quarters         residents, based on their majority presence in Black
of the population in neighborhoods at highest        neighborhoods, as residents in these neighborhoods
risk of Airbnb-induced gentrification across New     are 14% white and 80% Black.

                                                                                                            8
1. Where is Airbnb activity located, and how
is it changing?
In the last year, Airbnb growth in New York City has slowed down
considerably. Revenue-earning listings grew by only 4.5% (to 67,100)
citywide, and even shrunk by 3% (to 34,000) in Manhattan. Total host
revenue grew by 14% (to $657 million) between 2016 and 2017, a major
slowdown from the previous year’s growth rate of 35% (to $576 million).
However, growth remains strong in several North Brooklyn and North
Manhattan neighborhoods, even as it has stagnated in the areas with
historically the most short-term rental activity. Entire-home Airbnb listings
are a slim majority of total listings (51%, 34,300 listings) but account for
75% ($490 million) of total revenue. They predominate in Midtown and
Lower Manhattan and North Brooklyn, while private-room listings are
more common outside this core area. Nearly half of New York City listings
in a given month are hosting illegal reservations.
AIRBNB ACTIVITY ACROSS THE NEW
YORK METROPOLITAN REGION
In the past year (September 2016 - August 2017), are 67,100 listings receiving reservations at any
there were 67,100 listings reserved at least once given time—there is a large amount of churn in
on Airbnb in New York City — a 4.5% increase the market and, on average, half of the listings
from the previous year (64,200 listings), and a available on Airbnb in a given month receive at
37% increase from the year before that (48,800 least one reservation. Just over 50% (34,000)
listings). It is not the case, however, that there of these listings are in Manhattan, while 37%
Listings reserved Listings available Listings Listings
% increase over
at least once in at least once in reserved available
previous year
the last year the last year month-to-month month-to-month
New York City 67,100 4.5% 95,500 16,100 - 25,700 50,000 - 59,100
Manhattan 34,000 -3.0% 49,000 7,900 - 15,600 25,500 - 30,000
Brooklyn 25,000 9.3% 35,100 6,200 - 11,100 18,300 - 21,900
Rest of MSA 18,200 48% 25,000 3,700 - 10,200 12,500 - 18,200
Figure 1a. Airbnb listings in the New York region
9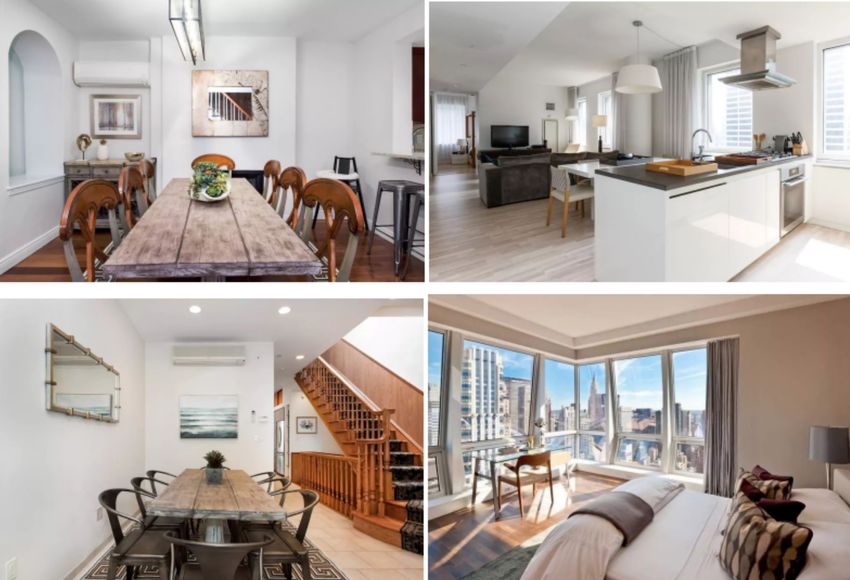
(25,000) are in Brooklyn. Although listings
in the former have decreased year-over-
year, they continue to grow robustly in the
latter. New York City is responsible for the
overwhelming majority of Airbnb activity
in the wider metropolitan region (the New
York MSA), but listings in the rest of the
MSA are growing at more than ten times
New York City’s rate (Figure 1a).

The number of revenue-earning listings
is the clearest indicator of the fluctuations
of the short-term rental market. Figure
1b aggregates this count and represents
it spatially in three heatmaps of revenue-
earning Airbnb listings, and indicates
both the expansion and intensification
of listing density in the New York region
over the last three years. Manhattan,
Midtown, the West Side, and the Lower East
Side have consistently seen the greatest
concentration of Airbnb activity; off the
island of Manhattan, only Williamsburg
in Brooklyn is comparable. In the last
two years, however, new hotspots have
been emerging in Brooklyn (Bushwick and
Bedford-Stuyvesant), Manhattan (the Upper
West Side and Harlem), and New Jersey
(Jersey City).

                                                Figure 1b. The growth in revenue-earning Airbnb listings,
                                                Sep 2014 - Aug 2017
10AIRBNB’S DECLINING GROWTH IN
NEW YORK: MANHATTAN DOWN,
BROOKLYN UP
Airbnb’s growth in New York City has decisively adjusted, as discussed in the Appendix.) Two
slowed down in the last year. For the year ending patterns are apparent. First, a slowdown in
August, total host revenue grew by 35% (to $576 listing growth across New York City, even as the
million) between 2015 and 2016, but only by rest of the region continues to grow. Second, a
14% (to $657 million) between 2016 and 2017. convergence between Manhattan and Brooklyn,
Figure 1c shows the month-to-month change with the latter borough drawing within a few
in the number of listings which receive at least thousand listings of the former for the first time
one reservation. (These figures are seasonally ever.
30,000 200%
150%
22,500
100%
15,000
50%
7,500
0%
0 -50%
Fe 4
M 6
15
5
17
15
Ju 6
Ju 7
M 5
O 6
A 7
M 15
Se 6
D 6
M 16
17
1
1
1
1
1
1
1
1
l1
1
ar
ug
ar
n
ay
ct
ar
n
p
ec
p
b
ec
p
ec
Ju
Se
Se
D
D
New York City Manhattan Brooklyn Rest of MSA
Figure 1c. Seasonally adjusted revenue-earning listings: month-to-month listings (left) and
year-over-year growth rate (right)
Even as the growth of new listings has slowed (although slowing) growth in Brooklyn (averaging
down in the last year, revenue growth in New 9% over the last six months).
York City has stagnated completely (Figure 1d.).
While the wider New York region has continued As a result of Manhattan’s decline in contrast
to see moderate (though slowed) revenue growth, to Brooklyn’s growth, the latter borough now
average year-over-year growth in the city has accounts for a historically large proportion of New
been flat for the last six months, with significant York City’s Airbnb activity—32% ($195 million) of
shrinkage in Manhattan (an average of -6% over monthly revenue at the end of the study period,
the last six months) balanced out by continuing compared to 27% ($114 million) at the beginning.
11$60M 200%
150%
$45M
100%
$30M
50%
$15M
0%
$0M -50%
Fe 4
M 6
15
5
A 7
17
15
Ju 6
Ju 7
M 5
O 6
M 15
Se 6
D 6
M 16
17
1
1
1
1
1
1
1
1
l1
1
ar
ug
ar
n
ay
ct
ar
n
p
ec
p
b
ec
p
ec
Ju
Se
Se
D
D
New York City Manhattan Brooklyn Rest of MSA
Figure 1d. Seasonally adjusted host revenue: month-to-month revenue (left), year-over-year
growth rate (right)
100%
75%
50%
25%
0%
N 4
Ja 4
M 5
M 15
Ju 5
5
N 5
Ja 5
M 16
M 6
Ju 6
6
N 6
Ja 6
M 17
M 7
Ju 7
7
1
1
l1
1
1
l1
1
1
1
1
1
1
l1
1
1
n
ar
ay
n
ar
ay
p
ov
p
ov
n
ar
ay
p
ov
Se
Se
Se
Figure 1e. New York City’s declining share of the region’s Airbnb host revenue
12Recent months have also seen the intensification of
a longer-term trend: over time, New York City has
accounted for a smaller and smaller proportion of
the New York region’s Airbnb activity. As Figure 1e
shows, each summertime New York City’s share
of total regional revenue plummets, since listings
outside the city are more likely to be seasonally
variable vacation homes. But, each year, New York
City’s peak share of revenue (in the winter) has
been lower than the one before it, and its lowest
share (in the summer) has been lower still. While
in 2015 August saw 82% of regional revenue go
to New York City, that proportion fell to 57% in
2017. Current trends suggest that, for the first
time, New York City will account for a minority of
monthly regional revenue in the summer of 2018.
THE SHIFTING DOMINANCE OF
ENTIRE-HOME LISTINGS
A majority of revenue-earning Airbnb listings
(51%, 34,300 listings) in New York City are
entire homes. Entire-home listings account for
a disproportionate share of host revenue—75%
of the total ($490 million out of $657 million).
However this proportion varies geographically;
broadly speaking, Manhattan has a far higher
proportion of entire-home listings than Brooklyn.
Figure 1f shows the variation in entire home listing
proportion across the region, and demonstrates
a concentration of entire-home listings stretching
continuously from Midtown Manhattan down
through Park Slope in Brooklyn.
The ratio of entire-home to private-room listings Figure 1f. Percentage of all revenue-earning listings which
has also been changing steadily over time. Entire are entire homes in the last year, by census tract
homes are accounting for fewer and fewer of all
active listings, and this pattern is consistent across and Manhattan, entire homes are now earning
New York City and each borough (although not proportionally more revenue in Brooklyn and
the rest of the region, where the proportion is outside New York City (Figure 1g). Since entire-
rising slightly). At the same time, the proportion of home and private-room Airbnb rentals have very
host revenue earned by entire-home listings has different implications for housing availability and
not declined at the same rate. Although they have regulatory compliance, these patterns will be
decreased slightly in number in New York City explored at length in the rest of the report.
13100% 100%
85% 85%
70% 70%
55% 55%
40% 40%
15
16
17
15
16
17
20
20
20
20
20
20
New York City Manhattan Brooklyn Rest of MSA
Figure 1g. Percentage of all revenue-earning listings (left) and host revenue (right) from entire homes
HOW MANY AIRBNB LISTINGS IN
NEW YORK CITY ARE ILLEGAL?
Under New York State’s Multiple Dwelling Law estimates of the frequency of these illegal rentals
(MDL), short-term rentals of fewer than 30 days because there is no way to reliably know if the
are illegal in buildings with 3 or more units owner is present. There are other reasons why
unless the owner is present. Any entire-home a short-term rental might violate of regulations,
rental of fewer than 30 days in such a building is notably for health and safety standards mandated
therefore almost certainly an illegal rental. Using by the New York City building code, but these
our dataset in combination with census-tract cannot be assessed using our existing dataset.
information from the American Community Survey
about building types, we are therefore able to Since the current iteration of the Multiple Dwelling
estimate what percentage of Airbnb reservations Law was passed in October 2016, we estimate
violate the MDL, and what percentage of listings that between 85 percent and 89 percent of entire-
are in violation of the MDL at any given time. home rentals to have been illegal each month.
This means, even assuming that all private-room
Private-room rentals will also violate the MDL if listings are legal, that between 43 percent and
the owner is not present, as would be the case 47 percent of reservations in New York City
with ghost hotels, but it is difficult to make reliable have been illegal. In any given month, between
147,600 and 12,700 listings have had illegal 2017 (when the revised law came into effect);
reservations—accounting for between 42 percent however, a similar decline occurred the previous
and 46 percent of all active listings. In total over year, suggesting that this was just seasonal
the last year, 45% of reservations were likely variation. When comparing the percentage of
illegal, and these illegal reservations generated listings with illegal reservations for the October to
66% ($435 million) of all host revenue. July period from the year before, similar patterns
and results are apparent, with between 43
Because Manhattan has a higher proportion of percent and 49 percent of all listings in violation
entire-home listings than the other boroughs, of the MDL from month to month (Figure 1h).
along with a much higher proportion of multi- At the same time, last year’s level of illegality
unit apartment buildings (in which entire-home was consistently higher than this year’s, a fact
short-term rentals are generally illegal), it also has which largely reflects the growing prominence
the highest proportion of illegal Airbnb listings. A of (presumptively legal) private-room listings on
majority (57%) of reservations in Manhattan last Airbnb in New York. The available evidence thus
year were illegal, and these illegal reservations leads to the conclusion that current regulations
generated 77% of revenue. In Brooklyn, 37% of may be having a modest impact on illegal
reservations and 58% of revenue were illegal. activity on the Airbnb platform. It is possible that
heightened regulatory scrutiny under the Multiple
A small decline in the non-compliance rate Dwelling Act is driving an observable shift in
occurred between October 2016 (when the Airbnb hosts from entire-home to private-room
Multiple Dwelling Law was revised) and January listings.
60%
50%
40%
30%
16
16
17
17
16
17
17
17
17
7
l1
n
b
ar
pr
ay
n
ct
ov
ec
Ju
Ja
Ju
Fe
O
M
A
D
N
M
% reservations which are illegal % listings w/ illegal reservations
% listings w/ illegal reservations (previous year)
Figure 1h. New York City reservations and listings in violation of the MDL
15High Revenue
Rev.-earning
Neighborhood Total revenue
listings
(component areas) (% growth)
(% growth)
Midtown Manhattan
8,800 $126 million
(Chelsea, Clinton, Mid-
(0.0%) (11%)
town, Upper West Side)
Downtown Manhattan
and Williamsburg
(Chinatown, East 12,400 $160 million
Village, SoHo-TriBeCa, (-9.2%) (1.1%)
West Village,
Williamsburg)
High Growth
Rev.-earning
Neighborhood Total revenue
listings
(component areas) (% growth)
(% growth)
Eastside Manhattan
(Central Harlem,
4,200 $52.1 million
Central Harlem South,
(4.7%) (26%)
Gramercy, East Mid-
town)
North-Central
Brooklyn
(Bedford, Bushwick
10,100 $75.7 million
South, Crown Heights
(10%) (23%)
North, East Williams-
burg, Park Slope,
Stuyvesant Heights)
Figure 1i. Location of highlight neighborhoods and Airbnb performance last year
NEIGHBORHOOD PROFILES
The broad patterns above can be refined by revenue, and the 10 other neighborhoods growing
analyzing a set of distinctive neighborhoods. the fastest, and clusters them in four groups
Figure 1i identifies the 10 New York City (Midtown Manhattan; Downtown Manhattan
neighborhoods with the highest total Airbnb host and Williamsburg; East Manhattan; and North-
16Central Brooklyn). The boundaries are taken The table in Figure 1h summarizes current
from neighborhood tabulation areas defined by performance and growth characteristics of Airbnb
the city government, which are meant to provide listings in each of the highlight neighborhoods.
a middle-ground between the very small census It demonstrates a clear divergence between the
tracts used elsewhere in the report, and the very historic Airbnb hotspots in Manhattan—which at
large community districts used for city planning this point appear to be largely saturated, with an
purposes. The map demonstrates at a glance that average revenue growth rate of only 4.6% in the
Airbnb’s areas of historic intensity are on the west last year—and new emerging hotspots further
side and downtown of Manhattan, while the newer from the center, which are bucking the city-wide
areas of growth are in Brooklyn and outlying parts trend of growth stagnation and grew their revenue
of Manhattan. on average 24% in the last year.
172. Who makes money from
Airbnb?
Airbnb revenue is distributed highly unequally among hosts in New York
City. Commercial Airbnb operators, who have multiple entire-home listings
or large portfolios of private rooms, are 12% of hosts but earn more than
one quarter of revenue in New York City. The top 10% (5,000) of hosts
earned a staggering 48% ($318 million) of all revenue last year, while the
bottom 80% (40,400) of hosts earned just 32% ($209 million). The median
listing earned a modest $4,100 last year, but at the high end of the market,
more than 280 listings earned $100,000 or more.
REVENUE GROWTH AND
DISTRIBUTION
The previous chapter established that Airbnb host revenue performance, because, even with a
revenue growth is slowing in New York City—most relatively lower growth rate than previous years,
notably in Manhattan, Airbnb’s traditionally most many hosts joined in the middle of the last twelve
lucrative submarket. This state of affairs makes all months, and hence drag down average annual
the more urgent the question of who is earning revenue. An arguably more accurate portrait of
the revenue, since there may no longer be a listing performance can be seen by examining
“rising tide to lift all boats”. The simple answer only those listings which were active throughout
is that revenue is distributed in a highly uneven the entire last twelve months. The same pattern
fashion among New York hosts. Figures 2a and is visible here, with the average revenue roughly
2b summarize key statistics related to Airbnb double the median revenue. This indicates that,
revenue in the last year, and show large disparities even among dedicated, long-term Airbnb listings,
between both geographical regions and individual there is a large disparity in revenue earnings.
hosts. On the first point, the most notable disparity
is between Manhattan and Brooklyn: the former Another way of analyzing inequality in revenue
has high revenue per listing but slow growth, while earning among Airbnb hosts is to look at earning
the latter has low revenue per listing but faster percentiles. There were 50,500 income-earning
growth. Across all geographies, the large gap hosts in New York City last year, who earned
between average revenue per listing and median nearly $660 million between them. Just ten
revenue per listing reveals the unequal distribution percent of these hosts earned half that revenue
of revenue: in general, where the average of a (48%, $319 million), and the top twenty percent
set of cases is much higher than the median, it of hosts earned a staggering 68% ($448 million)
indicates that a relatively small number of cases of all host revenue. The top 1% of hosts, each of
has pulled the average higher than the level at whom earned substantially more than $100,000
which most cases are clustered. However, focusing on Airbnb last year, managed to earn 12% of
on revenue characteristics of all active listings total revenue ($76 million). As Figure 2c shows,
in the last twelve months will tend to understate this unequal distribution of host revenue looks
18Total revenue Average rev. Median rev. Average rev. Median rev.
(year-over- per rev.- per rev.- per listing per listing
year earning earning active active
growth) listing listing year-round year-round
$657 million
New York City $9,800 $4,100 $17,200 $10,200
(14%)
$414 million
Manhattan $12,200 $5,300 $22,200 $13,800
(8.5%)
$195 million
Brooklyn $7,800 $3,300 $13,700 $8,400
(21%)
$211 million
Rest of MSA $11,600 $5,000 $17,000 $9,100
(82%)
Figure 2a. Revenue earned by Airbnb listings in the last year
$90M
$60M
$30M
$0M
14
Ja 4
M 15
N 6
M 5
Ju 5
5
N 5
Ja 5
M 16
M 6
Ju 6
6
Ja 6
M 17
7
M 7
Ju 7
l1
1
1
1
1
1
l1
1
1
l1
1
1
1
1
n
ar
ay
n
ar
ay
p
ov
p
ov
n
ar
ay
p
ov
Se
Se
Se
N
Other NYC Manhattan Brooklyn Rest of MSA
Figure 2b. Geographic components of seasonally adjusted host revenue
19very similar for the different New York region These statements misleadingly suggest that most
geographies. The concentration of Airbnb Airbnb reservations are hosted by small-scale,
revenue among an extremely narrow segment part-time hosts. In fact, half of rentals on the
of hosts provides vital context for debates about Airbnb platform are being conducted by only 10%
the benefits of home sharing to middle-class of hosts. While the median New York host earned
families—for example Airbnb’s (2014) claim that $5,200 last year, the top 10% earned a median
“87% of Airbnb hosts in New York share only the of $33,700—more than six times as much. And
home in which they live. And 62% of Airbnb hosts many of these top earners, as we will explore
said Airbnb helped them stay in their homes.” shortly, are unambiguously commercial operators.
12%
11%
Top 1%
11%
16%
48%
47%
Top 10%
48%
50%
68%
67%
Top 20%
68%
69%
32%
33%
Remaining 80%
32%
31%
0% 35% 70%
New York City Manhattan Brooklyn Rest of MSA
Figure 2b. Geographic components of seasonally adjusted host revenue in the last year
COMMERCIAL OPERATORS
The term “home sharing” conjures an image of a of May to August, among the 56,300 listings in
family occasionally renting a spare room in their the region which were reserved at some point
home, or perhaps renting their entire home for during these four months, the median listing was
a brief period of time while they are out of town. rented for 7 or 8 nights per month. And yet, as
And, indeed, this occasional use characterizes the the revenue distribution figures presented above
majority of Airbnb hosts in New York. For example demonstrate, these occasional hosts might be the
in summer 2017, during the peak tourism season numerical majority of hosts, but they account for
20a surprisingly small proportion of the actual rental about the nearly 20,000 multi-listings in New York
activity on Airbnb and earn a surprisingly small City. Each of these listings, and the 28% ($184
proportion of the actual revenue. million) of total platform revenue they represent, is
by definition a commercial operation which does
One way to isolate commercial operators is to look not represent any reasonable definition of “home
at hosts who have multiple listings on Airbnb. In sharing”. Instead, these are de facto hotel units
particular, a host with more than one entire home which, as the next chapter will explore, are in direct
listing is by definition a commercial operator, since competition with long-term housing for New Yorkers.
only one of their listings could be their primary
residence. Estimating commercial operators this way Multi-listing hosts consistently earn a
will dramatically underestimate their numbers, since disproportionate share of revenue. In the last
it will fail to identify hosts who have a single listing year, for example, they were just 12% of all
which is not their primary residence and which they revenue-earning hosts in New York (6,200 out
run as a business, and it will fail to identify hosts of 50,500), but earned 28% of revenue ($184
who have operate their listings via multiple Airbnb million out of $657 million). Their share of
accounts, but it is a useful first approximation. We revenue, however, has been declining substantially
define a “multi-listing” as an entire-home listing across all geographies, despite an ongoing rise
whose host has at least one other entire-home in the proportion of listings which are multi-
listing, or a private-room listing whose host has listings (Figure 2e). Multi-listings continue to earn
at least two other private-room listings. (We set a disproportionately high share of revenue, but
a higher threshold for private-room multi-listings by a much narrower margin than in previous
to avoid falsely include a pair of spare rooms in years. This appears to be a result of a shift in
a host’s primary residence; there will be very few the composition of multi-listing units from entire
homes in the New York region that have both a homes to private rooms. Across all geographies,
primary resident living in them and three or more private room multi-listings have grown
spare bedrooms.) Figure 2d summarizes basic facts dramatically as a share of all listings, while entire-
Entire-home multi- Private-room
Multi-listing revenue
listings (% of all entire- multi-listings (% of all
(% of total revenue)
home listings) private-room listings)
New York City 8,300 (24%) 7,700 (25%) $184 million (28%)
Manhattan 5,200 (25%) 2,700 (22%) $110 million (27%)
Brooklyn 2,400 (22%) 3,300 (25%) $56.9 million (29%)
Rest of MSA 4,300 (39%) 2,400 (37%) $78.0 million (37%)
Figure 2d. Multi-listing hosts in the New York region last year
2140%
30%
20%
10%
0%
15
16
17
15
16
17
15
16
17
20
20
20
20
20
20
20
20
20
New York City Manhattan Brooklyn Rest of MSA
Figure 2e. Percentage of revenue earned by multi-listings (left), and proportion of revenue-
earning entire-home listings (center) and private-room listings (right) which are multi-listings
home multi-listings have declined in the last year. The New York region has a number of extremely
Below we discuss the possibility that this trend large Airbnb commercial operators. In particular,
represents a deliberate strategy of commercial there are seven currently active hosts who control
operators to shift their listings away from (illegal) more than 100 listings. Most of these, however,
entire homes to private rooms, by relisting entire are vacation rental companies active in traditional
homes as multiple private rooms. vacation areas, such as Long Island and the New
# of revenue-earning Approximate annual
Top Host Main area of operation
listings revenue
“West Village” Manhattan 7 $700,000
(Host closed account) Manhattan 16 $450,000
“Anthony and Laura” Queens 7 $450,000
Manhattan and Long $400,000 in NYC,
“Lisa” 5
Island $250,000 outside
Manhattan and Long
“Tatiana” 9 $400,000
Island
Figure 2f. The largest commercial operators by revenue in New York City last year
22Jersey Shore. The largest commercial operator
in the region by revenue earned, for example, is
Symbol Management, a vacation rental company
based in the Hamptons. It only entered the Airbnb
market in February of 2017, but has nearly 300
entire homes listed on the service, and appears to
have already earned nearly $1.5 million on the
platform in half a year. Unlike some other cities,
New York does not appear to see a dominance of
its central city Airbnb market by very large firms
with dozens or hundreds of listings. The top-earning
host in New York City made $700,000 last year
renting four entire homes and three private rooms.
The five largest commercial operators by revenue
in New York City are summarized in Figure 2f. (It
is important to note that, because this population
is extremely small, the uncertainty about these
estimates is much higher than with the rest of the
revenue estimates in the report, which are generally
aggregating hundreds or thousands of listings.)
Figure 2g shows the listing distributions of the
entire-home listings for the four commercial
operators of entire-homes listings in New York City.
Each listing controlled by a single host is connected
by a thin line to emphasize the spatial extent of
each host’s holdings. As the map indicates, among
the largest operators, entire-home multi-listings are
concentrated in Manhattan. Two of the hosts (shown
in blue and purple on the map) have all their listings
in Midtown and Downtown Manhattan. A third host
(in green) has listings concentrated in Manhattan
but with several in adjacent areas in Brooklyn. Only
the largest operator (shown in red) has significant
non-Manhattan listings, although these are in fact
Figure 2g. The four largest commercial operators of entire-
west and north of New York City altogether. home listings in New York City last year
THE HIGH END OF AIRBNB IN NEW
YORK CITY
The preceding sections demonstrated that look like in New York City? More than 280
a disproportionate amount of Airbnb host listings earned more than $100,000 last year,
revenue is earned by a small high-end of hosts but the very highest-earning Airbnb listings
and commercial operators. What does that in the city (which earned $200,000 or more)
23Average Average Average
Location Listing title excerpts annual annual nights nightly
revenue booked rate
“Ultra-Modern”, “West Village
Townhouse”, “New Modern
Manhattan $281,000 241 $1,170
Townhouse”, “Heart of New
York”, “Midtown Triplex”
“Gorgeous Townhouse in
Williamsburg”, “6BR Duplex”,
Brooklyn “7 Bedrooms”, “Heart of $158,000 236 $670
Williamsburg”, “Gorgeous
Historic Brownstone”
Figure 2h. The five highest-earning Airbnb properties in Manhattan and Brooklyn
are concentrated exclusively in Manhattan—in 240 nights a year (close to the feasible maximum,
Midtown and Greenwich Village. Brooklyn’s top given the need for cleaning). All of the top
earning properties, meanwhile, are nearly all in Manhattan listings advertise their luxuriousness,
Williamsburg. Some characteristics from these prime location, and high-end facilities (Figure 2i).
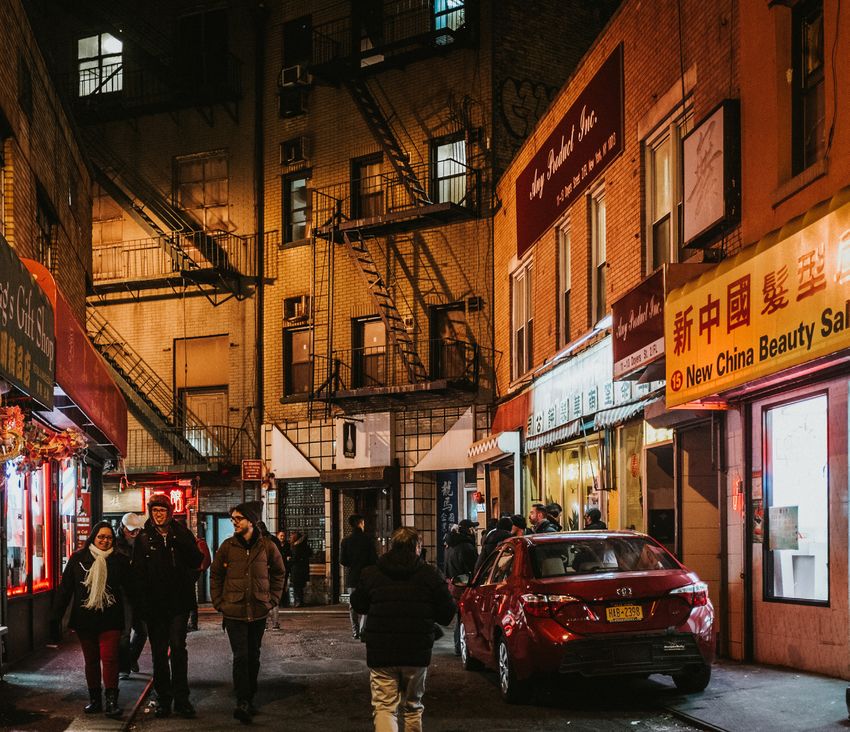
properties are summarized in Figure 2h. The top- In a review of a Manhattan townhouse, one guest
earning listings in both Manhattan and Brooklyn noted “We usually stay in 5 star hotel suites in NYC
were booked extremely frequently—on average and in comparison this is a great price point.”
Figure 2i. Photos from top-earning Airbnb rentals in New York City
243. How much housing has Airbnb
removed from the market?
Airbnb has removed between 7,000 and 13,500 units of housing from
New York City’s long-term rental market. In the last year, 12,200 entire-
home listings were frequently rented (rented 60 days or more, and
available 120 days or more), while 5,600 entire-home listings were very
frequently rented (rented 120 days or more, and available 240 days
or more). These listings are concentrated in Midtown and Downtown
Manhattan, but are growing rapidly in Brooklyn, and taking up a larger
and larger portion of the overall Airbnb market over time. Additionally,
spatial cluster analysis reveals that 4,700 private-room listings are in fact
“ghost hotels” comprising many rooms in a single apartment or building.
This is perhaps the fastest growing category of listing in all of New York,
and may represent a tactic for commercial Airbnb operators to avoid
regulatory scrutiny.
ENTIRE HOMES CONVERTED TO
DEDICATED AIRBNB RENTALS
Despite Airbnb’s public-relations focus on small on Airbnb were prohibited, both these types of unit
scale and occasional uses of its platform—the would end up on the long-term rental market.
way, for example, that homeowners can help meet
their mortgage payments by hosting occasional Defining the threshold at which an Airbnb listing
guests—most regulatory scrutiny of short-term is likely to have departed the long-term housing
rentals has been focused on entire homes which market is difficult. There are probably people
are frequently rented or available on short- who travelled extremely frequently during a year,
term rental platforms. This is for good reason: and were able to keep a unit as their primary
every home converted to full-time Airbnb use residence while still renting it on Airbnb for 200
is subtracted from the pool of long-term rental days in the year. And there are probably people
housing units in a city. In many cases, full-time, who listed their unit year-round but set too high a
entire-home Airbnb listings would have housed price or were in an area with insufficient demand,
long-term tenants, whom the landlord evicted or and it only rented 25 days in total despite being
failed to replace after they left. In other cases, otherwise unoccupied by a long-term resident.
particularly in recently built apartments and Setting the threshold too low will generate many
condominiums, the unit has spent its entire lifetime false positives—for example by counting as “full-
on the short-term rental market. Such listings time” an apartment which was on Airbnb for a few
were not literally “removed” from the long-term weeks after one long-term tenant moved out and
market, but they represent exactly the same loss before another moved in, or an apartment which
of potential rental housing as units that were the long-term inhabitant puts on Airbnb during
directly removed. If full-time, entire-home rentals periods of occasional travel. On the other hand,
25setting the threshold too high will generate many
false negatives, and end up underestimating the
impact Airbnb is having on housing markets.
We use two metrics to estimate frequent Airbnb
usage: the number of days per year that a unit
is booked (“occupancy”), and the number of
days that a unit is either booked or available to
be booked (“availability”). We define “frequently
rented” as 60 days of occupancy and 120 days of
availability. Sixty days of occupancy rules out most
scenarios of occasional short-term rental, such as
a landlord taking advantage of a one-month gap
between long-term tenants, or a family leaving on a
one-month summer vacation. Setting an additional
constraint of 120 days of availability prevents the
inclusion of listings which are rented relatively
infrequently but with extremely high efficiency; for
example, a homeowner who was out of town every
weekend and listed their unit on Airbnb would only
have 104 days of availability, and so would not be
counted as “full-time” by our criteria even if they
managed to rent the unit for 60 of those days.
We also define a more stringent threshold of “very
frequently rented” as 120 days of occupancy and
240 days of availability. While it is likely that very
few frequently rented listings can also house long-
Entire-home
Percentage of
Entire-home listings listings rented
revenue-earning Year-over-year
rented 60 days and 120 days and
entire-home growth rate
available 120 days available 240
listings
days
New York City 12,200 36% 14% 5,600
Manhattan 7,000 34% 20% 3,100
Brooklyn 4,200 38% 14% 2,000
Rest of MSA 3,200 29% 80% 1,100
Figure 3a. Frequently rented (60/120) entire-home listings in the New York region last year
2660 days reserved 13,600
60 reserved, 120 available 12,200
90 reserved, 120 available 9,800
120 reserved 7,500
120 reserved, 240 available 5,600
0 5,000 10,000 15,000
Figure 3b. Entire-home listings in New York City at different thresholds of “frequently rented”
term resident, it would be nearly impossible for a In New York City, revenue-earning listings increased
very frequently rented listing to have a long-term by 4.5% last year (from 64,200 to 67,100). By
resident, since these listings are on Airbnb for at contrast, frequently rented entire-home listings
least 8 months of the year, and have short-term increased by 14% in New York City (from 10,700 to
tenants for at least 4 months. 12,200). In other words, frequently rented entire-
home listings are growing at approximately three
According to these thresholds, there are 12,200 times the overall listing growth rate.
entire-home Airbnb listings in New York City which
were frequently rented in the last year—5,600 of The significance of the frequently rented entire-
which were very frequently rented. These figures home listings becomes even clearer when they
set reasonable upper and lower bounds on the are expressed as a percentage of total housing
number of housing units which have been removed on a neighborhood scale. Figure 3c shows the
from New York’s housing market by Airbnb. The proportion of total housing in each census tract that
5,600 very frequently rented entire homes have is frequently or very frequently rented on Airbnb
almost certainly been subtracted from the city’s over the last three years. It reveals significant areas
rental housing supply. The 12,200 frequently rented of the city where 2% or more of total housing
entire homes may also all have been removed stock has either already been lost to Airbnb or is
from the long-term rental market; at minimum, at serious risk of being lost. Figure 3d summarizes
they are at high risk of being removed. Figure 3a these patterns for the highlight neighborhoods,
summarizes key facts related to frequently rented demonstrating that there are entire neighborhoods
entire-home listings, while Figure 3b contextualizes where more than 1% of housing has been lost or
these estimates by showing the number of entire- is under threat of being lost to Airbnb, along with
home listings in the New York region which meet a other areas where the year-over-year growth rate
series of different definitions of “frequently rented”. of these listings has exceeded 30%.
27Figure 3c. The proportion of total housing units frequently (60/120) and very frequently (120/240) rented in New York
28High Revenue
Number of 60/120 frequently % of all housing units
Neighborhood
rented listings (% growth rate) frequently rented on Airbnb
Midtown Manhattan 2,000 (0.8%) 1.1%
Downtown Manhattan
2,700 (-2.3%) 1.6%
and Williamsburg
High Growth
Number of 60/120 frequently % of all housing units
Neighborhood
rented listings (% growth rate) frequently rented on Airbnb
Eastside Manhattan 900 (17%) 0.7%
North-Central Brooklyn 1,700 (32%) 0.9%
Figure 3d. Frequently rented (60/120) Airbnb listings in the highlight neighborhoods last year
NEW YORK’S GHOST HOTELS
It is likely that most private-room listings on Airbnb long-term tenant. Private room listings, by contrast,
are rented by primary residents with a spare room. are generally assumed to have little if any impact
But using spatial analysis we have identified 4,700 on housing markets, since they generally do not
listings across New York City (16% of all private- displace renters. This assumption is clearly false in
room listings in the city) which are in fact “ghost a city such as New York where a high percentage of
hotels”—entire units or even whole apartment renters live with roommates. A primary tenant who
buildings which have been converted into many might have previously listed a spare bedroom on
private-room listings by the owner. These 4,700 Craigslist and found a long-term tenant can now
listings form 1,200 discrete ghost hotels, a number list the spare bedroom on Airbnb. But the impact of
which has increased 79% since 2015 (far faster private-room Airbnb rentals on the long-term rental
than the overall rate of Airbnb growth in New market for roommates is difficult to estimate without
York). All told, New York’s ghost hotel operators extensive surveying and interviews to determine
earned $30.4 million on Airbnb last year. what residents were previously doing with the
rooms which they are now renting on Airbnb.
Most discussion of Airbnb’s impact on housing
availability and affordability focuses on entire- There is another possible way in which private-
home listings, and for good reason—these are the room Airbnb rentals may be reducing rental
listings which, if rented sufficiently often throughout housing supply for long-term tenants, though.
the year, by definition can no longer be housing a This is the question of whether entire units or
29apartment buildings are being converted into what short-term rentals often assumes the benignness
the Canadian housing advocacy group Fairbnb of private-room rentals, because these are thought
has called “ghost hotels” (Wieditz 2017). Ghost to be hosted by owner- or renter-occupiers and
hotels are entire units or buildings whose individual thus not removing any rental housing options for
bedrooms have been listed individually on Airbnb local residents. The fact that thousands of these
as private rooms. There are various reasons a listings are actually a surreptitious mechanism
host might choose to list their units this way, but for converting apartments (and entire apartment
given that short-term rentals of entire homes buildings) into hotels is an important fact to be
are generally illegal in New York, converting added to the public debate. For example, here is a
apartments into ghost hotels would be a convenient guest review from a private-room listing in one of
way for a host to avoid regulatory scrutiny. the most lucrative ghost hotels in New York:
Using spatial cluster analysis, we identified This is made to look like a couple sharing their
groupings of private rooms rented by a single host home on AirBNB, but it’s actually more like a
which are highly likely to be located in the same hostel run by multiple people. Very misleading
building. The results are startling: across New York listing. There are like 20ish tiny rooms and you
City, there are 1,200 ghost hotels, comprising can hear people snoring and cleaning and such....
over 4,700 separate private-room listings. Each Additionally, for those who believe every small
of these ghost hotels has removed rental housing room is “private”, it’s actually not. On my check in,
from the long-term rental market. Most of these I was given room keys for room 116, but my room
ghost hotels comprise three to five private-room was 115, but my key still worked for room 115. My
listings, and thus appear to be single apartment first day there, I got curious and tried using the keys
units. But some have 10 or more listings, and thus on room 116 as well, and they actually worked.
are almost certainly multiple units in a building— The door key to every single “room” is the same.
or an entire building—listed on Airbnb by the
landlord. (The top three ghost hotels are detailed The second striking fact is the scale and
in Figure 3e; a traditional hostel which has listed distribution of the ghost hotel phenomenon. Figure
its rooms on Airbnb has been excluded.) 3f shows the locations of all the ghost hotels
operating in New York City over the last twelve
Three facts are striking about New York City’s months (the size of points is proportionate to the
ghost hotels. The first is the simple fact of their number of private rooms in the ghost hotel). There
existence. Public discussion and debate about are ghost hotels across all five boroughs, although
Average # of annual
# of revenue-earning Approx. annual
Example listing title nights booked per
rooms revenue
room
“[301] 5 minute WALK to Times
11 180 $350,000
Square”
“Interfaith Retreat Guest Rooms
11 260 $200,000
(Seva)”
“Large Room 15 Minutes to
12 220 $200,000
Manhattan”
Figure 3e. The largest three ghost hotels in New York City last year
30Figure 3f. Locations of the 1,200 likely ghost hotels in New York City
Brooklyn has the most in both absolute and substantially faster than either of these categories,
proportional terms. These hotels earn on average nearly doubling over the same time period. In the
$6,400 per room annually, which is 27% higher year ending August 2015, there were 670 ghost
than non-ghost-hotel private-room listings (which hotels, comprising 2,600 listings and earning a
earn $5,100 annually). In total, New York City’s total of $19.3 million for the year. Two years later,
ghost hotels earned $30.4 million dollars—which the number of ghost hotels had increased 79% to
is 19% of all the revenue earned by private-room 1,202, comprising 4,700 private-rooms (an 84%
Airbnb listings in the city. increase) earning $30.4 million (a 58% increase).
These facts are summarized in Figure 3g, and
The final striking fact about New York’s ghost clearly demonstrate that ghost hotels are a rapidly
hotels is their growth rate. Over the last two years, growing portion of Airbnb activity in New York City.
the number of revenue-earning listings in New This portion has so far flown under the radar of
York City has grown 37%, from 48,800 in the regulatory scrutiny despite the fact that it is taking
September 2014 - August 2015 year to 67,100 an increasingly large number of apartments off the
in the September 2016 - August 2017 year. In long-term housing market for New York residents.
the same time period, the number of revenue- Given that every ghost hotel is by definition a
earning private-room listings has grown 55%, commercial operation and not “home sharing”,
from 19,600 to 30,300. Ghost hotels are growing new regulatory scrutiny seems warranted.
31You can also read