THE HIGH MARGIN PRECIOUS METALS COMPANY - March 2021 Corporate Presentation

Page created by Patricia Yang
 
CONTINUE READING
THE HIGH MARGIN PRECIOUS METALS COMPANY - March 2021 Corporate Presentation
THE HIGH MARGIN
PRECIOUS METALS COMPANY

March 2021
Corporate Presentation
THE HIGH MARGIN PRECIOUS METALS COMPANY - March 2021 Corporate Presentation
CAUTIONARY STATEMENTS
CAUTIONARY NOTE REGARDING FORWARD-LOOKING STATEMENTS
The information contained in this Presentation contains “forward-looking statements” within the meaning of the United States Private Securities
Litigation Reform Act of 1995 and “forward-looking information” within the meaning of Canadian securities legislation. There can be no assurance that
forward-looking statements will prove to be accurate, as actual results and future events could differ materially from those anticipated in such
statements.

Readers are strongly cautioned to carefully review the cautionary notes to this Presentation and in particular:

Note 1 at the end of this Presentation contains our cautionary note regarding forward-looking statements and sets out the material assumptions and
risk factors that could cause actual results to differ, including, but not limited to, fluctuations in the price of commodities, the impact of the COVID-19
virus pandemic, outcome of any audits by the CRA of Wheaton Precious Metal’s tax filings, the absence of control over mining operations from which
Wheaton Precious Metal purchases precious metals or cobalt, and risks related to such mining operations and continued operation of Wheaton
Precious Metal’s Counterparties. Readers should also consider the risks identified under “Risks and Uncertainties” in Management's Discussion and
Analysis (“MD&A”) for the period ended December 31, 2020, available on SEDAR and Wheaton Precious Metals' Form 6-K filed March 11, 2021,
available on EDGAR. Readers should also consider the section entitled “Description of the Business – Risk Factors” in Wheaton Precious Metals’
Annual Information Form and Form 40-F for the year ended December 31,2019 filed March 30, 2020 and available on SEDAR and EDGAR. Where
applicable, readers should also consider any updates to such “Risks and Uncertainties” that may be provided by Wheaton Precious Metals in its
Annual Information Form and Form 40-F to be filed on SEDAR and EDGAR for the period ended December 31, 2020 as well as any subsequently filed
quarterly MD&A.

Note 2 at the end of this Presentation contains our cautionary note regarding the presentation of mineral reserve and mineral resource estimates.

The full presentation is available on Wheaton’s website (www.Wheatonpm.com). All values referenced on the presentation are in US dollars unless
otherwise noted. In accordance with Wheaton Precious Metals™ Corp.’s (“Wheaton Precious Metals”, “Wheaton” or the “Company”) MD&A and
financial statements, reference to the Company includes the Company’s wholly owned subsidiaries.

                                                                                                                                                         2
THE HIGH MARGIN PRECIOUS METALS COMPANY - March 2021 Corporate Presentation
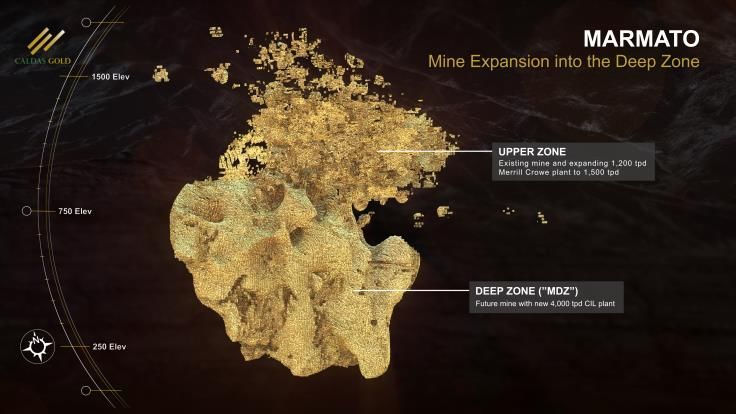
WHO IS WHEATON PRECIOUS METALS?
THE HIGH MARGIN PRECIOUS METALS COMPANY - March 2021 Corporate Presentation
WHEATON PRECIOUS METALS
A MODEL DESIGNED TO BENEFIT ALL STAKEHOLDERS

   Our Vision         To be the world’s premier precious metals investment vehicle.

  Our Mandate         To deliver value through streaming to all of our stakeholders:
                                                   .

   To our Shareholders,               To our Partners,              To our Neighbours,
 by delivering low risk, high     by crystallizing value for      by promoting responsible
quality, diversified exposure      precious metals yet to      mining practices and supporting
  and growth optionality to             be produced             the communities in which we
       precious metals                                                 live and operate

                                                                    Wheaton Precious Metals   4
THE HIGH MARGIN PRECIOUS METALS COMPANY - March 2021 Corporate Presentation
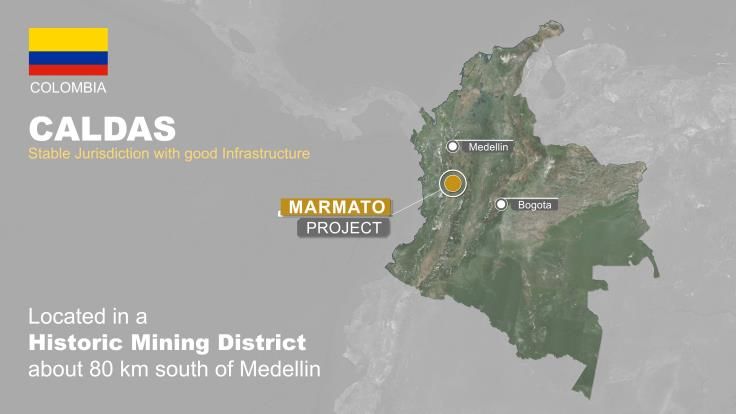
WHEATON’S STREAMING ADVANTAGE
A SUSTAINABLE OPTION FOR PRECIOUS METAL INVESTING

HIGH QUALITY ASSETS                                                                                  COMMODITY PRICE LEVERAGE
Ninety percent of Wheaton’s current                                                                          Investors get leverage to the underlying
production comes from mines operating in                                                                commodities as delivery payments per ounce
the lowest half of their cost curve                                                                      are pre-determined and made upon delivery

PREDICTABLE COSTS                                                                                            EXPLORATION UPSIDE
                                                        LOW            WITH      HIGH
Contractually defined cost per ounce                                                                                 Receives the benefit from mine
typically protects streamers from                       RISKS                   UPSIDE                           exploration and expansion activities
inflationary cost pressures                                                                                             typically at no additional cost

INNOVATIVE DIVIDEND                                                                                                          OPTIONALITY
Dividend policy provides shareholders a minimum                                                                Development projects not included in
floor payment while giving direct exposure to                                                                  guidance have the potential of adding
Wheaton’s growth and commodity prices11                                                                                  >200,000 GEOs per year30

                                                  SUSTAINABLE FOUNDATION
                                                  Wheaton is committed to long-term sustainability

                                                                                                           Wheaton Precious Metals                   5
THE HIGH MARGIN PRECIOUS METALS COMPANY - March 2021 Corporate Presentation
WHEATON PRECIOUS METALS
                    CONTINUING TO EXECUTE IN A VIRTUAL WORLD
                                                                        Wheaton lists on London Stock
                               Corporate Development:
                                                                        Exchange
                               Cozamin (Capstone) – 50% of Ag for
RECENT HIGHLIGHTS

                                                                        Trading of shares commenced October 28,
                               upfront payment of $150M
                                                                        2020 under the ticker LSE:WPM
                               Marmato (Aris) – 6.5% of Au and 100%
                               of Ag for upfront payment of $110M       New index inclusions support
                                                                        Wheaton’s strategic vision:

                                                                        S&P/TSX Canadian Dividend Aristocrats
                                                                        Index
                               Recognition for Sustainability:
                                                                        Euronext Vigeo World 120 Index
                               MSCI: “AA” (Upgrade from “A”)27

                               Sustainalytics: #1 for Precious Metals   Leadership in precious metals
                               and ESG Global 50 Top Rated
                               Company28                                Randy Smallwood announced as new
                                                                        Chair of World Gold Council

                                                                              Wheaton Precious Metals     6
THE HIGH MARGIN PRECIOUS METALS COMPANY - March 2021 Corporate Presentation
HIGH QUALITY ASSET BASE
DIVERSIFIED PORTFOLIO OF HIGH-QUALITY ASSETS
                         Operating Mines (24)                                 Development Projects (7)             Partners:
                                                                                                                        Vale
                 Keno Hill
        Minto                                                                                                         Barrick
                                                                                     Zinkgruvan
                     Kutcho
                                                        Voisey’s Bay                                                 Newmont
                                 777
                                              Sudbury
                                                                                                                     Glencore
                                            Coleman                    Aljustrel                                 Sibanye-Stillwater
                  Stillwater                Copper Cliff                                 Stratoni
                  East Boulder              Creighton                                                              Pan American
                                            Garson                         Neves-Corvo
                Rosemont                                                                                               Lundin
                                 Peñasquito Totten
                San Dimas        Cozamin    Victor (Dev. project)                                                  First Majestic
                                  Los Filos                                                                           Equinox
                                                                                                                     Eldorado
                                   Marmato               Toroparu
                                                                                                                      Hudbay
                                      Antamina
                                                              Salobo                                                 Capstone
                                 Yauliyacu
                                                  Constancia                                                           Alexco
                                 Cotabambas
                                                                                                                    Pembridge
                                                                                                                       Almina
                                                  Pascua-Lama
 Corporate Offices (2)                                                                                               Aris Gold
                                                   Navidad                                                         Gold X Mining
                                                                                                                      Panoro
                                                   Well-diversified with low political risk                       Kutcho Copper

                                                                                                    Wheaton Precious Metals     7
THE HIGH MARGIN PRECIOUS METALS COMPANY - March 2021 Corporate Presentation
HIGH QUALITY ASSET BASE
 LOW COST, LONG LIFE PRODUCTION
          2021 Forecast Production                                                Mine Life of Operating Portfolio1,2,3
             by Cost Quartile1,3                                         70

                       2%                                                60

                  8%                                                                                                    18
                                                                         50

                                                     Mine Life (years)
                                                                         40                           10
           16%
                                                                         30

                                                                         20
                              74%                                                    33
                                                                         10
                                            First
                                            Second                        0
                                            Third                             Proven & Probable  Measured &           Inferred
                                            Fourth                            Mineral Reserves Indicated Mineral Mineral Resources
                                                                                                  Resources
Ninety percent of Wheaton’s production comes from assets that fall in the lowest half of the cost curve,
                   and the portfolio has over 30 years of mine life based on reserves

                                                                                                   Wheaton Precious Metals       8
THE HIGH MARGIN PRECIOUS METALS COMPANY - March 2021 Corporate Presentation
HIGH QUALITY ASSET BASE
                                           LONG TERM PRODUCTION OUTLOOK
                                           1,200   2019 Actuals   2020 Actuals   2021 Guidance   Average Annual Production Guidance29:
1,4

                                                      GEOs:          GEOs:          GEOs:
                                                                                                     5-year Average: 810,000 GEOs                         Optionality
                                                                                  720 - 780Koz
  Gold Equivalent Production (GEO) (Koz)

                                                      745Koz         714Koz
                                                                                                     10-year Average: 830,000 GEOs
                                           1,000

                                                     28.1Koz
                                                                   28.4 Koz      40 – 45Koz                             Stillwater
                                            800    Other Metals                                        Other Metals
                                                                  Other Metals   Other Metals                         Voisey’s Bay
                                                                                                                         Salobo
                                            600                                                                        Constancia
                                                      406.5          367.4        370 – 400                Gold        San Dimas
                                                     Koz Au         Koz Au         Koz Au                               Sudbury
                                            400                                                                         Stillwater

                                                                                                                      Peñasquito
                                            200       22.4           22.9         22.5 – 24.0              Silver     Constancia
                                                     Moz Ag         Moz Ag         Moz Ag                              Antamina
                                                                                                                        Other
                                              0
                                                     2019A           2020A         2021E                          2025E                          2030E   Optionality 30
                                                                                   Silver                 Gold                     Other Metal
                                            Wheaton’s commitment to sustainable growth is reinforced by the introduction of 10-year guidance
                                                                                                                                          Wheaton Precious Metals         9
THE HIGH MARGIN PRECIOUS METALS COMPANY - March 2021 Corporate Presentation
CASH OPERATING COSTS
                        PREDICTABLE COSTS AND HIGH MARGINS
                                         Total Cash Cost and Cash Operating Margins per Ounce1,5,6,7
Gold Price (US$/0z)

                        $2,500
                        $2,000
                        $1,500
                                                         79%                                                               76%
                        $1,000                   81%             72%     69%     66%     69%     69%     68%        70%
                                 71%     75%
                         $500
                                 $300    $300    $300    $362    $386    $386    $393    $391    $395    $409      $421    $426            $451
                           $0
                                 2009    2010    2011    2012    2013    2014    2015    2016    2017    2018      2019    2020            2021-
                                                                                                                                           2025E
Silver Price (US$/0z)

                          $30

                          $20                    88%     87%
                                         81%                     83%
                          $10    74%                                     78%     73%     74%     74%     70%       70%     75%
                                 $3.97   $3.97   $3.99   $4.06   $4.12   $4.14   $4.17   $4.42   $4.49   $4.67     $5.02   $5.28           $5.81
                           $0
                                 2009    2010    2011    2012    2013    2014    2015    2016    2017    2018      2019    2020            2021-
                                                                                                                                           2025E
                                                           Total Cash Cost/oz                     Cash Operating Margins

                                                                                                                 Wheaton Precious Metals    10
STRONG BALANCE SHEET
                 AMPLE CAPACITY TO CONTINUE GROWING
                                                                                               Cash Flow             % Increase
                                                                                                                                     Au Price   Ag Price
                                      Balance Sheet as of December 31, 20201                  Sensitivity to         from Base
                                                                                                                                      $US/oz     $US/oz
                                                                                             Commodity Price            Case
                 $8,000
                                                                                                   72%
                                                                                                    67%                 50%            $2,550     $39.88
                 $7,000                                                                             79%
                                                                                                   62%
                                                                                                   65%
                                                                                                    65%
                                                                                                    47%                 35%            $2,295     $35.10
                                                                                                   44%
                 $6,000                                                                            45%
                                                                                                    46%
                                                                                                    27%
Millions ($US)

                                                                                                   25%                  20%            $2,040     $31.20
                 $5,000                                                                            26%
                                                                                                     27%
                                                                                                    26%
                                                                                                    13%
                                                                                                   12%                  10%
                                                                                                                        10%            $1,870
                                                                                                                                       $1,980     $28.60
                                                                                                                                                  $29.70
                                                                                                    28%
                                                                                                     29%
                                                                                                   13%
                                                                                                   13%
                                                                                                     13%
                                                                                                    13%
                 $4,000
                                                                                                 Base Case
                                                                                              Base Case
                 $3,000                                                                         Base
                                                                                              Base    Case
                                                                                                     Case
                                                                                              Gold
                                                                                              Base
                                                                                                Base @Case
                                                                                                        $1,700
                                                                                                     Case                            ~$950M in average
                                                                                             Gold
                                                                                           Gold
                                                                                           Gold   @
                                                                                                  @ @  $1,800
                                                                                                     $1,800
                                                                                                     $1,900
                                                                                              Silver
                                                                                           Gold
                                                                                             Gold @ @@$1,800
                                                                                                         $26.00
                                                                                                     $1,900                        annual operating cash
                                                                                             Silver@
                                                                                           Silver
                                                                                           Silver  @@$27.00
                                                                                                       $18.50
                                                                                                      $27.00
                                                                                                      $25.00
                 $2,000                                                                    Palladium
                                                                                           Silver
                                                                                             Silver
                                                                                          Palladium
                                                                                         Palladium @@  @
                                                                                                        @ $2,300
                                                                                                      $25.00
                                                                                                        $23.00
                                                                                                          $1,900
                                                                                                     @ $2,300                     flows generated at spot
                                                                                         Palladium
                                                                                              Cobalt@@
                                                                                         Palladium       $2,400
                                                                                                        $2,100
                                                                                                          $22/lb
                                                                                          Cobalt @@$22/lb
                                                                                          Palladium    @$2,500
                                                                                                          $2,400                     commodity prices
                 $1,000

                    $0
                                                                                                                    9
                          Revolving Credit           Cash           Remaining Capacity    Est. Op. Cash Flow
                              Facility                                                   (Rolling 5-yr forecast)
                                     Cash flow sensitivities indicate a 50% increase in commodity prices
                                                will result in an >65% increase to cash flows
                                                                                                                   Wheaton Precious Metals                 11
MARGINS AND CASH FLOW
                                     OPTIONALITY TO HIGHER COMMODITY PRICES
19,21

                                     $900                                                                                                           1,000
                                                 Over $2 billion of operating cash
 Operating Cash Flow (Million US$)

                                     $800     flow in excess of Wheaton’s original                                                                  900

                                                                                                                                                            Gold Equivalent Sales (koz)
                                     $700      expectation during the last upswing                                                                  800
                                                     in the commodity prices cycle                                                                  700
                                     $600
                                                                                                                                                    600
                                     $500
                                                                                        Excess Cash Flow                                            500
                                     $400
                                                                                                                                                    400
                                     $300
                                                                                                                Initial Cash Flow Estimate          300
                                     $200                                                                                                           200
                                     $100                                                                                                           100
                                       $0                                                                                                           0
                                            2004 2005 2006 2007 2008 2009 2010 2011 2012 2013 2014 2015 2016 2017 2018 2019 2020
                                                              GEO Sales          ActualCash
                                                                                Excess  Stream
                                                                                            Flow             Initial
                                                                                                           Initial   Stream
                                                                                                                   Cash Flow Estimate          Gold Price
                                                                                     Cash Flow              Cash Flow Estimate
                                                          Wheaton’s 2020 sales volumes are 75 percent higher than in 2012
                                                                   during the prior high commodity price cycle
                                                                                                                                         Wheaton Precious Metals                          12
INNOVATIVE AND SUSTAINABLE DIVIDEND
LEADING DIVIDEND YIELD AMONGST STREAMERS
▪     Innovative Quarterly Dividend Policy
           •   Dividends linked to operating cash flows whereby 30% of the average of the previous four quarters’ operating cash
               flows are distributed to shareholders.
           •   Floor of $0.13/share per quarter set for 2021, representing a 30% increase relative to 2020.11
▪     Benefits
           •   Direct precious metals price exposure
           •   Participation in robust organic production growth
           •   Sustainable and flexible
           •   ~$1.2billion declared in dividends as of December 31, 2020 equivalent to ~40% of cumulative net earnings

    3.0%

    2.0%

    1.0%
                                  Wheaton Yield                Franco Nevada Yield                Royal Gold Yield
    0.0%
        2011        2012        2013        2014       2015        2016        2017        2018        2019          2020
                                                                                               Wheaton Precious Metals      13
BENEFITS TO PARTNER MINING COMPANIES
PRECIOUS METALS STREAMING
THE BENEFITS TO THE PARTNER MINING COMPANY
                                                       Stream         Debt            Equity
Non-dilutive form of funding                            ✓               ✓
Initial value creation for both parties                 ✓
Improves project IRR                                    ✓
Crystalize future production of mining partner          ✓
Contractual relationship means support & flexibility    ✓
Endorses technical merits of mine / project             ✓
Share production and operating risk                     ✓                                ✓
Expedited due diligence & closing process               ✓                                ✓
No fixed payments                                       ✓                                ✓
                                                                Benefits to Mining Companies   15
PRECIOUS METALS STREAMING
THE BENEFITS TO THE PARTNER MINING COMPANY
                                                                                      Initial Value Creation
                       Opportunity exists to                                          The market values
                       create value for both                                          precious metal in a
                              parties            Value of Future                      streaming company’s
                                                 Precious Metal                       portfolio greater than
   Value of Future                                   Stream                           precious metal produced
   Precious Metal                                                                     by a traditional miner
     Production
   Traditional Miner                           Streaming Company

                           Salobo Example22
                                                                                       Improves IRRs
                                                                                       The upfront payment
                                                                                       contributes a larger
                                                                      $1,030           portion of capex than the
          78%                                  $863M
                                                                                       stream represents as a
                                                                                       percentage of revenue
                            20%
    Upfront payment     Stream as a %     Vale's capex net of   Vale's 2020 EBITDA
    as a % of capex    of mine revenue      WPM's upfront           from Salobo
                                              payments
                                                                                 Benefits to Mining Companies   16
BENEFITS TO THE COMMUNITY
SUSTAINABILITY
A CORE VALUE

           Wheaton delivers sustainable, long-term value from
                 both a business and social perspective

                          Community                                  External &
       ESG Due                               Strong Policies
                          Investment                                  Voluntary
       Diligence                               & Practices
                           Programs                                 Commitments

          Wheaton has undertaken a broad range of sustainability initiatives and
            significantly increased disclosure around ESG risk management
                                                                   Benefits to the Community   18
COMMUNITY INVESTMENT PROGRAM
MAKING AN IMPACT

▪   Only streaming company with
    formal programs that benefit
    communities                               HEALTH          EDUCATION           ENVIRONMENT                 COMMUNITY

▪   To help combat COVID-19,                             Community Investment Budget
    Wheaton established an additional                   (1.5% of average net income of previous four years)
    $5M Community Support & Relief
                                                           (0.5%)                                        (1%)
    Fund to be used primarily to
    support communities around the
    mines from which we get precious               Local CSR                                  Partner CSR
    metals                                       (Vancouver & Cayman)                        (Mining Communities)

     •   At December 31 2021, Wheaton
         has made donations totaling $3
         million under this program in
         support of frontline organizations
         including food banks, shelters and
         hospitals among others.

                                                                                       Benefits to the Community      19
RECOGNITION FOR SUSTAINABILITY PERFORMANCE
▪   Top-rated among ESG analysts
     •   Rated an “AA” by MSCI ESG Research (upgraded from “A” in September 2020)27
     •   Ranked #1 for Precious Metals by Sustainalytics ESG Risk Ratings28
     •   Ranked in the Global Top 50 out of over 12,000 companies across sectors by Sustainalytics
     •   Classified as “Prime” by ISS ESG Corporate Rating
     •   Included within the Euronext Vigeo World 120 Indice powered by Vigeo Eiris
▪   Carbon Neutral designation since 2015
▪   Signatory to the World Gold Council’s Responsible Gold Mining Principles
▪   First streaming company to join UN Global Compact
     •   Largest sustainability initiative in the world
     •   Demonstrates commitment to corporate sustainability through a principles-based approach
     •   Incorporates ten universally accepted principles in the areas of human rights, labour, environment and anti-corruption
         into strategies, policies and procedures
     •   Take strategic actions to advance broader societal goals including the UN Sustainable Development Goals

                                                                                               Benefits to the Community          20
WHY INVEST IN WHEATON PRECIOUS METALS?
THE WORLD’S PREMIER PRECIOUS METALS INVESTMENT
                                                           Other                         Precious Metal
                                           Wheaton       Streamers      Bullion / ETFs       Miners

>95% of revenue from precious metals17      ✓                                 ✓                 ?

No capital cost exposure                    ✓                ✓

No operating cost exposure12                ✓                ✓

Exploration upside
                                            ✓                ✓                                 ✓

Highly diverse asset base
                                            ✓                ✓

Sustainable dividend
                                            ✓                ?

Leverage to commodity prices
                                            ✓                ✓                                 ✓

                 Wheaton has a high quality stream portfolio and is the only streamer with
                        >95% of revenue exposed to precious metals production
                                                              Why Invest in Wheaton Precious Metals?   22
WHEATON VERSUS OTHER STREAMERS
SECTOR LEADING REVENUE GENERATION
$1,200                         2020 Revenue Mix by Streamer13,17
                                                                                        $1,096M
                                                   $1,020M                                 $44
$1,000
                                                       $92
                                                       $18
                                                       $86                                 $400
 $800
                                                     $106

 $600
                    $499M
                                                                                                          100%
                     $60                                               89%
 $400                $45
                                                     $718
                                                                                           $653

 $200               $394        88%

   $0
                  Royal Gold                     Franco Nevada                           Wheaton
                                 Gold   Silver   PGM         Other   Oil & Gas
         Wheaton’s 2020 revenue is 100% precious metals, with higher total revenue than peers
                                                                      Why Invest in Wheaton Precious Metals?   23
WHEATON’S TRACK RECORD
AS OF DECEMBER 31, 2020
                            $9 Billion invested in streams23

                      >$7.4 Billion of cash flow generated to date24

                       >$1.2 billion declared in dividends to date11

            Strong annual cash flows expected at current commodity prices25

                >40 years of reserve and resource mine life remaining1,2,3

            High ratings recognizing Wheaton’s dedication to sustainability27,28

              ~20% average annualized after-tax return from the portfolio26

                                                          Why Invest in Wheaton Precious Metals?   24
CONSISTENTLY OUTPERFORMED GOLD AND SILVER
                              Total Average Rolling Multi-Year Return Comparison as of March 8, 202114

                       200%
Average Total Return

                       150%

                       100%

                       50%

                        0%

                       -50%             1-Year                     3-Year                  5-Year                    10-Year

                       Gold    Silver     Philadelphia Gold & Silver Index (XAU)   VanEck Vectors Gold Miners ETF (GDX)        Wheaton

                         Wheaton’s strong track record has resulted in consistently returning value to shareholders

                                                                                          Why Invest in Wheaton Precious Metals?    25
WHEATON PRECIOUS METALS
IF YOU LIKE PRECIOUS METALS, WHEATON CHECKS ALL THE BOXES

        Cost predictability

        High quality asset base

        Long-life operations

        Leverage to increasing precious metals prices

        Dedication to sustainability

        Innovative dividend

 For more information on Wheaton’s sustainability programs, please visit: www.wheatonpm.com

                                                                    Wheaton Precious Metals   26
CONTACT

INVESTOR RELATIONS                              CONNECT WITH US
Tel: 604-684-9648                                     @Wheaton_PM
Toll Free: 1-844-288-9878
Email: info@wheatonpm.com                             @WheatonPM

TRANSFER AGENT                                        @Wheaton Precious Metals Corp.
AST Trust Company (Canada)
Toll Free: 1-800-387-0825
International: 1-416-682-3860
Email: inquiries@canstockta.com

                                  www.wheatonpm.com

                                                       TSX: WPM   NYSE: WPM   LSE: WPM   27
APPENDIX AND ENDNOTES
SHARES
CAPITAL STRUCTURE AS OF DECEMBER 31, 2020

 Weighted average number of shares outstanding:
      Basic:         449.3 million
      Diluted15:     450.9 million

 3 Month Average Daily Trading Volume:
      TSX:           1.1 million shares
      NYSE:          2.5 million shares

                                                  Appendix   29
COMPANY ACQUISITION HISTORY
                    Silver Wheaton (SLW)                            Timeline Since Inception16
                        Begins Trading

                        2004               2005             2006                    2007              2008                  2009               2010                  2011

                     1) San Dimas                        4) Yauliyacu          5) Stratoni          7) Keno Hill      8-11) Silverstone    13) Rosemont
                     2) Los Filos                                              6) Peñasquito                          12) Barrick
                     3) Zinkgruvan
                                                                    Silver Stream      Gold & Silver Stream        Gold Stream
                                                                                                                                          Production Payment                            Date of
                                                          Location             Upfront               Attributable Production                                             Term of
        Precious Metal Interest         Mine Owner                                                                                         as of Dec 31, 20201                          Original
                                                           of Mine           Consideration              Silver       Gold                                               Agreement
                                                                                                                                            Silver       Gold                          Contract
 1     San Dimas                        First Majestic     Mexico        $                      25% paid in gold             25%                         $612           Life of Mine   15-Oct-04
 2     Los Filos                           Equinox         Mexico        $        4,463             100%                      0%           $4.46                          25 years     15-Oct-04
 3     Zinkgruvan                           Lundin         Sweden        $       77,866             100%                      0%           $4.46                        Life of Mine   8-Dec-04
                                                                                                100% up to 1.5Moz,
 4     Yauliyacu                           Glencore          Peru        $     285,000                                           0%       variable2                     Life of Mine   23-Mar-06
                                                                                                    then 50%
                                                                                                                                                    3
 5     Stratoni                        Eldorado Gold       Greece        $      57,500                 100%                      0%       variable                      Life of Mine    23-Apr-07
 6     Peñasquito                        Newmont           Mexico        $     485,000                  25%                      0%        $4.26                        Life of Mine    24-Jul-07
 7     Keno Hill                          Alexco           Canada        $      50,000                  25%                      0%       Variable4                     Life of Mine     2-Oct-08
8-11   Silverstone Resources                                                                                                                                                           21-May-09
                                                                                                                      100% up to 30Koz,
 8       Minto                             Pembridge       Canada        $       54,805                100%               then 50%
                                                                                                                                            $4.31       variable25      Life of Mine   20-Nov-08
 9       Neves-Corvo                      Lundin          Portugal       $      35,350                100%                       0%         $4.34                         50 years      5-Jun-07
10       Aljustrel                        Almina          Portugal       $       2,451                100%5                      0%       variable26                      50 years      5-Jun-07
11       Navidad (Loma de La Plata)    Pan American       Argentina      $      43,2896               12.5%                      0%         $4.00                       Life of Mine      n/a7
       Barrick                                                           $     252,2618
                                                          Chile/Argenti
12       Pascua-Lama                        Barrick                                              25%               0%                       $3.90                       Life of Mine    8-Sep-09
                                                               na
         The Barrick transaction also included streams on Lagunas Norte, Pierina, Veladero which expired on March 31, 2018
13     Rosemont                          Hudbay        United States    $   230,0009            100%              100%                      $3.90         $450          Life of Mine   10-Feb-10

                                                                                                                                                                             Appendix         30
COMPANY ACQUISITION HISTORY
                                                                       Timeline Since Inception16
                                                                                                           Silver Wheaton Becomes
                                                                                                        Wheaton Precious Metals™ (WPM)

                          2012               2013               2014               2015                2016             2017                   2018             2019                2020

                      14) Constancia    16) Salobo I                           16) Salobo II     20) Cotabambas         21) Kutcho       22) Voisey’s Bay                     24) Marmato
                          Silver        17) Sudbury                            19) Antamina      16) Salobo III                          23) Stillwater                       25) Cozamin
                      15) 777           14) Constancia
                                            Gold
                                        18) Toroparu           Silver Stream    Gold & Silver Stream     Gold Stream      Other Stream          Gold & PGM Stream
                                                                                                                                       Production Payment                                   Date of
         Precious Metal                           Location of        Upfront                 Attributable Production                    As of Dec 30, 20201              Term of            Original
            Interest            Mine Owner           Mine         Consideration           Silver       Gold       Other            Silver       Gold      Other        Agreement           Contract
14   Constancia10,11              Hudbay              Peru          $ 429,900          100%          50%                                                               Life of Mine        8-Aug-12
        Constancia Silver                                           $ 294,900          100%                                        $6.02                                                   8-Aug-12
        Constancia Gold                                             $ 135,000                        50%                                         $408                                      4-Nov-13
15   77711                        Hudbay            Canada          $ 455,100          100%          50%                           $6.26         $425                  Life of Mine        8-Aug-12
16   Salobo12                       Vale             Brazil         $ 3,059,360           0%         75%                                         $408                  Life of Mine        28-Feb-13
        Salobo I                                                    $ 1,330,000          0%          25%                                                                                   28-Feb-13
        Salobo III                                                  $ 900,000            0%          25%                                                                                    2-Mar-15
        Salobo III13                                                $ 829,360            0%          25%                                                                                   2-Aug-16
17   Sudbury14                      Vale            Canada          $ 623,572            0%          70%                                         $400                    20 years          28-Feb-13
        Coleman, Copper Cliff, Garson, Stobie, Creighton, Totten and Victor gold interests
18   Toroparu15                Gold X Mining        Guyana          $ 153,500           50%          10%                           $3.90         $400                  Life of Mine        11-Nov-13
19   Antamina16,17               Glencore             Peru          $ 900,000         33.75%          0%                         20% of Spot                           Life of Mine         3-Nov-15
20   Cotabambas18,19              Panoro              Peru          $ 140,000          100%          25%                           $5.90         $450                  Life of Mine        21-Mar-16
21   Kutcho20,21               Kutcho Copper        Canada          $     65,000       100%         100%                         20% of Spot   20% of Spot             Life of Mine        15-Dec-17
22   Voisey’s Bay Cobalt22          Vale            Canada          $ 390,000                                 42.4% / 21.2%                                18% of Spot Life of Mine        11-Jun-18
23   Stillwater23            Sibanye-Stillwater       USA           $ 500,000                       100%     4.5% / 2.25% / 1%   18% of Spot               18% of Spot Life of Mine        16-July-18
24   Marmato24                   Aris Gold         Colombia         $ 110,000          6.5%         100%                         18% of Spot   18% of Spot             Life of Mine        05-Nov-20
25   Cozamin27                   Capstone           Mexico          $ 150,000           50%                                      10% of Spot                           Life of Mine        19-Feb-21

                                                                                                                                                                          Appendix             31
COMPANY ACQUISITION HISTORY
     NOTES TO TIMELINE
1. Subject to an annual inflationary adjustment with the exception of Loma de La Plata and Sudbury.
2. Should the prevailing market price for silver or gold be lower than this amount, the per ounce cash payment will be reduced to the prevailing market price, with the exception of Yauliyacu where
    the per ounce cash payment will not be reduced below $4.24 per ounce, subject to an annual inflationary factor.
3. In October 2015, in order to incentivize additional exploration and potentially extend the limited remaining mine life of Stratoni, Wheaton Precious Metals and Eldorado Gold agreed to modify the
    Stratoni silver purchase agreement. The primary modification is to increase the production price per ounce of silver delivered to Wheaton Precious Metals over the current fixed price by one of
    the following amounts: (i) $2.50 per ounce of silver delivered if 10,000 meters of drilling is completed outside of the existing ore body and within Wheaton Precious Metals' defined area of interest
    (“Expansion Drilling”); (ii) $5.00 per ounce of silver delivered if 20,000 meters of Expansion Drilling is completed; and (iii) $7.00 per ounce of silver delivered if 30,000 meters of Expansion Drilling
    is completed. Drilling in all three cases must be completed by December 31, 2020, in order for the agreed upon increase in production price to be initiated.
4. In March 2017, the Company amended its silver purchase agreement with Alexco Resource Corp. (“Alexco”) to make the production payment a function of the silver head grade and silver spot
    price in the month in which the silver is produced. In addition, the area of interest was expanded to include properties currently owned by Alexco and properties acquired by Alexco in the future
    which fall within a one kilometer radius of existing Alexco holdings in the Keno Hill Silver District. As consideration of the amendments, Alexco issued 3,000,000 shares to Wheaton Precious
    Metals.
5. Wheaton Precious Metals only has the rights to silver contained in concentrate containing less than 15% copper at the Aljustrel mine.
6. Comprised of $11 million allocated to the silver interest upon the Company’s acquisition of Silverstone Resources Corp. in addition to a contingent liability of $32 million, payable upon the
    satisfaction of certain conditions, including Pan American receiving all necessary permits to proceed with the mine construction.
7. Definitive terms of the agreement to be finalized.
8. The upfront consideration is net of the $373 million cash flows received relative to silver deliveries from the Lagunas Norte, Veladero, and Pierina mines.
9. The upfront consideration is currently reflected as a contingent obligation, payable on an installment basis to partially fund construction of the Rosemont mine once certain milestones are
    achieved, including the receipt of key permits and securing the necessary financing to complete construction of the mine.
10. Gold recoveries will be set at 55% for the Constancia deposit and 70% for the Pampacancha deposit until 265,000 ounces of gold have been delivered to the Company. Should there be a delay
    in achieving completion or mining the Pampacancha deposit beyond the end of 2018, Wheaton Precious Metals would be entitled to additional compensation in respect of the gold stream.
11. Subject to an increase to $9.90 per ounce of silver and $550 per ounce of gold after the initial 40 year term.
12. Vale has completed the expansion of the mill throughput capacity at the Salobo mine to 24 million tonnes per annum (“Mtpa”) from its previous 12 Mtpa. If actual throughput is expanded above
    28 Mtpa within a predetermined period, and depending on the grade of material processed, Wheaton Precious Metals will be required to make an additional payment to Vale based on a set fee
    schedule ranging from $113 million if throughput is expanded beyond 28 Mtpa by January 1, 2036, up to $953 million if throughput is expanded beyond 40 Mtpa by January 1, 2021.
13. Upfront payment consisted of $800 million cash & the amendment of the 10mil Wheaton Precious Metals common share purchase warrants previously issued to Vale in connection with the
    Sudbury precious metal purchase agreement which expire on Feb. 28, 2023 to reduce the strike price from $65 to $43.75 per common share. The amendment to these warrants was valued at
    $29 million using a Black-Scholes option pricing model.
14. Includes Coleman, Copper Cliff, Garson, Stobie, Creighton, Totten & Victor gold interests. Upfront payment consisted of $570 million cash plus 10 million Wheaton Precious Metals common
    share purchase warrants with a $65 strike and 10 year term.

                                                                                                                                                                               Appendix            32
COMPANY ACQUISITION HISTORY
     NOTES TO TIMELINE
15. Comprised of $16 million paid to date and $138 million to be payable on an installment basis to partially fund construction of the mine. Following the delivery of certain feasibility documentation
    or after December 31, 2017 if the feasibility documentation has not been delivered to Wheaton Precious Metals by such date, Wheaton Precious Metals may elect not to proceed with the
    agreement or not pay the balance of the upfront consideration and reduce the gold stream percentage from 10% to 0.909% and the silver stream percentage from 50% to nil. If Wheaton
    Precious Metals elects to terminate, Wheaton Precious Metals will be entitled to a return of the amounts advanced less $2 million which is non-refundable on the occurrence of certain events. If
    Wheaton Precious Metals elects to reduce the streams, Gold X Mining Corp. may return the amount of the deposit already advanced less $2 million to Wheaton Precious Metals and terminate
    the agreement.
16. Glencore owns 33.75% of the Antamina mine through a joint venture. Wheaton Precious Metals is entitled to Glencore’s portion of the silver production.
17. Once the Company has received 140 million ounces of silver under the Antamina agreement, the Company’s attributable silver production to be purchased will be reduced to 22.5%.
18. Comprised of $4.75 million paid to date, $9.25 million which is payable on an installment basis spread out over a period of up to eight years and $126 million payable on an installment basis to
    partially fund construction of the mine once certain conditions have been satisfied.
19. Once 90 million silver equivalent ounces attributable to Wheaton Precious Metals have been produced, the attributable production to be purchased will decrease to 66.67% of silver & 16.67% of
    gold production for the life of mine.
20. Comprised of $7 million as an early deposit, payable in 2018. The balance of the $65 million would be payable in instalments during construction of the Kutcho Project.
21. Once 5.6 million ounces of silver and 51,000 ounces of gold have been delivered, the stream will decrease to 66.67% of the silver and gold production for the life of the mine.
22. Stream is effective January 1, 2021. Once 31 million pounds of cobalt are delivered, the stream drops to 21.2% of cobalt for the life of mine. Production payment is set at 18% of the cobalt spot
    price until the value of the upfront cash consideration is reduced to zero, then the production payment is 22% of the cobalt spot price.
23. Stream is effective July 1, 2018. Wheaton will be entitled to an amount of palladium equal to: 4.5% of Stillwater palladium production up to 375 Koz: 2.25% of Stillwater palladium production
    between 375 Koz to 550 Koz delivered: and 1% of Stillwater palladium production thereafter for the life of mine. Production payment is set at 18% of the gold and palladium spot price until the
    value of the upfront cash consideration is reduced to zero, then the production payment is 22% of the gold and palladium spot price
24. Wheaton International will pay a total cash consideration of US$110M, US$38M of which is payable within six months subject to customary conditions, and the remaining portion of which is
    payable during the construction of the MDZ project subject to receipt of required permits and licenses, sufficient financing having been obtained to cover total expected capital expenditures, and
    other customary conditions. The stream is effective July 1, 2020. Production payment is set at 18% of the gold and silver spot price until the value of the upfront cash consideration is reduced to
    zero, then the production payment is 22% of the gold and silver spot price.
25. The Company has amended the Minto PMPA such that the per ounce cash payment per ounce of gold delivered will be 75% of the spot price of gold for each ounce of gold delivered under the
    Minto PMPA. This amended pricing will end on the earlier of (i) 14 months after the first delivery is due; or (ii) once 11,000 ounces of gold have been delivered to the Company. Once this
    amended pricing ends, the per ounce cash payment per ounce of gold delivered will be $325, subject to an increase in periods where the market price of copper is lower than $2.50 per pound.
26. 50% of amounts received under concentrate sales agreements.
27. Wheaton is entitled to 50% of silver production until 10 Moz have been delivered, thereafter dropping to 33% of silver production for the life of the mine.

                                                                                                                                                                          Appendix           33
STREAMING THROUGHOUT THE CYCLE
           SOME DAYS YOU REAP, SOME DAYS YOU SOW…
                                                             Spot Gold Prices vs. Long-Term Analyst Consensus18

                                                                                                                                          Constancia Ag
                                                                                                                                          777 Au & Ag

                                                                                                                                                                                            Voisey's Bay Cobalt

                                                                                                                                                                                                                       Cozamin
                                                                                                                                                                                                                       Marmato
                   $2,500                                                                                                                                                                                                        $60

                                                                                                                                   Salobo 1/Sudbury
                                                                                              Barrick / Pascua Lama

                                                                                                                                                                                          Stillwater Gold &
                                                                                                                                Constancia Gold

                                                                                                                                                                             Cotabambas
                                                                                                                                                                                                                                 $50

                                                                                                                                   Toroparu
                   $2,000

                                                                                                                                                                                          Palladium
                                                                                                                                                                                             Kutcho
                                                                                                                                                                           Salobo 3
                                                                                              Rosemont
                                                                                             Silverstone

                                                                                                                                                                         Antamina
                                                                                                                                                              Salobo 2

                                                                                                                                                                                                                                       Silver Price (US$)
                                                                                                                                                                                                                                 $40
Gold Price (US$)

                                San Dimas & Los Filos

                                                                                 Keno Hill
                   $1,500                                           Peñasquito
                                                                    Stratoni
                                                        Yauliyacu

                                                                                                                                                                                                                                 $30
                                 Zinkgruvan

                   $1,000
                                                                                                                                                                                                                                 $20

                    $500
                                                                                                                                                Gold / Silver Price                                                              $10
                                                                                                                                                LT Consensus Gold / Silver Price

                      $0                                    Growth                                                    Harvest                             Recapitalize                                 Growth? 1                 $0
                            2004 2005 2006 2007 2008 2009 2010 2011 2012 2013 2014 2015 2016 2017 2018 2019 2020 2021
                                                                     Streaming Cycle looks to be re-entering growth phase
                                                                                                                                                                                                                  Appendix       34
GROWTH
COZAMIN – ASSET OVERVIEW1
 Operator                 Capstone Mining Corp.
 Location                 Zacatecas, Mexico
 Stream                   Silver

 Date of Contract         February 19, 2021 (Effective December 1, 2020)

 Term of Stream1          Life of Mine

                          50% of silver production until 10 Moz have been
 Stream    Parameters1    delivered, thereafter dropping to 33% of silver
                          production for the life of the mine.

 Upfront Consideration1   $150 Million

 Delivery Payment / oz1   10% of spot silver

 Deposit                  Epithermal and mesothermal vein deposit
 Mine Type                Underground

Exploration success has led to significant resource increases and excellent potential exists to continue this expansion

                                                                                                       Appendix    35
GROWTH
MARMATO – ASSET OVERVIEW1
Operator             Aris Gold
Location             Colombia (80km south of Medellin)
Stream               Gold and silver
Date of Contract     November 5, 2020 (Effective July 1, 2020)
Term of Stream1      Life of Mine
                     6.5% of gold production (until 190,000 ounces of gold
                     have been delivered, 3.25% of gold produced
Stream
                     thereafter) 100% of silver production (until 2.15
Parameters1
                     million ounces of silver have been delivered, 50% of
                     silver produced thereafter)
Upfront
                     $110 Million
Consideration1

                     18% of spot gold and silver until the uncredited
Delivery Payment /
                     portion of the upfront payment is reduced to zero,
oz1
                     22% of spot gold and silver price thereafter

Deposit              Epithermal low/intermediate sulfidation
Mine Type            Underground

                                                                             Appendix   36
REVENUE EXPOSURE
HIGHLY DIVERSIFIED PORTFOLIO

                                 2021-2025E Revenue Mix1,4
                      Cobalt                                           Colombia
          Palladium
                       3%                                                 1%
             5%
                                                                      USA
                                                                      7%
                                                             Europe
                                                              7%                   Brazil
                                                                                   32%
                                                         Canada
                               Gold                       11%
                               51%
           Silver
           41%
                                                             Peru
                                                             21%              Mexico
                                                                               21%

                                                                                       Appendix   37
STRENGTHENING PARTNERSHIPS
CSR PROGRAM FOCUSES ON COMMUNITIES NEAR PARTNER MINES
Partner CSR Program:
▪ First streaming / royalty company to focus support on mining communities
    •    Program provides long-term, sustainable benefits to the communities near our partners’ mines
▪       Current initiatives
    •    Vale: Working with the Vale Foundation to support several programs focused on health, community engagement and income
         generation opportunities near the Salobo mine in Brazil
    •    Glencore: Improving the educational system in rural communities near the Antamina mine in Ancash, Peru
    •    Hudbay: Enhancing economic opportunities through improved dairy production in four communities near the Constancia mine
         in Chumbivilcas, Peru
▪       Completed initiatives
    •    Past projects include programs with Goldcorp, Barrick and Primero Mining

           Investing in the communities around the mines from which we get our precious metals −
                                           It’s the right thing to do
                                                                                                                    Appendix       38
COMMUNITY IMPACT
SUPPORTING LOCAL AND GLOBAL INITIATIVES
Canadian initiatives support a broad range of services and causes
▪ Primary sponsor of key fundraising events for:
    •       The BC Ride to Conquer Cancer – BC Cancer Agency
    •       Daffodil Ball – Canadian Cancer Agency
    •       Sports Celebrities Festival – Special Olympics BC and Canucks for Kids Fund
    •       Courage to Come Back Awards – Coast Mental Health
    •       Nature Trust Fall Gala – Nature Trust of British Columbia
▪       Sponsor over 50 initiatives benefitting local hospitals, cancer research, youth outreach programs,
        addiction treatment, and many, many more
▪       Carbon Neutral Company
        •    Wheaton contributes to the Lara Ceramic Fuel Switching Project in Brazil to offset its climate impact

                                   Success is built on more than just financial results

                                                                                                                     Appendix   39
MARGINS AND CASH FLOW
           STRONG CASH FLOW GENERATION DRIVEN BY COST CERTAINTY

           $1,200
                               Operating Cash Flow, Production Payment, G&A and Other Costs5,6,7
                                                                                                                        $1,096

           $1,000
                                                                                       $892                      $861
                                                        $850                                   $843
                                                                                                        $794
                 $800                          $730             $706
Millions ($US)

                                                                       $620   $649
                 $600
                                        $423
                 $400
                                 $239
                        $167
                 $200

                  $0
                        2008     2009   2010   2011     2012    2013   2014   2015     2016    2017     2018     2019   2020

                  Production Payment    Interest Cost & Other   G&A     Operating Cash Flow (before working capital)    Revenue
                                                                                                                  Appendix     40 40
HIGH-QUALITY ASSET BASE
KEY ASSET UPDATES1,2
                            Salobo: 75% of gold production for life of mine (mine life currently >40 years)
                               ▪ 62.9Koz of gold produced in Q4 2020
                               ▪ Salobo III expansion 68% complete at end of Q4 2020
                               ▪ Exploration potential at depth
                            Peñasquito: 25% of silver production for life of mine
                              ▪ 2.0Moz of silver produced in Q4 2020
   Salobo Mine - Brazil
                              ▪ Steady production expected in 2023-2025 due to higher grades in the Chile Colorado pit
                            Antamina: 33.75% of silver (Glencore’s ownership percentage)
                              ▪ 1.9Moz of silver produced in Q4 2020
                              ▪ Following a temporary suspension, Antamina ramped back up to full production in June with
                                 strong production in the second half of the year primarily driven by grades
                            San Dimas: 25% of gold production and 25% of silver production - paid in gold
 Peñasquito Mine - Mexico     ▪ 11.7Koz of gold produced in Q4 2020
                              ▪ The fixed gold to silver conversion ratio reverted to 70:1 (from 90:1) in October 2020 after
                                 the average gold to silver price ratio over a six-month period fell back below 90:1
                            Constancia: 100% of silver and 50% of gold for life of mine
                              ▪ 0.5Moz of silver and 3.9Koz of gold produced in Q4 2020 (including ~2Koz Au payment in
                                 lieu of delayed Pampacancha production)
                              ▪ Hudbay has completed the Consulta Previa process for Pampacancha and expects
  Antamina Mine - Peru           production to commence later in 2021
                                                                                                               Appendix        41
STRONG TRACK RECORD OF ACCRETIVE GROWTH
          EXPANSION & GROWTH THROUGH EXPLORATION & ACQUISITIONS
                                Total attributable gold equivalent R&R per 100 shares since inception2,8
                          9.0
                                  M&I          P&P           Mined
                          8.0
                          7.0
                          6.0
Gold Eq oz / 100 share

                          5.0
                          4.0
                          3.0
                          2.0
                          1.0
                          0.0
                         -1.0
                         -2.0
                         -3.0
                         -4.0
                                2004

                                                                                                        2014
                                        2005

                                               2006

                                                      2007

                                                              2008

                                                                     2009

                                                                            2010

                                                                                   2011

                                                                                          2012

                                                                                                 2013

                                                                                                               2015

                                                                                                                      2016

                                                                                                                             2017

                                                                                                                                    2018

                                                                                                                                           2019

                                                                                                                                                  2020
                                        Significant growth in reserves and resources per share since inception
                                                                                                                                      Appendix    42
RESOLUTION OF THE CANADIAN TAX DISPUTE
 REASSESSMENT FOR 2005-2010 SETTLED ON DECEMBER 13, 2018
Background10 ▪     CRA reassessed Wheaton in September 2015 for tax years 2005-2010:
                   • CRA’s position was that income earned by Wheaton’s foreign subsidiaries (Wheaton
                     International) outside of Canada from mines located outside of Canada should be taxable in
                     Canada on the basis of transfer pricing
                   • Total potential liability for 2005 - 2017 was over US$1bn
Settlement10   ▪   Foreign income on earnings generated by Wheaton International will not be subject to
                   tax in Canada under transfer pricing rules10
               ▪   The service fee charged by Wheaton for the services provided to Wheaton International will be
                   adjusted to include capital-raising costs and the mark-up will be increased from 20% to 30%.
                   • This additional service fee will result in increased income generated by Wheaton in Canada
                      that is subject to Canadian tax.
               ▪   The transfer pricing principles reached in the settlement principles will apply to taxation years
                   after 2010 subject to there being no material change in facts or change in law or jurisprudence
               ▪   Total expenses of $29 million in respect of the 2005-2017 taxation years reflected in the Q4
                   2018 Statement of Earnings and includes a non-cash income tax expense of $16 million
                   • Net cash expense of $13 million comprised of (i) $4 million of current income taxes; (ii) $4
                      million of interest and penalties; and (iii) $5 million of professional fees.
        The tax settlement resulted in less than $10 million in cash taxes & interest through 2017

                                                                                                     Appendix   43
STRONG TRACK RECORD OF ORGANIC GROWTH
EXPLORATION AND INFERRED CONVERSION
                            Reserves and Resources Growth2,8

    9.4Moz GEOs                                     11.9M GEOs
                            12.8M GEOs                                       14.8M GEOs
    or 676M SEOs
                            or 923M SEOs            or 858M SEOs             or 1,063M SEOs
       (M&I)
                                                                                 (M&I)

    26.3M GEOs
   or 1,893M SEOs
       (P&P)                                                                 20.0M GEOs
                                                                            or 1,442M SEOs
                                                                                (P&P)

    Total Acquired            Total Mined           Total Exploration &           R&R
                                                   Inferred Conversion
              Exploration and inferred conversion generated over 11.9M GEOs
           and significant exploration upside still exists across the stream portfolio
                                                                                         Appendix   44
STREAMS VS. ROYALTIES
                    Streaming Model                                   Royalty Model

             A ‘stream’ is a long term contract for the
                                                          A ‘royalty’ is generally a registered interest in
            purchase of a certain percentage of refined
                                                                               tenure
                                metal

          Outside of Canada, streaming agreements can     International royalties are viewed as passive
           allow the mining company the flexibility to     foreign income and thus subject to taxes in
           handle their own taxes in the host country            the home country (i.e. Canada)

          Streaming agreements can provide the mining
                                                           A royalty valuation is generally reduced by
          company with more funds upfront compared to
                                                                     higher levels of taxation
                      a royalty agreement

             More capital efficient as a portion of the
                                                           The initial payment for a royalty values all
           payment is deferred and paid on an ongoing
                                                                   expected future production
                 basis upon delivery of ounces

The streaming model has become increasingly popular due to the flexibility provided to operators

                                                                                                 Appendix     45 45
HOW PRECIOUS METALS STREAMING WORKS
A NEW ALTERNATIVE IN PORTFOLIO OPTIMIZATION

                                    UPFRONT PAYMENT
                                (CASH AND/OR WPM SHARES)

    Wheaton makes an
Upfront Payment and in
  return, we purchase a
 fixed percentage of the                                   PARTNER
  future precious metals                                    MINING
 production from a mine                                    COMPANY
at a predetermined price
    (Delivery Payment)

                                   DELIVERY PAYMENT
                                     ($ PER OUNCE)

                                                                 Appendix   46
WHEATON STREAMING MODEL

        ANALYZE THE IMPACT                                                  POTENTIAL
       6                                                                                    1
        ON WHEATON’S                                                        OPPORTUNITY
        PORTFOLIO
                         Using the
                         appropriate discount      After identifying a
                         rate, future cash         potential opportunity,
                         flows are discounted      we use the production
5 FUTURE CASH                                                                       PRODUCTION 2
                         to determine the          profile and reasonable
  FLOWS                                                                             PROFILE
                         value of the stream if    commodity price
                         it were in Wheaton’s      assumption scenarios
                         portfolio, which is the   to map out expected
                         maximum price we’d        cash flows over the
                         be willing to pay.        life of the stream.

       4 APPROPRIATE                                                  COMMODITY PRICE       3
         DISCOUNT RATE                                                ASSUMPTIONS

                                                                                     Appendix   47
WHY WHEATON IS THE PREMIER STREAMING COMPANY
                             An established track record of treating our partners fairly, before and after a stream is
  Focused on sustainable     consummated. Five of our last nine streams on operating assets were with existing partners.
      relationships          Wheaton also provides additional support once a stream is in place including partnering in CSR
                             programs around the mine sites and offering technical support where appropriate.

    Quality is of utmost     Maintaining a focus on high-quality, long-life assets that are accretive to our portfolio – not
       importance            every stream is a Wheaton stream!

    Strong reputation for    Strong internal technical team adheres to a robust due diligence process, allowing us to
   technical excellence      consider any and all opportunities expeditiously.

                             Our knowledge of the streaming model allows us to move more efficiently through to final
   Proven track record       definitive agreements, resolving any issues quickly and rationally.

                             Strong cash flows and access to capital and debt ensures Wheaton’s ability to pursue
  Healthy Balance Sheet      additional acquisitions and complete a transaction without any delays.

                             As a mine matures, so should a stream – streams can be modified in the later stages of a
                             mine’s life to encourage exploration and/or mine-life extension. We have modified five streams
  Demonstrated Flexibility   resulting in significant mine life extension, delivering more ounces to Wheaton and more cash
                             flow to our partners.

                                                                                                                    Appendix   48 48
ATTRIBUTABLE RESERVES & RESOURCES
TOTAL PROVEN & PROBABLE
                                                                                                                     (1,2,3,8,27)
                                Proven & Probable Reserves Attributable to Wheaton Precious Metals
                                         Proven                              Probable                      Proven & Probable
 As of December 31, 2020
 unless otherwise noted (6)   Tonnage       Grade Contained      Tonnage         Grade       Contained    Tonnage     Grade ContainedProcess Recovery (7)
                                   Mt       g/t / % Moz / Mlbs        Mt         g/t / %     Moz / Mlbs        Mt     g/t / % Moz / Mlbs              %
 GOLD
 Salobo (75%) (10)              106.7         0.37       1.27      761.2           0.30           7.32       867.8           0.31    8.59           76%
 Stillwater (11)                  7.9         0.39       0.10       50.3           0.39           0.64        58.2           0.39    0.73           69%
 Constancia (50%)               220.6         0.06       0.42       42.5           0.07           0.09       263.1           0.06    0.52           61%
 Sudbury (70%) (12)              10.3         0.43       0.14       13.5           0.46           0.20        23.8           0.45    0.34           75%
 San Dimas (25%) (13)             0.5         4.38       0.07        0.8           3.12           0.08         1.3           3.59    0.15           95%
 777 (50%)                        1.1         2.01       0.07        0.2           1.75           0.01         1.3           1.96    0.08           58%
 Minto                            0.4         0.25      0.003        2.0           0.67           0.04         2.4           0.60    0.05           75%
 Marmato (6.5%) (12,14)           0.1         5.14       0.01        1.2           3.11           0.12         1.3           3.19    0.13           90%
 Toroparu (10%) (15,16)           3.0         1.10       0.10        9.7           0.98           0.31        12.7           1.00    0.41           89%
 Kutcho (16,17)                     -            -          -       10.4           0.37           0.12        10.4           0.37    0.12           41%
 Metates Royalty (18)             1.4         0.70       0.03        4.1           0.45           0.06         5.5           0.52    0.09           91%
 TOTAL GOLD                                              2.22                                     8.99                              11.21
 PALLADIUM
 Stillwater (4.5%) (11)            0.2           11.2     0.09             1.5        11.2         0.55    1.8           11.2        0.64           90%
 TOTAL PALLADIUM                                          0.09                                     0.55                              0.64
 COBALT
 Voisey's Bay (42.4%)
 (12,24)                           5.7           0.12     14.6             6.5        0.12         17.1   12.1           0.12        31.7           84%
 TOTAL COBALT                                             14.6                                     17.1                              31.7

                                                                                                                                            Appendix        49
ATTRIBUTABLE RESERVES & RESOURCES
TOTAL PROVEN & PROBABLE                                                                                 (1,2,3,8,27)
                                   Proven & Probable Reserves Attributable to Wheaton Precious Metals

                                        Proven                               Probable                         Proven & Probable
 As of December 31, 2020
 unless otherwise noted (6)   Tonnage       Grade     Contained    Tonnage       Grade     Contained      Tonnage      Grade    Contained       Process
                                   Mt       g/t / %   Moz / Mlbs        Mt       g/t / %   Moz / Mlbs          Mt     g/t / %   Moz / Mlbs   Recovery (7)
 SILVER
 Peñasquito (25%) (10)          28.0        37.8           34.0    69.0        32.7             72.4            97.0      34.1      106.4            85%
 Constancia                    441.2         2.9           40.9    85.0         3.8             10.3           526.2       3.0       51.2            70%
 Antamina (33.75%) (12,19)
   Copper                       46.6         6.8           10.2    32.1         7.9              8.1             78.6      7.2       18.3            71%
   Copper-Zinc                  23.0        12.8            9.4    27.3        12.9             11.3             50.3     12.9       20.8            71%
 Neves-Corvo
   Copper                        5.2        31.0            5.2    24.5        30.0             23.6             29.7     30.2       28.8            24%
   Zinc                          4.7        71.0           10.8    25.4        60.6             49.5             30.1     62.2       60.3            30%
 Zinkgruvan
   Zinc                          3.4       77.9             8.5     5.4        83.6             14.5              8.8     81.4       23.0            83%
   Copper                        2.8       30.0             2.7     0.3        33.0              0.3              3.1     30.3        3.0            70%
 Yauliyacu (20)                  1.3       78.9             3.4     6.8       101.1             22.2              8.2     97.4       25.6            83%
 Aljustrel (21)                  9.7       47.4            14.8    27.4        46.9             41.4             37.2     47.1       56.2            26%
 San Dimas (25%) (13)            0.5      312.5             4.8     0.8       327.2              8.4              1.3    321.7       13.2            94%
 Cozamin (50%) (12,22)
   Copper                          -           -              -     6.3        44.4              9.0               6.3    44.4        9.0            86%
   Zinc                            -           -              -     0.7        44.3              1.1               0.7    44.3        1.1            86%
 Keno Hill (25%)
   Underground                     -           -              -     0.3       804.5              7.6             0.3     804.5        7.6            96%
 Los Filos                      26.2         3.5            3.0    78.1        10.2             25.5           104.2       8.5       28.5            10%
 Stratoni                          -           -              -     0.6       148.0              2.7             0.6     148.0        2.7            80%
 777                             2.1        27.0            1.8     0.5        26.0              0.4             2.6      26.8        2.2            45%
 Minto                           0.4         3.4            0.0     2.0         6.0              0.4             2.4       5.6        0.4            78%

                                                                                                                                        Appendix            50
ATTRIBUTABLE RESERVES & RESOURCES
TOTAL PROVEN & PROBABLE                                                                                    (1,2,3,8,27)
                                      Proven & Probable Reserves Attributable to Wheaton Precious Metals

                                         Proven                               Probable                           Proven & Probable
 As of December 31, 2020
 unless otherwise noted (6)   Tonnage        Grade     Contained    Tonnage       Grade     Contained        Tonnage      Grade    Contained       Process
                                   Mt        g/t / %   Moz / Mlbs        Mt       g/t / %   Moz / Mlbs            Mt     g/t / %   Moz / Mlbs   Recovery (7)

 SILVER
 Marmato (12,14)                0.8          22.1        0.6         18.9         6.2          3.8          19.7           6.9        4.4                 34%
 Rosemont (23)                408.6           5.0       66.2        108.0         3.0         10.4         516.6           4.6      76.7                  76%
 Kutcho (16,17)                   -              -         -          9.9        34.6         11.0           9.9          34.6      11.0                  46%
 Metates Royalty (18)           1.4          17.2        0.8          4.1        13.1          1.7           5.5          14.2        2.5                 66%
 TOTAL SILVER                                          217.3                                335.6                                  552.9

                                                                                                                                            Appendix            51
ATTRIBUTABLE RESERVES & RESOURCES
TOTAL MEASURED & INDICATED
                                                                                                                          (1,2,3,8,27)
                                  Measured & Indicated Resources Attributable to Wheaton Precious Metals
                                                 Proven                                  Probable                                     Proven & Probable
 As of December 31, 2020 unless
 otherwise noted (6)                 Tonnage         Grade      Contained    Tonnage         Grade           Contained              Tonnage       Grade     Contained
                                          Mt         g/t / %    Moz / Mlbs        Mt         g/t / %         Moz / Mlbs                  Mt       g/t / %   Moz / Mlbs
 GOLD
 Salobo (75%) (10)                       3.5           0.27          0.03      294.6           0.31               2.90                   298.1      0.31         2.93
 Stillwater (11)                         3.3           0.26          0.03       13.3           0.21               0.09                    16.6      0.22         0.12
 Constancia (50%)                       67.1           0.05          0.10       80.2           0.04               0.11                   147.2      0.04         0.21
 Sudbury (70%) (12)                      1.3           0.22          0.01        7.1           0.76               0.17                     8.3      0.68         0.18
 777 (50%)                               0.2           1.97          0.01        0.1           1.57               0.00                     0.3      1.86         0.02
 Minto                                   3.3           0.40          0.04        9.0           0.57               0.17                    12.4      0.53         0.21
 Marmato (6.5%) (12,14)                  0.1           5.30          0.01        1.1           2.62               0.09                     1.1      2.81         0.10
 Toroparu (10%) (15,16)                  1.2           0.93          0.03        9.0           0.87               0.25                    10.2      0.87         0.29
 Cotabambas (25%) (16,25)                  -              -             -       29.3           0.23               0.22                    29.3      0.23         0.22
 Kutcho (16,17)                            -              -             -        5.7           0.55               0.10                     5.7      0.55         0.10
 Brewery Creek (26)                        -              -             -        0.4           1.11               0.02                     0.4      1.11         0.02
 TOTAL GOLD                                                          0.27                                         4.12                                           4.39

 COBALT
 Voisey's Bay (42.4%) (12,24)              1.7                0.04     1.5               -               -            -                    1.7       0.04          1.5
 TOTAL COBALT                                                          1.5                                            -                                            1.5

 PALLADIUM
 Stillwater (4.5%) (11)                   0.03                 7.1    0.01             0.1             5.1         0.02                    0.2        5.5        0.03
 TOTAL PALLADIUM                                                      0.01                                         0.02                                          0.03

                                                                                                                                                 Appendix         52
ATTRIBUTABLE RESERVES & RESOURCES
TOTAL MEASURED & INDICATED
                              Measured & Indicated Resources Attributable to Wheaton Precious Metals (1,2,3,4,5,9,27)
                                                 Measured                              Indicated                       Measured & Indicated
  As of December 31, 2020 unless
                                      Tonnage         Grade     Contained    Tonnage         Grade     Contained    Tonnage      Grade      Contained
  otherwise noted (6)
                                           Mt         g/t / %   Moz / Mlbs        Mt         g/t / %   Moz / Mlbs        Mt      g/t / %    Moz / Mlbs
  SILVER
  Peñasquito (25%) (10)                    8.7         26.8            7.5    60.5          26.7            52.0          69.2       26.8         59.5
  Constancia                             134.1          2.0            8.8   160.3           2.0            10.3         294.4        2.0         19.1
  Antamina (33.75%) (12,19)
    Copper                                31.2          7.0            7.0   108.1           9.0            31.3         139.3        8.6         38.3
    Copper-Zinc                           10.5         21.0            7.1    49.4          19.0            30.2          59.9       19.4         37.3
  Neves-Corvo
    Copper                                 4.8         55.8           8.7     28.7          52.4            48.3          33.5       52.9         57.0
    Zinc                                   6.7         61.9          13.4     35.7          59.0            67.8          42.4       59.5         81.2
  Zinkgruvan
    Zinc                                   3.7         64.6           7.7     11.2         76.3             27.4          14.9       73.4         35.1
    Copper                                 1.2         42.4           1.6      0.2         39.8              0.3           1.4       42.0          1.9
  Yauliyacu (20)                           5.9        101.4          19.2      8.0        121.8             31.2          13.9      113.1         50.4
  Aljustrel (21)                           4.3         67.3           9.3      3.9         58.9              7.4           8.2       63.3         16.7
  Cozamin (50%) (12,22)
    Copper                                 0.2         53.3           0.3      4.5          36.9             5.3           4.7       37.5         5.6
    Zinc                                     -            -             -      2.2          31.2             2.3           2.2       31.2         2.3
  Pascua-Lama (25%)                       10.7         57.2          19.7     97.9          52.2           164.4         108.6       52.7       184.1
  Keno Hill (25%)
    Underground                              -            -             -      0.7        455.8             10.5           0.7      455.8         10.5
    Elsa Tailings                            -            -             -      0.6        119.0              2.4           0.6      119.0          2.4
  Los Filos                               88.5          5.3          15.2    133.7          8.1             35.0         222.2        7.0         50.2
  Stratoni                                   -            -             -      0.4        138.5              2.0           0.4      138.5          2.0
  777                                      0.4         25.4           0.3      0.1         26.4              0.1           0.5       25.7          0.4
  Minto                                    3.3          3.4           0.4      9.0          5.0              1.5          12.4        4.6          1.8

                                                                                                                                       Appendix          53
ATTRIBUTABLE RESERVES & RESOURCES
TOTAL MEASURED & INDICATED
                              Measured & Indicated Resources Attributable to Wheaton Precious Metals (1,2,3,4,5,9,27)
                                                 Measured                              Indicated                       Measured & Indicated
  As of December 31, 2020 unless
                                      Tonnage         Grade     Contained    Tonnage         Grade     Contained    Tonnage      Grade      Contained
  otherwise noted (6)
                                           Mt         g/t / %   Moz / Mlbs        Mt         g/t / %   Moz / Mlbs        Mt      g/t / %    Moz / Mlbs
  SILVER
  Marmato (12,14)                          0.9         26.5           0.8     12.8          8.1              3.4          13.8        9.4         4.2
  Rosemont (23)                          112.2          3.9          14.1    358.0          2.7             31.5         470.2        3.0        45.6
  Loma de La Plata (12.5%)                   -            -             -      3.6        169.0             19.8           3.6      169.0        19.8
  Toroparu (50%) (15,16)                  21.9          1.1           0.8     98.5          0.7              2.3         120.4        0.8         3.1
  Cotabambas (16,25)                         -            -             -    117.1          2.7             10.3         117.1        2.7        10.3
  Kutcho (16,17)                             -            -             -      5.4         25.9              4.5           5.4       25.9         4.5
  TOTAL SILVER                                                      141.8                                  601.3                                743.1

                                                                                                                                       Appendix          54
ATTRIBUTABLE RESERVES & RESOURCES
TOTAL INFERRED
                                                                    (1,2,3,4,5,9,27)                                                                              (1,2,3,4,5,9,27)
      Inferred Resources Attributable to Wheaton Precious Metals                                  Inferred Resources Attributable to Wheaton Precious Metals
                                                    Inferred                                                                                      Inferred
 As of December 31, 2020 unless                                                               As of December 31, 2019 unless
                                         Tonnage          Grade           Contained                                                  Tonnage            Grade           Contained
 otherwise noted (6)                                                                          otherwise noted (6)
                                              Mt          g/t / %         Moz / Mlbs                                                      Mt            g/t / %         Moz / Mlbs
                                                                                              SILVER
 GOLD                                                                                         Peñasquito (25%) (10)                        37.7            26.4                      32.0
 Salobo (75%) (10)                          198.5           0.22                       1.39   Constancia                                   93.2             3.4                      10.3
                                                                                              Antamina (33.75%) (12,19)
 Stillwater (11)                             96.2           0.43                       1.32     Copper                                    219.7             9.0                      63.6
 Constancia (50%)                            46.6           0.06                       0.09     Copper-Zinc                               104.2            16.0                      53.6
                                                                                                Neves Corvo Copper                         12.6            33.2                      13.5
 Sudbury (70%) (12)                           2.9           0.49                       0.05
                                                                                                Neves Corvo Zinc                            3.7            63.0                       7.4
 San Dimas (25%) (13)                         1.5           3.58                       0.17   Zinkgruvan
 777 (50%)                                    0.1           3.11                       0.01     Zinc                                       19.0            82.0                   50.0
                                                                                                Copper                                      0.2            35.0                    0.3
 Minto                                        6.1           0.51                       0.10   Yauliyacu (20)                               13.4           246.9                  106.8
 Marmato (6.5%) (12,14)                       0.9           2.56                       0.07   Aljustrel (21)                               15.7            46.2                   23.3
                                                                                              San Dimas (25%) (13)                          1.5           340.9                   16.1
 Cotabambas (25%) (16,25)                   151.3           0.17                       0.84
                                                                                              Cozamin (50%) (12,22)
 Toroparu (10%) (16,17)                      12.9           0.76                       0.32     Copper                                      2.0            40.9                    2.6
 Kutcho (16,17)                               8.8           0.25                       0.07     Zinc                                        2.6            37.5                    3.2
                                                                                              Rosemont (23)                                68.7             1.7                    3.7
 Brewery Creek (26)                           1.3           0.87                       0.04   Pascua-Lama (25%)                             3.8            17.8                    2.2
 Metates Royalty (18)                         0.3           0.39                   0.003      Keno Hill (25%)                               0.4           454.6                    6.1
                                                                                              Los Filos                                    98.2             6.1                   19.4
 TOTAL GOLD                                                                            4.46
                                                                                              Stratoni                                      1.1           188.0                    6.9
 PALLADIUM                                                                                    777                                           0.2            40.0                    0.3
 Stillwater (4.5%) (11)                       1.0           12.1                       0.37   Minto                                         6.1             4.9                    1.0
 TOTAL PALLADIUM                                                                       0.37   Marmato (12,14)                              13.1             4.4                    1.9
 COBALT                                                                                       Loma de La Plata (12.5%)                      0.2            76.0                    0.4
 Voisey's Bay (42.4%) (12,24)                 2.5           0.14                        7.6   Cotabambas (16,25)                          605.3             2.3                   45.4
 TOTAL COBALT                                                                           7.6   Toroparu (50%) (15,16)                       58.7             0.1                    0.1
                                                                                              Kutcho (16,17)                                8.8            20.6                    5.8
                                                                                              TOTAL SILVER                                                                       475.8

                                                                                                                                                                   Appendix                 55
ATTRIBUTABLE RESERVES & RESOURCES
ENDNOTES
1.    All Mineral Reserves and Mineral Resources have been estimated in accordance with the 2014 Canadian Institute of Mining, Metallurgy and Petroleum (CIM) Standards for Mineral Resources and Mineral
      Reserves and National Instrument 43-101 – Standards for Disclosure for Mineral Projects (“NI 43-101”), or the 2012 Australasian Joint Ore Reserves Committee (JORC) Code for Reporting of Exploration
      Results, Mineral Resources and Ore Reserves.
2.    Mineral Reserves and Mineral Resources are reported above in millions of metric tonnes (“Mt”), grams per metric tonne (“g/t”) for gold, silver and palladium, percent (“%”) for cobalt, millions of ounces
      (“Moz”) for gold, silver and palladium and millions of pounds (“Mlbs”) for cobalt.
3.    Qualified persons (“QPs”), as defined by the NI 43-101, for the technical information contained in this document (including the Mineral Reserve and Mineral Resource estimates) are:
            a)    Neil Burns, M.Sc., P.Geo. (Vice President, Technical Services); and
            b)    Ryan Ulansky, M.A.Sc., P.Eng. (Senior Director, Engineering),
both employees of the Company (the “Company’s QPs”).
4.    The Mineral Resources reported in the above tables are exclusive of Mineral Reserves. The Cozamin mine, San Dimas mine, Minto mine, Neves-Corvo mine, Zinkgruvan mine, Stratoni mine, Stillwater
      mines, Keno Hill mines, Aljustrel mines and Toroparu project (gold only) report Mineral Resources inclusive of Mineral Reserves. The Company’s QPs have made the exclusive Mineral Resource estimates
      for these mines based on average mine recoveries and dilution
5.    Mineral Resources which are not Mineral Reserves do not have demonstrated economic viability
6.    Other than as detailed below, Mineral Reserves and Mineral Resources are reported as of December 31, 2020 based on information available to the Company as of the date of this document, and
      therefore will not reflect updates, if any, after such date.
            a)    Mineral Resources for Aljustrel’s Feitais mine are reported as of July 2020, Moinho & St João mines as of August 2020 and the Estação project as of July, 2018.
            b)     Mineral Resources for the Brewery Creek project are reported as of May 31, 2020.
            c)    Mineral Resources and Mineral Reserves for the Constancia, 777 and San Dimas mines are reported as of December 31, 2019.
            d)    Mineral Resources for the Cotabambas project are reported as of June 20, 2013.
            e)    Mineral Resources and Mineral Reserves for the Cozamin mine are reported as of October 31, 2020.
            f)    Mineral Resources for Keno Hill’s Elsa Tailings project are reported as of April 22, 2010, Bellekeno mine Indicated Mineral Resources as of September 30, 2013, Mineral Resources for the
                  Lucky Queen, Flame & Moth and Onek mines as of March 29, 2017 and Bermingham mine as of March 28, 2019. Mineral Reserves are reported as of March 28, 2019.
            g)     Mineral Resources for the Kutcho project are reported as of September 8, 2020 and Mineral Reserves are reported as of June 15, 2017.
            h)    Mineral Resources for the Loma de La Plata project are reported as of May 20, 2009.
            i)    Mineral Resources and Mineral Reserves for the Los Filos mine are reported as of October 31, 2018.
            j)    Mineral Resources and Mineral Reserves for the Neves-Corvo and Zinkgruvan mines are reported as of June 30, 2020.
            k)    Mineral Resources and Mineral Reserves for the Marmato mine are reported as of March 17, 2020.
            l)    Mineral Resources and Mineral Reserves for the Metates royalty are reported as of April 29, 2016.
            m) Mineral Resources and Mineral Reserves for the Minto mine are reported as of December 31, 2018.
            n)    Mineral Resources and Mineral Reserves for the Rosemont project are reported as of March 30, 2017.
            o)     Mineral Resources and Mineral Reserves for the Stratoni mine are reported as of September 30, 2020.
            p)    Mineral Resources for the Toroparu project are reported as of September 20, 2018 and Mineral Reserves are reported as of March 31, 2013.
7.     Process recoveries are the average percentage of gold, silver, palladium or cobalt in a saleable product (doré or concentrate) recovered from mined ore at the applicable site process plants as reported by
      the operators.

                                                                                                                                                                                          Endnotes               56
ATTRIBUTABLE RESERVES & RESOURCES
     ENDNOTES (CONTINUED)
8.   Mineral Reserves are estimated using appropriate process and mine recovery rates, dilution, operating costs and the following commodity prices:
           a.    Aljustrel mine – 3.5% zinc cut-off for the Feitais, Moinho and St João mines and 3.0% zinc cut-off for the Estação project.
           b.    Antamina mine - $3.08 per pound copper, $1.08 per pound zinc, $8.70 per pound molybdenum and $17.39 per ounce silver.
           c.    Constancia mine - $1,375 per ounce gold, $17.00 per ounce silver, $3.10 per pound copper and $11.00 per pound molybdenum.
           d.    Cozamin mine - NSR cut-offs of $48.04 per tonne for conventionally backfilled zones for 2020-2022, $51,12 per tonne for conventionally backfilled zones for 2023 and onward, $56.51 per tonne for paste
                 backfilled zones of Vein 10 and $56.12 per tonne for paste backfilled zones of Vein 20, all assuming $2.75 per pound copper, $17.00 per ounce silver, $0.90 per pound lead and $1.00 per pound zinc.
           e.    Keno Hill mines - $1,300 per ounce gold, $18.50 per ounce silver, $1.00 per pound lead and $1.15 per pound zinc.
           f.    Kutcho project – 1.5% copper cut-off for the Main deposit and 1.0% copper cut-off for the Esso deposit, both assuming $2.75 per pound copper, $1.10 per pound zinc, $1,250 per ounce gold and $17.00 per
                 ounce silver.
           g.    Los Filos mine - $1,200 per ounce gold and $4.39 per ounce silver.
           h.    Marmato mine – 2.23 grams per tonne gold cut-off for the Upper Mine, 1.91 grams per tonne gold cut-off for the Transition Zone and 1.61 grams per tonne gold cut-off for the MDZ, all assuming $1,400 per
                 ounce gold.
           i.    Metates royalty – 0.34 grams per tonne gold equivalent cut-off assuming $1,200 per ounce gold and $19.20 per ounce silver.
           j.    Minto mine – 1.2% copper cut-off assuming $300 per ounce gold, $3.90 per ounce silver and $2.50 per pound copper.
           k.    Neves-Corvo mine – 1.34% copper equivalent cut-off for the copper Mineral Reserves and 5.34% zinc equivalent cut-off for the zinc Mineral Reserves, both assuming $3.00 per pound copper, $0.95 per
                 pound lead and $1.00 per pound zinc.
           l.    Peñasquito mine - $1,200 per ounce gold, $17.00 per ounce silver, $0.90 per pound lead and $1.15 per pound zinc.
           m.    Rosemont project - $6.00 per ton NSR cut-off assuming $18.00 per ounce silver, $3.15 per pound copper and $11.00 per pound molybdenum.
           n.    Salobo mine – 0.253% copper equivalent cut-off assuming $1,290 per ounce gold and $3.18 per pound copper.
           o.    San Dimas mine – $1,350 per ounce gold and $17.50 per ounce silver.
           p.    Stillwater mines - combined platinum and palladium cut-off of 6.8 g/t.
           q.    Stratoni mine – $273.40 per tonne NSR cut-off assuming $16.00 per ounce silver, $0.91 per pound lead and $1.00 per pound zinc.
           r.    Sudbury mines - $1,300 per ounce gold, $8.16 per pound nickel, $3.18 per pound copper, $1,155 per ounce platinum, $1,093 per ounce palladium and $22.68 per pound cobalt.
           s.    Toroparu project – 0.38 grams per tonne gold cut-off assuming $1,070 per ounce gold for fresh rock and 0.35 grams per tonne gold cut-off assuming $970 per ounce gold for saprolite.
           t.    Voisey’s Bay mines:
                       i.      Ovoid and SE Extension – Cdn $20.56 per tonne cut-off assuming $6.80 per pound nickel, $3.08 per pound copper and $29.48 per pound cobalt.
                       ii.     Discovery Hill - $29.52 per tonne cut-off assuming $8.16 per pound nickel, $3.18 per pound copper and $22.68 per pound cobalt
                       iii.     Reid Brook Division 1 - $225.00 per tonne cut-off assuming $6.35 per pound nickel, $2.90 per pound copper and $20.41 per pound cobalt.
                       iv.      Reid Brook Divisions 2-4 - $275.00 per tonne cut-off assuming $9.71 per pound nickel, $3.40 per pound copper and $11.52 per pound cobalt.Eastern Deeps Mineral Reserves - $175.00 per
                               tonne cut-off assuming $6.35 per pound nickel, $2.90 per pound copper and $20.41 per pound cobalt.
           u.    Yauliyacu mine - $17.39 per ounce silver, $3.08 per pound copper, and $1.08 per pound zinc.
           v.    Zinkgruvan mine – 6.1% zinc equivalent cut-off for the zinc Mineral Reserve and 1.4% copper cut-off for the copper Mineral Reserve, both assuming $3.00 per pound copper and $0.95 per pound lead and
                 $1.00 per pound zinc.
           w.    777 mine – $1,392 per ounce gold, $16.33 per ounce silver, $2.92 per pound copper and $1.11 per pound zinc.

                                                                                                                                                                                           Endnotes              57
You can also read