THE HUDSON BAY LITHOSPHERIC EXPERIMENT (HUBLE): INSIGHTS INTO PRECAMBRIAN PLATE TECTONICS AND THE DEVELOPMENT OF MANTLE KEELS - GEOLOGICAL SOCIETY ...
←
→
Page content transcription
If your browser does not render page correctly, please read the page content below
Downloaded from http://sp.lyellcollection.org/ by guest on January 3, 2021

    The Hudson Bay Lithospheric Experiment (HuBLE): insights into
    Precambrian plate tectonics and the development of mantle keels
    I. D. BASTOW1*, D. W. EATON2, J.-M. KENDALL3, G. HELFFRICH3, D. B. SNYDER4,
          D. A. THOMPSON5, J. WOOKEY3, F. A. DARBYSHIRE6 & A. E. PAWLAK2
1
 Department of Earth Science and Engineering, Imperial College London, London SW7 2AZ, UK
         2
             Department of Geoscience, University of Calgary, Alberta, Canada T2N 1N4
              3
               Department of Earth Sciences, University of Bristol, Bristol BS8 1RJ, UK
4
 Geological Survey of Canada, Natural Resources Canada, Ottawa, Ontario, Canada K1A 0E9
         5
             School of Earth and the Environment, University of Leeds, Leeds LS2 9JT, UK
                  6
                   Centre de Recherche GEOTOP, Université du Québec á Montréal,
                                Montréal, Québec, Canada H3C 3P8
                        *Corresponding author (e-mail: i.bastow@imperial.ac.uk)

             Abstract: Hudson Bay Lithospheric Experiment (HuBLE) was designed to understand the pro-
             cesses that formed Laurentia and the Hudson Bay basin within it. Receiver function analysis
             shows that Archaean terranes display structurally simple, uniform thickness, felsic crust.
             Beneath the Palaeoproterozoic Trans-Hudson Orogen (THO), thicker, more complex crust is inter-
             preted as evidence for a secular evolution in crustal formation from non-plate-tectonic in the
             Palaeoarchaean to fully developed plate tectonics by the Palaeoproterozoic. Corroborating this
             hypothesis, anisotropy studies reveal 1.8 Ga plate-scale THO-age fabrics. Seismic tomography
             shows that the Proterozoic mantle has lower wavespeeds than surrounding Archaean blocks; the
             Laurentian keel thus formed partly in post-Archaean times. A mantle transition zone study indi-
             cates ‘normal’ temperatures beneath the Laurentian keel, so any cold mantle down-welling associ-
             ated with the regional free-air gravity anomaly is probably confined to the upper mantle. Focal
             mechanisms from earthquakes indicate that present-day crustal stresses are influenced by glacial
             rebound and pre-existing faults. Ambient-noise tomography reveals a low-velocity anomaly,
             coincident with a previously inferred zone of crustal stretching, eliminating eclogitization of
             lower crustal rocks as a basin formation mechanism. Hudson Bay is an ephemeral feature,
             caused principally by incomplete glacial rebound. Plate stretching is the primary mechanism
             responsible for the formation of the basin itself.

             Gold Open Access: This article is published under the terms of the CC-BY 3.0 license.

Much of the geological record can be interpreted in               Cratonic regions are readily identified in global
the context of processes operating at the present-            tomographic images where they are characterized
day plate boundaries. While the plate tectonic para-          by their deep-seated, fast wavespeed lithospheric
digm works well to explain processes and products             keels. Roots can extend to depths of ≥250 km into
during the Phanerozoic era, during Precambrian                the upper mantle, in contrast to the oceans and Pha-
times, when the oldest rocks were forming, condi-             nerozoic continents where the plates are usually
tions on the younger, hotter, more ductile Earth              ≤100 km thick (Fig. 2; e.g. Ritsema et al. 2011).
were probably very different, making analogies                The tectosphere, or lithospheric mantle beneath a
with modern-day tectonics less certain. The pre-              craton (e.g. Jordan 1988), is thus thought to have a
cise onset of ‘continental drift’ is disputed; it has,        thermochemical signature that differs from aver-
for example, been estimated to be as early as c.              age lithospheric mantle, and keel formation is com-
4.1 Ga (e.g. Hopkins et al. 2008), or as late as c.           monly associated with Archaean processes, such as
1 Ga (e.g. Stern 2005) – a time span covering                 the extraction of komatiitic magmas (e.g. Griffin
approximately two-thirds of Earth history (Fig. 1).           et al. 2003), to explain the intrinsic low density of
Gathering evidence preserved deep within the                  the tectosphere. It is estimated that the chemical
plates in stable Precambrian regions (shields) is             lithosphere must be more viscous than normal
thus essential to improve our understanding of                mantle by a factor of c. 20 (Sleep 2003), enabl-
early Earth processes.                                        ing it to survive thermal and mechanical erosion

From: Roberts, N. M. W., van Kranendonk, M., Parman, S., Shirey, S. & Clift, P. D. (eds) Continent Formation
Through Time. Geological Society, London, Special Publications, 389, http://dx.doi.org/10.1144/SP389.7
# 2013 The Authors. Publishing disclaimer: www.geolsoc.org.uk/pub_ethics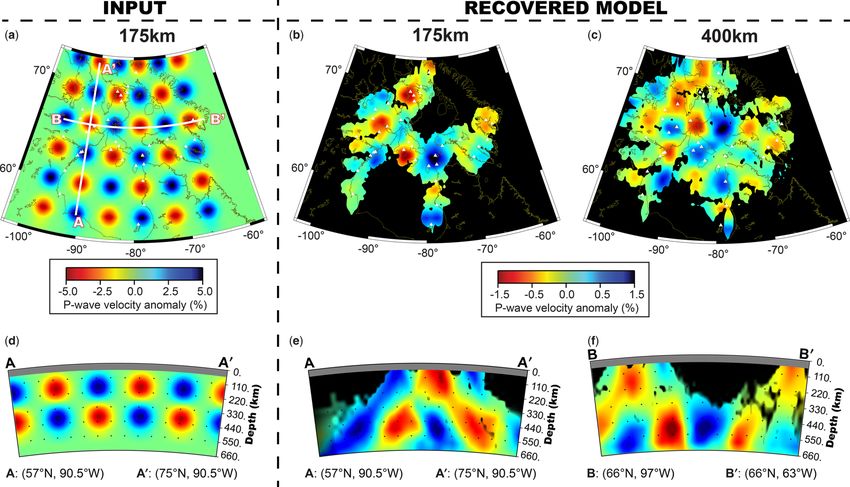
Downloaded from http://sp.lyellcollection.org/ by guest on January 3, 2021

                                                           I. D. BASTOW ET AL.

                                                                     subdivisions of the Canadian shield were assembled
Eon

               Era
                                                                     in Precambrian times, how the deep cratonic keel
                           500Ma                                     formed beneath them, and how the Hudson Bay
                                                                     basin subsequently developed within the shield,
               Neo

                                                                     have each been difficult questions to address until
                                   Stern, Geology (2005)             recently. Hypotheses have been based principally
                           1Ga                                       on evidence from the geological record and poten-
                                                                     tial field maps (e.g. gravity and magnetics), and seis-
               Meso
 Proterozoic

                                                                     mological studies of the deeper mantle were limited
                                                                     by the availability of data from only two or three
                                                                     permanent seismic stations.
                                                                         To address outstanding research questions exem-
                                   Hamilton, GSA Today (2003)        plified by the Hudson Bay region, a broadband
               Palaeo

                           2Ga                                       seismograph network in the Hudson Bay region was
                                                                     deployed by the Hudson Bay Lithospheric Exper-
                                                                     iment (HuBLE); stations have operated since
                                                                     2003. The purpose of this contribution is to review
                                                                     the results of HuBLE, and to synthesize their impli-
               Neo

                                                                     cations for Precambrian processes, the formation
                                                                     of the Laurentian keel, and the reasons for the Pha-
               Meso

                                   Cawood et al., GSA Today (2006)   nerozoic development of the Hudson Bay basin. In
 Archaean

                                                                     addition to reviewing already-published HuBLE
                                                                     constraints (e.g. Thompson et al. 2010; 2011; Bas-
               Palaeo Eo

                                                                     tow et al. 2011a, b; Pawlak et al. 2011, 2012; Stef-
                                                                     fen et al. 2012; Snyder et al. 2013; Darbyshire et al.
                                   Furnes et al., Science (2007)     2013), this contribution presents the results of a
                                                                     new P-wave relative arrival-time tomographic study
                                                                     of mantle wavespeed structure beneath the region.
                           4Ga
 Hadean

                                   Hopkins et al., Nature (2008)

                                                                     Tectonic setting
                                                                     The Canadian Shield lies in the heart of Precam-
Fig. 1. Estimates of the onset of modern-style plate                 brian North America. Comprising several Archaean
tectonics.                                                           terranes brought together during a series of orogens
                                                                     during the Palaeoproterozoic, the region is one of
                                                                     the largest exposures of Precambrian rocks on
during multiple Wilson cycles over billions of years.                Earth (Hoffman 1988). The major phase of moun-
Precisely how keels formed remains poorly under-                     tain building in the region was believed to have
stood, however.                                                      occurred at c. 1.8 Ga during the THO (Hoffman
    The geological record of northern Canada spans                   1988; St-Onge et al. 2006). The Superior craton
more than 2 billion years of early Earth history (c.                 formed the indenting lower plate to the collision;
3.9–1.7 Ga; Hoffman 1988), making it an ideal                        the Churchill plate, presently lying to the north of
study locale for the analysis of Precambrian Earth                   the Superior craton, was the upper plate. Extensive
processes. In the heart of the Canadian Shield lies                  geological mapping in recent years has added con-
Hudson Bay, a vast inland sea, which masks a sig-                    siderable detail to this two-plate picture (Fig. 3).
nificant portion of the Trans-Hudson Orogen (THO),                       It is now thought that northern Hudson Bay
a Palaeoproterozoic collision between the Archaean                   comprises seven distinct crustal blocks, including
Superior and Western Churchill cratons. The THO                      the Superior, Rae, Hearne, Chesterfield, Meta
signalled the final stages of assembly of Laurentia                  Incognita, Sugluk and Hall Peninsula (Fig. 3; see
at c. 1.8 Ga (Fig. 3: Hoffman 1988; St-Onge et al.                   e.g. Snyder et al. 2013; Berman et al. 2013, for
2006; Eaton & Darbyshire 2010). The region is                        a more detailed review). The Superior craton to
underlain by one of the largest continental keels                    the south is a collage of Meso- to Neoarchaean
on Earth (Fig. 2) and is also the site of one of the                 microcontinents and oceanic terranes amalgamated
largest negative geoid anomalies (e.g. Hoffman                       2.72 –2.66 Ga. The Ungava Peninsula bounds east-
1990). The cratonic keel beneath the Hudson Bay                      ern Hudson Bay and exposes 3.22 –2.65 Ga felsic
region extends beneath both Archaean and Protero-                    orthogneiss and plutonic rocks that underlie
zoic terranes. How these various lithospheric                        c. 2.0–1.87 Ga volcanic and sedimentary rocks of
Downloaded from http://sp.lyellcollection.org/ by guest on January 3, 2021

                                THE HUDSON BAY LITHOSPHERIC EXPERIMENT

                (a)                                  Depth = 225 km
                                                   Shear velocity anomaly (%)

                                              -2       -1       0         1     2

                (b)                                     LAB Depth
                                                                                    km
                                             225        250         275       300

                                                             Fennoscandia
                                                                               Siberia
                                               Canadian                               China
                                                Shield

                                              W. African                      Arabia
                                               Craton
                                          Sao         Congo
                                       Francisco      Craton                        Australia
                                        Craton

                                                            Antarctica

Fig. 2. (a) A slice at 225 km depth through the global shear wave tomographic model of Ritsema et al. (2011). The
regions of fast wavespeed delineate the cratons world-wide. (b) A global view of the lithosphere–asthenosphere
boundary (LAB) based on the model of Ritsema et al. (2011). The depth of the LAB can be defined in several ways (e.g.
Eaton et al. 2009), but is defined here as the depth to the 1.75% fast contour. Areas of apparently thick lithosphere that
are an artefact of high-wavespeed subducting slabs in the mantle are not plotted and thus appear as black (in oceanic
regions) or white (in continental regions).

the Cape Smith fold belt (e.g. St-Onge et al. 2009,                 ancient nature of the northern Rae domain (e.g.
and references therein).                                            Whalen et al. 2011).
    The Rae craton comprises Meso- to Neoarcha-                         The Hearne craton is characterized by c. 2.7 Ga
ean, amphibolite- to granulite-facies, tonalitic to gra-            mafic to intermediate volcanic rocks (e.g. central
nitic orthogneisses and NE-striking c. 2.9– 2.7 Ga                  Hearne supracrustal belt; Davis et al. 2004) cut by
greenstone belts (e.g. Jackson 1966; Wodicka                        c. 2.66 Ga granitic plutons associated with regional
et al. 2011a). The Rae is intruded by 2.72–2.68 Ga                  metamorphism (Davis et al. 2004). The Hearne is
tonalite, with voluminous c. 2.62–2.58 Ga mon-                      distinguished from Rae by its relatively young
zogranitic plutons (e.g. Bethune et al. 2011, and                   (Mesoarchaean) volcanic rocks, and by its lack of
references therein) extending from northwestern                     Archaean magmatism or tectonism post 2.66 Ga.
Saskatchewan at least as far east as Melville Penin-                The Chesterfield block (C.B. in Fig. 3; Davis et al.
sula (Wodicka et al. 2011a). Zircon inheritance                     2006) comprises c. 2.7 Ga supracrustal rocks and
and Nd model ages of up to 3.6 Ga confirm the                       tonalite plutons, but lacks both the komatiitic
Downloaded from http://sp.lyellcollection.org/ by guest on January 3, 2021

                                                I. D. BASTOW ET AL.

                                                                                      Ba
                                                                                           ffi
            70˚                                                      Ba                       n
                                                                       ffi                        St
                                 L                                         n                        ra
                           C HIL                                                 Is
                                                                                   la
                                                                                                        it
                         UR E                                                          nd
                       CH PLAT                        M.P.
                                                              Foxe
                                   Rae                        Basin
                                                                                      C.B.                   B.S.
                                                        Soton. Is.
                                         S.T.                                         M.I.
                                             Z.                 lukHuds                            H.P.
                                 Ch.B.                    Sug              on S
                                                                                   trait
                                                                               .
                                                                          .F.B
                           Hearne                                    C.S
     60˚
                                                                           Ungava
                                         Hudson                           Peninsula

                                          Bay                        SUPERIOR
                                                Trans Hudson           PLATE
                                                   Orogen

 −110˚                                                                                                                −60˚
                     −100̊                                                                       −70˚
                                           −90˚                 −80˚
ARCHAEAN                             PALAEOPROTEROZOIC                                                   RECENT

    Superior/Hearne                      Arc Material          Sedimentary Rocks                              Phanerozoic Cover

    Rae                                  Granite               Grenville                                      Diamond Prospect

    Greenstone Terranes                  Fold Belts            Baker Lake/Thelon Groups

Fig. 3. Seismograph networks in northern Hudson Bay superimposed on regional geology. Ch.B., Chesterfield Block;
C.B., Cumberland Batholith; B.S., Baffin Suture; C.S.F.B., Cape Smith Fold Belt; H.P., Hall Peninsula; M.I., Meta
Incognita; STZ, Snowbird Tectonic Zone. Yellow triangles are HuBLE-UK stations. White triangles are POLARIS
network stations. Blue triangles are permanent stations.

assemblages and evolved isotopic character of the            Hudson Bay. It is inferred from evolved Nd signa-
Rae craton. The Chesterfield block is intruded by            tures to underlie the northern tip of Quebec (e.g.
2.6 Ga granitic plutons (Davis et al. 2006) that are         Corrigan et al. 2009) where it is heavily intruded
thought to have formed after its c. 2.64 Ga accre-           by younger c. 1.86 –1.82 Ga plutons (St-Onge et al.
tion to the Rae craton (Berman et al. 2007).                 2006). Corrigan et al. (2009) suggested that it may
Smaller and less well understood domains in NE               extend west under Hudson Bay to merge with a
Hudson Bay include the Meta Incognita, Sugluk                gravity high referred to as the ‘Hudson protoconti-
and Hall Peninsula blocks (Fig. 3).                          nent’ (Roksandic et al. 1987; Berman et al. 2005).
    The Meta Incognita microcontinent (Fig. 3)               Hall Peninsula, southeastern Baffin Island, exposes
includes Palaeoproterozoic (2.40, 2.34 –2.31, 2.15,          Mesoarchaean crust (2.92–2.8 Ga zircon crystalli-
1.95 Ga) and lesser Neoarchaean (2.68– 2.6 Ga)               zation ages; Scott 1997) which, given its spatial dis-
components (St-Onge et al. 2006; Wodicka et al.              tribution, is tentatively considered a separate crustal
2011b), overlain by Palaeoproterozoic clastic car-           block (e.g. Whalen et al. 2010). Amalgamation of
bonates of the c. 1.9 Ga Lake Harbour Group                  Meta Incognita and the Sugluk block is postulated
(Scott 1997; Wodicka et al. 2011b). The Sugluk               to have occurred in an intra-oceanic setting shortly
block (e.g. Corrigan et al. 2009, and references             before c. 1.9 Ga (Wodicka et al. 2011b). The Hall
therein) includes Mesoarchaean crust that crops              Peninsula block was also considered to be a part
out on SW Baffin Island and nearby islands in                of this composite block, which is referred to by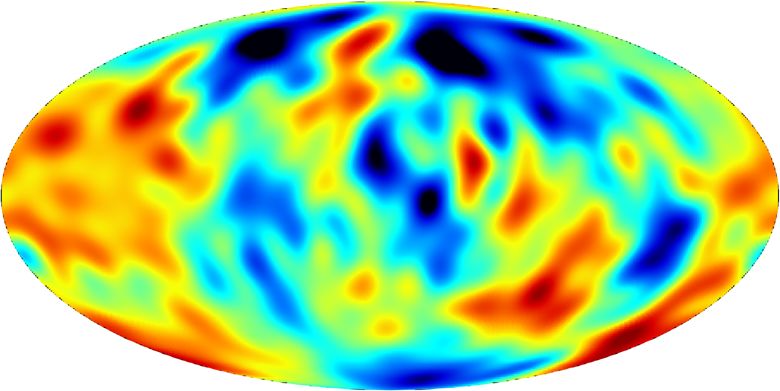
Downloaded from http://sp.lyellcollection.org/ by guest on January 3, 2021

                            THE HUDSON BAY LITHOSPHERIC EXPERIMENT

Snyder et al. (2013) as the Meta Incognita–Sugluk –     studied crustal structure using controlled source
Hall Peninsula (MISH) block. This composite             data recorded by both land and sonobuoy recorders.
block, as well as the adjacent Rae, is intruded by      Since then, several studies have mapped wave-
voluminous charnockitic rocks of the 1.865–             speeds beneath the Canadian Shield using surface
1.845 Ga Cumberland Batholith, thought to have          waves in regional to global-scale models. In
formed by deep crustal melting subsequent to litho-     general the global models use data from permanent
spheric delamination (Whalen et al. 2010).              seismograph networks, resulting in reduced resol-
Younger, c. 1.83 Ga plutons form late syn- to post-     ution beneath the Bay region; the two or three seis-
tectonic plutons across southern Baffin and South-      mograph stations contributing to the inversions
ampton Islands (e.g. St-Onge et al. 2006).              yield a limited number of surface wave paths
    The crustal blocks surrounding Hudson Bay           across the shield (e.g. Megnin & Romanowicz
region have been affected by four major tectonic/       2000; Shapiro & Ritzwoller 2002; Lebedev & van
metamorphic events between 2.56 and 1.8 Ga (see         der Hilst 2008). They indicate that Hudson Bay is
Berman et al. 2010a, for a detailed summary and         underlain by a c. 200–300 km deep fast wavespeed
metamorphic maps). The oldest event, the 2.56–          mantle keel (e.g. Lebedev & van der Hilst 2008; Li
2.50 Ga MacQuoid orogeny, affected the Chester-         et al. 2008; Nettles & Dziewonski 2008; Ritsema
field block and adjacent southeastern flank of the      et al. 2011). Continent-scale models such as those
Rae craton. The 2.5–2.3 Ga Arrowsmith orogeny           of Bedle & van der Lee (2009) and Yuan et al.
(Berman et al. 2005, 2010a; Schultz et al. 2007)        (2011) also indicate a deep-seated, fast wavespeed
affected much of the western side of the Rae craton     mantle keel beneath the Canadian Shield.
from northern Saskatchewan through Boothia Pen-             Some of the tomographic inversions take seismic
insula to northern Baffin Island (Berman et al.         anisotropy into account, but the results are variable.
2010a, 2013). The 2.0–1.9 Ga Thelon orogeny             The model of Debayle et al. (2005), for example,
(Hoffman 1988) affected the westernmost Rae             yields east–west fast anisotropic directions beneath
craton, including northern Boothia Peninsula (Ber-      the Bay region, while the model of Marone &
man et al. 2010a). The most widespread tectonic/        Romanowicz (2007) indicates NW– SE fast direc-
metamorphic reworking of the Hudson Bay region          tions in the same depth interval, rotating to NE–
occurred during the 1.9–1.8 Ga Hudsonian orogeny        SW at 300 km. Yuan et al. (2011) presented a con-
(e.g. Hoffman 1988; Berman et al. 2010b) when           tinent-scale model of seismic heterogeneity within
accretion of microcontinents to the SE flank of the     the North American craton, using joint inversions
Rae craton occurred c. 1.9–1.87 Ga. These tectonic      of long-period waveforms and SKS splitting data.
events are known collectively as the Snowbird           They found evidence for a two-layered lithosphere.
phase of the Hudsonian orogeny (Berman et al.           The 150–200 km-thick upper layer has fast polariz-
2007).                                                  ation directions correlated with trends in surface
    Proposed under-thrusting of the Superior cra-       geology, and was interpreted as the chemically
ton beneath the Churchill collage and the Cape          depleted ‘lid’ of the shield. The lower lithospheric
Smith belt was initiated by c. 1.82 Ga (St-Onge         layer, with different anisotropic characteristics,
et al. 2006). Palaeozoic events include deposition      was interpreted by Yuan et al. (2011) as a signifi-
of carbonate rocks, presently estimated to be up to     cantly younger, less-depleted thermal boundary
1.5 km thick, on crystalline basement rocks of Hud-     layer. The Yuan et al. (2011) model attributes aniso-
son Bay, western Southampton Island, and nearby         tropic fast polarization directions at asthenospheric
Coats and Mansel islands. At least five separate,       depths to anisotropic fabric development owing
potentially diamondiferous, kimberlite fields are       to absolute plate motion. This model places the
known to have erupted during the Mesozoic and           lithosphere– asthenosphere boundary (LAB) at a
Cenozoic, providing mantle xenoliths and garnet         depth of c. 200 km depth everywhere beneath the
xenocrysts that sample the mantle below the study       Bay region and throughout the entire Canadian
area (Fig. 3).                                          Shield, based on the anisotropic stratification of
                                                        the upper mantle model.
                                                            S to P receiver function studies (Rychert &
Previous seismological studies                          Shearer 2009; Abt et al. 2010; Miller & Eaton
of the Canadian Shield                                  2010; Kumar et al. 2012) provide support for an
                                                        abrupt change in seismic wavespeed at c. 80 –
The first constraints on the seismic structure of the   150 km depth across much of North America. If
Hudson Bay region were presented in the early           interpreted in the context of the two-layered litho-
1960s by Brune & Dorman (1963) using surface-           sphere hypothesis of Yuan et al. (2011) or Darby-
wave dispersion computed from two-station paths         shire et al. (2013), this feature probably represents
typically thousands of kilometres long. Hobson          a mid-lithospheric discontinuity beneath cratonic
(1967) and Ruffman & Keen (1967) subsequently           North America.
Downloaded from http://sp.lyellcollection.org/ by guest on January 3, 2021
I. D. BASTOW ET AL.
The c. 200 –260 km lithospheric thickness in Hudson Bay, to determine the reason for this intra-
central and northern Canada inferred in the sur- cratonic basin, and to understand the Precam-
face wave studies is corroborated by estimates of brian processes that shaped the central Canadian
the thermal boundary layer, as inferred from joint Shield. Four co-ordinated activities were discussed:
interpretation of surface heat flow and S-wave a network of three-component broadband stations
travel time delays (e.g. Lévy et al. 2010). Although deployed for several years, deep seismic reflec-
based on sparse data coverage, heat flow data tion profiling along 600 km profiles, ocean-bottom
from northernmost Ontario and central-northern seismometers and single-component land stations
Quebec are the lowest anywhere across the to record the large air-gun array to be used in the
Canadian Shield. The thickness of the thermal profiling. International co-ordination and funding
lithosphere beneath the Canadian Shield varies of the marine profiling has not yet been achieved,
regionally by up to c. 100 km (Artemieva 2006; but the network of three-component broadband
Lćvy et al. 2010). stations has now been completed by the Canadian
Previous studies of the mantle transition zone and UK components of HuBLE.
beneath the Canadian Shield were limited to The Geological Survey of Canada began de-
imaging the receiver-side structure using a small ploying POLARIS (Portable Observatories for
number of permanent stations located large dis- Lithospheric Analysis and Research Investigating
tances apart (Bostock 1996; Chevrot et al. 1999), Seismicity; Eaton et al. 2005) around western
geographically restricted temporary networks (Li Hudson Bay in 2004. More stations were deployed
et al. 1998) or global studies utilizing mid-point over the next three years such that 17 POLARIS
reflections from distant source –receiver combi- stations were operating west and north of Hudson
nations (e.g. Gossler & Kind 1996; Gu et al. 1998; Bay by autumn 2007. The University of Western
Flanagan & Shearer 1998; Gu & Dziewonski 2002; Ontario added four POLARIS stations in Inuit com-
Lawrence & Shearer 2006). Several of these studies munities of northern Quebec in summer 2005. An
showed that the transition zone structure was uni- additional 12 POLARIS stations were established
form across the region (less than +5 km; Bostock in northernmost Ontario, south of Hudson Bay, by
1996), yet sparse geographical coverage of receiver the Geological Survey of Canada from 2003 to
functions or lower resolution (PP and SS precur- 2005. All of the POLARIS stations use Güralp
sors) meant that it was unclear whether this pattern CMG-3ESP seismometers and Nanometrics Libra,
was true beneath large swathes of the shield. Trident or Taurus data loggers; most sites are extre-
On a more local scale, the Teleseismic mely remote, use satellite telemetry for real-time
Western-Superior Transect (TWIST; see Kendall data acquisition and are powered by solar panels
et al. 2002 for a review) experiment deployed 11 (Snyder et al. 2013).
short-period and 14 broadband seismometers along The UK component of the HuBLE project
a 600 km line in the Superior region of SW Hud- was deployed in the summer of 2007 by personnel
son Bay in May– November 1997. A further three from the University of Bristol, in collaboration
broadband stations were deployed further north on with the Geological Survey of Canada. These 10
the Hudson Bay coastline (e.g. Kay et al. 1999). stations were situated mainly around the islands of
TWIST data were used in regional seismic tomo- northern Hudson Bay, providing excellent azi-
graphic imaging of upper mantle wavespeed struc- muthal coverage around the Bay when combined
ture (Sol et al. 2002) in an SKS study of mantle with the existing POLARIS and a few permanent
anisotropy (Kay et al. 1999) and a receiver func- Canadian National Seismograph Network stations
tion study of crustal structure (Angus et al. 2009). (Fig. 3). Figure 4 shows a completed HuBLE-UK
The tomographic study did not yield evidence Natural Environment Research Council seismo-
for differences between Archaean and Protero- graph station in northern Hudson Bay. Each site
zoic mantle wavespeed. In contrast, the splitting was equipped with a Güralp CMG-3TD broadband
study revealed marked differences between the seismometer, recording at 40 samples per second
two domains, with null measurements characteriz- (sps). Güralp data collection modules were used at
ing the Proterozoic coastal areas, while moderate the stations, which were powered by up to six
to large splitting was found to parallel Archaean solar panels (providing 100–140 W power) and
Superior trends. three 100 A h deep-cycle batteries. Each remote
site was equipped with an iridium satellite modem
that provided access to state-of-health data from
The HuBLE seismograph networks the stations. Utilizing modems over the iridium
network provides pole-to-pole global coverage of
Preliminary discussions began in the early 1990s both short message and short data burst services.
concerning a Hudson Bay Lithospheric Experiment In the case of the Güralp data collection module,
designed to study crust –mantle dynamics beneath this allowed the UK base-station to access weeklyDownloaded from http://sp.lyellcollection.org/ by guest on January 3, 2021
THE HUDSON BAY LITHOSPHERIC EXPERIMENT
Fig. 4. HuBLE-UK remote station construction. 20–40 W solar panels on a steel frame re-charged 3 × 100 A h
batteries that powered the seismometer and recording equipment. The GPS antenna provided continuous accurate
timing information for our data. Twice-weekly remote communications with the stations were conducted via the
satellite modems. All field equipment were provided by Natural Environment Research Council’s seismic equipment
pool, SEIS-UK. Modified after Bastow et al. (2011a).
reports of remote-system state of health. Where HuBLE: the salient results
problems were diagnosed, low-latency two-way
communication for reconfiguration of the remote This section reviews the findings of the major
systems was also utilized via simple terminal inter- phases of HuBLE. The ‘Crustal structure’ section
action. Further details of the UK component of the presents the crustal studies of Thompson et al.
HuBLE field campaign can be found in Bastow (2010) and Pawlak et al. (2011, 2012), which
et al. (2011a). adopted receiver function and ambient noise tomo-
Nunavut, the homeland of the Inuit, is the most graphic methods to constrain fundamental par-
sparsely populated region of Canada, so centres of ameters such as crustal thickness and seismic
population and infrastructure are few and far wavespeed structure across the Bay region. The
between. Wherever possible, seismograph stations ‘Seismicity in northern Hudson Bay’ section looks
were deployed in secure compounds such as air- at seismicity in northern Hudson Bay and its impli-
ports and weather stations with mains power sup- cations for the state of crustal stress in the region.
ply. Elsewhere, vast tracts of wilderness meant that The section entitled ‘Mantle seismic anisotropy:
remote, independently powered recording sites had evidence from SKS splitting’ reviews the seismic
to be designed. Transportation to these locations anisotropy studies of Bastow et al. (2011b) and
was by chartered helicopters or light aircraft with Snyder et al. (2013), who performed shear wave
large tundra tyres that permitted landing on rela- splitting of SKS phases to study mantle anisotropy.
tively flat and well-drained glacial deposits (Fig. The ‘Surface wave tomography’ section reviews
4). Some stations shared logistics with exploration various regional surface wave studies conducted
companies by co-location at their camps. All across the Bay region (e.g. Darbyshire 2005; Dar-
HuBLE-UK stations have now been removed and, byshire & Eaton 2010; Darbyshire et al. 2013).
with the exception of a few vaults left at airports Finally, the section entitled ‘Mantle transition zone
for potential future re-occupation, no trace of the structure’ summarizes the work of Thompson et al.
stations’ existence remains at the sites. (2011), who performed a receiver function study ofDownloaded from http://sp.lyellcollection.org/ by guest on January 3, 2021
I. D. BASTOW ET AL.
the mantle transition zone with a view to improving bulk crustal composition via Poisson’s ratio (e.g.
understanding of its thermal structure. Christensen 1996). Thompson et al. (2010) carried
out such a study of crustal structure in northern
Crustal structure Hudson Bay, providing for the first time detailed
constraints on crustal architecture across the bound-
Receiver function analysis captures P- to S-wave aries between many of the tectonic subdivisions that
conversions that occur at velocity contrasts in the comprise the Canadian Shield.
crust and mantle recorded in the P-wave coda from Receiver functions from within the Palaeoarch-
distant (teleseismic) earthquakes (Fig. 5a; Langs- aean Rae domain reveal remarkably simple crust,
ton 1979; Helffrich 2006). The abrupt change in with high-amplitude, impulsive Moho conversions
wavespeed usually encountered at the Moho makes and reverberations (Fig. 5b). The crust is also seis-
receiver function analysis a particularly powerful mically transparent, with little evidence for inter-
means of studying the properties of the crust. The nal architecture. The Rae domain has the thinnest
arrival-times of P to S conversions and subsequent crust (c. 37 km; Fig. 6a) and the lowest Vp/Vs
reverberent phases from the Moho can be used to ratios (Fig. 6b; ≤1.73) in the region. More northerly
constrain bulk crustal properties: crustal thickness stations display slightly thicker crust, up to c. 42 km.
(H ) and Vp/Vs ratio (k) (Zhu & Kanamori 2000). In contrast to the Rae, the crust and Moho of the
These parameters can be related subsequently to Hearne domain crust is more complex (thus mak-
ing Hk analysis more challenging), with evidence
3-component for internal architecture (Fig. 5c). Crustal thickness
(a) seismograph within the Hearne is c. 38 km and the mean Vp/Vs
station
ratio is c. 1.76 (Fig. 6b). Uncertainties in the Thomp-
S-wave
son et al. (2010) study are of the order +2 km for
P-wave
crustal thickness, and +0.03 for Vp/Vs ratio.
Within the Palaeoproterozoic Quebec–Baffin
Crust Moho segment of the THO, bulk crustal properties are
Mantle
PpPs PsPs Pp Ps more variable than in the neighouring Archaean
+
PpSs Hearne and Rae domains. Higher Vp/Vs ratios
(b) (.1.75) are found around the Hudson Strait than
further north within Baffin Island and further west
towards NW Hudson Bay (c. 1.73: Fig. 6b). The
s
sP thickest crust (c. 43 km) underlies stations in cen-
Ps s s +P
PpP PpS tral and southern Baffin Island (Fig. 6a). Thompson
et al. (2010) also found evidence, particularly in
the northern Rae domain, for a Hales discontinuity
in the shallow lithospheric mantle at c. 60–90 km
(c)
depth (Hales 1969).
Ambient-noise tomography uses the cross-
correlation of diffuse wavefields (e.g. ambient
Ps noise, scattered coda waves) to estimate the Green’s
Diffuse Reverberations
function between pairs of seismograph stations
(e.g. Shapiro et al. 2005). This technique is a pop-
ular tool for crustal studies and was particularly
useful in the HuBLE project to glean information
-5 0 5 10 15 20 25 30
on crustal structure beneath Hudson Bay. Pawlak
time (s)
et al. (2011, 2012) used 21 months of continuous
Fig. 5. Receiver functions from the Rae and Hearne recording at 37 stations around Hudson Bay to
domains. (a) Ray diagram of phases used in the Hk measure dispersion characteristics of fundamental-
analysis. (b) Stacked receiver functions for stations in the mode Rayleigh wave group velocity. The sig-
Palaeoarchaean Rae domain. Note the similarities in nals extracted contain preferred azimuths that are
Moho Ps (a P-to-S conversion from the Moho) arrivals. indicative of stationary coastal noise sources near
(c) Stacked receiver functions for stations in the southern Alaska and Labrador. Tomographic meth-
Meso-to-Neoarchaean Hearne domain, where ods are then used to reconstruct a velocity model
significantly more variable Ps arrival times and
amplitudes are seen. The increased complexity of the
that is best resolved in areas of dense, crossing
Moho into the Hearne domain is evident particularly in path coverage.
the reverberated phases, which have lower amplitude and An important feature of the tomographic models
are much less coherent than within the Rae domain. is a prominent low-velocity region beneath Hud-
Modified after Thompson et al. (2010). son Bay (Fig. 7). At mid-crustal depths (i.e. longerDownloaded from http://sp.lyellcollection.org/ by guest on January 3, 2021
THE HUDSON BAY LITHOSPHERIC EXPERIMENT
(a) (b)
70° Rae Rae
L 70°
L
HIL GIFN
HIL GIFN
RC RC
CHU HU
NC
ILON
N ILON
ER SRLN ER SRLN
WEST
STLN
WEST
Rae
QILN STLN
Rae
QILN
MENT
BaS M
BaS
MENT
Mi eta M
cro In Mi eta
BULN co cog cro In
nti ni BULN co cog
ne ta nti ni
nt ne t a
EG
STZ NUNN SRS SRS nt
STZ
EG
NUNN
YBKN
NS
YBKN
NS
Nar Nar
saju sajua
FFI
YRTN aq A
FFI
rc YRTN qA
rc
-BA
CHSB
-BA
ARVN CHSB ARVN
60° BeS BeS 60°
EC
EC
r ne Supe
rne Supe
Hea rior
Hea
EB
rior
EB
gen en
QU
n Oro Orog
QU
udso dson
Tran
s-H s-Hu
Tran
Superior Superior
-90° -80° -70° -90° -80° -70°
32km 36km 40km 44km 48km 1.70 1.72 1.74 1.76 1.78
Fig. 6. Crustal thickness (a) and Vp/Vs ratio (b) in the Hudson Bay region determined using the method of Zhu &
Kanamori (2000). Black regions are 2.6– 2.7 Ga greenstone belts. BaS, Baffin Suture; BeS, Bergeron Suture;
SRS, Soper River Suture. Modified after Thompson et al. (2010).
Fig. 7. A comparison of anisotropic tomographic inversion result for 10 s period (left), with the lithospheric stretching
factor (b) for the Hudson Bay basin (Hanne et al. 2004). The contrast between slow wavespeeds beneath the Trans
Hudson Orogen and the neighbouring Archaean Superior craton persists to at least a 40 s period (see Pawlak et al. 2011,
figs 11 & 12). Modified after Pawlak et al. (2011, 2012).Downloaded from http://sp.lyellcollection.org/ by guest on January 3, 2021
I. D. BASTOW ET AL.
periods than shown in Fig. 7), the Pawlak et al. surface waveforms (Fig. 8: Steffen et al. 2012).
(2011) study reveals that fundamental-mode Ray- These small earthquakes, of depth 3 –17 km, have
leigh velocity within the Superior craton (3.18 + thrust-fault mechanisms, consistent with previ-
0.03 km s21) is significantly greater than the vel- ously determined focal mechanisms for this region
ocity within the Trans Hudson Orogen beneath as well as model predictions for glacial isostatic
Hudson Bay (3.10 + 0.03 km s21). Rayleigh-wave adjustment. Steffen et al. (2012) performed a stress
anisotropy inferred from azimuthal analysis of inversion using available focal mechanisms and
ambient noise (Pawlak et al. 2012) reveals an found a maximum compressive stress direction,
arcuate pattern of fast directions interpreted to be SHmax, oriented approximately NNW–SSE. This
indicative of the double-indenter geometry of the orientation is surprising, as it is rotated by about
Superior craton. At most periods, their results 908 from previous glacial isostatic adjustment
suggest a significant change in anisotropic direction model estimates, which assume a background stress
across the inferred primary suture beneath Hud- field in North American with SHmax oriented NE –
son Bay. The region of lowest velocity beneath SW. These results indicate that existing crustal
Hudson Bay (Fig. 7) corresponds remarkably well fault zones exert a strong influence on the local
with the pattern of lithospheric stretching proposed stress field.
by Hanne et al. (2004): c. 3 km of crustal thinning.
Mantle seismic anisotropy: evidence
Seismicity in northern Hudson Bay from SKS splitting
Northern Hudson Bay is a region of moderate intra- Seismic anisotropy – the directional dependence of
plate seismicity, mainly within the Boothia Uplift – seismic wavespeed – can be measured from the
Bell Arch structure (Basham et al. 1977), where waveforms of teleseismic earthquakes via analysis
earthquakes up to Mw ¼ 6.2 have been documented. of shear-wave splitting (e.g. Silver & Chan 1991).
Using data from the HuBLE network, focal mechan- When a horizontally polarized shear wave, such as
isms for five moderate earthquakes in the time SKS, enters an anisotropic medium it will split
period 2007– 2009 have been determined by fitting into two orthogonally polarized waves. Splitting
Fig. 8. Focal mechanisms for earthquakes between 2007 and 2009 and from studies that predate HuBLE (grey). Solid
black lines show faults; the dashed line shows the Phanerozoic zero edge; the dashed– dotted line shows the
Snowbird Tectonic Zone. After Steffen et al. (2012).Downloaded from http://sp.lyellcollection.org/ by guest on January 3, 2021
THE HUDSON BAY LITHOSPHERIC EXPERIMENT
can be quantified by the time delay (dt) between the the Bay, one paralleling near-surface tectonic
two shear waves, and the orientation (w) of the fast trends and an underlying fabric paralleling present-
shear wave. These splitting parameters can sub- day plate motion.
sequently be used to understand the preferential
alignment of minerals in the crust and/or mantle, Surface wave tomography
or the preferential alignment of fluid or melt (e.g.
Blackman & Kendall 1997). Many processes can Studies of fundamental-mode Rayleigh wave dis-
lead to such anisotropy, including flow of the asthe- persion were carried out for two-station paths
nosphere parallel to absolute plate motion (e.g. across the Hudson Bay region by Darbyshire &
Bokelmann & Silver 2002; Assumpção et al. Eaton (2010). The dispersion curves clearly indi-
2006), mantle flow around deep continental keels cated a thick, fast lithospheric keel beneath the
and slabs (e.g. Fouch et al. 2000; Di Leo et al. 2012), region, with phase velocities significantly greater
and a pre-existing fossil anisotropy frozen in the than those associated with global reference models.
lithosphere (e.g. Bastow et al. 2007). Bastow et al. The phase velocities were also systematically
(2011b) and Snyder et al. (2013) used shear wave higher than the Canadian Shield average (Brune &
splitting of SKS phases at HuBLE and POLARIS Dorman 1963), corroborating global tomographic
stations in the Hudson Bay region to infer patterns models that place the centre of the high-wavespeed
of seismic anisotropy in the Laurentian crust and lithospheric keel beneath Hudson Bay (e.g. Nettles
mantle (Fig. 9). & Dziewonski 2008). Each two-station disper-
In the northern part of Hudson Bay, Bastow et al. sion curve was inverted for a 1D shear wavespeed
(2011b) found no significant variation in splitting profile representing the average structure along the
parameters at most stations across the HuBLE net- inter-station path. The period ranges recovered
work. One exception was permanent station FRB from the dispersion analysis allowed for reliable
on Baffin Island, for which more than a decade models from lower-crustal depths (c. 35– 40 km)
of data were available. Here, significant back- to mantle depths of c. 300 km. Each path-averaged
azimuthal variation in w and dt was found, raising model showed a prominent high-wavespeed anom-
the possibility that complex patterns of anisotropy aly, interpreted as the lithospheric ‘lid’ in the
exist beneath the region (Fig. 10). In a parallel upper mantle.
analysis of SKS splitting, Snyder et al. (2013) pro- Different proxies for lithospheric thickness
posed that two layers of anisotropy exist beneath exist in the literature because fundamental-mode
(1s)
66° BULN QILN
APM
Baffin Island PNGN CMBN
WAGN
Rae Foxe Basin Cum
b
NUNN
Soton. Is. Bat erlan
hol d
64° SHMN ith CDKN
STZ
DORN MNGN
CRLN
Hearne SHWN
FRB
YRTN SEDN NOTN
Hud
son
62° CTSN Nottingham Is. Stra
it KIMN
IVKQ
Coats Is. MANN
Hudson Bay Mansel Is.
-95° Superior Plate
&" !
-90°
-85° -70°
-80° -75°
Fig. 9. Shear wave splitting parameters (arrows) and null results (solid lines) from HuBLE-UK and neighbouring
POLARIS stations (triangles) in northern Hudson Bay from the study of Bastow et al. (2011b). STZ, Snowbird Tectonic
Zone. Solid black lines are sutures. B.S., Baffin Suture. Inset: Back-azimuth and distance distribution of earthquakes
used in study. Concentric circles indicate 308 intervals from centre of network at 758W, 638N. APM-absolute plate
motion from the HS3-Nuvel-1A model (Gripp & Gordon 2002) in both hotspot reference frame (white APM arrow) and
no-net rotation reference frame (black APM arrow).Downloaded from http://sp.lyellcollection.org/ by guest on January 3, 2021
I. D. BASTOW ET AL.
FRB Splitting Parameters
2.0
120
(degrees)
1.5
90
t (s)
1.0
60
30 0.5
0 0.0
180 210 240 270 300 330 360 180 210 240 270 300 330 360
Back-azimuth (degrees) Back-azimuth (degrees)
Fig. 10. Shear wave splitting parameters at permanent Canadian National Seismograph Network station FRB (Fig. 9).
Back-azimuth dependence of w and dt might be the result of a dipping layer of anisotropy beneath Baffin Island.
Back-azimuthal variations in splitting parameters could also result from multiple layers of seismic anisotropy beneath
the region (e.g. Snyder et al. 2013). Modified after Bastow et al. (2011b).
surface wave models are essentially insensitive et al. (2013), solving simultaneously for isotropic
to first-order discontinuities (see e.g. Eaton et al. phase velocity heterogeneity and azimuthal aniso-
2009). In some studies, negative gradients in the tropy. The resulting phase velocity maps were sub-
models are used, although these can be difficult to sequently used as the basis for a full 3D model of
constrain. Other authors choose (somewhat arbitra- shear wave velocity and anisotropy beneath the
rily) a contour of positive Vs anomaly with respect region (Fig. 12). The model confirmed the earlier
to the global reference (e.g. PREM, ak135). The findings of a thick, fast lithospheric keel, but high-
1.5–2.0% anomaly range is commonly used (see lighted internal velocity variations and stratifica-
Darbyshire & Eaton (2010) for a more detailed dis- tion of seismic anisotropy within the cratonic
cussion). Using a proxy based on the depth to the lithosphere.
1.7% fast anomaly, the depth to the base of the litho- In the uppermost mantle, probably associated
sphere was interpreted to vary from c. 190 km with the intracratonic basin, seismic velocities
beneath the Hudson Strait area to at least 240 – immediately beneath the Bay are relatively low
280 km beneath central Hudson Bay. Within the compared with those beneath the surrounding
lithospheric lid, maximum seismic wavespeed ano- Archaean landmass, and anisotropic fast directions
malies varied from c. 4 to 7%, which is fast relative wrap around the Bay. In contrast, in the 70 –
to the global reference (Fig. 11). 160 km depth range, the model shows two high-
The lithosphere–asthenosphere boundary depth velocity cores beneath the central Superior and
variations inferred from the surface-wave analysis, Churchill cratons, separated by a near-vertical cur-
and from interpretation of previous studies in the tain of lower-velocity material. In this depth range,
Canadian Shield, indicate that the lithosphere is no large-scale coherency in anisotropic pattern is
thickest beneath central Hudson Bay (and sig- evident. In contrast, the model also images a basal
nificantly thicker than in the Superior craton to the lithospheric layer with a significantly more homo-
south). There appeared to be no spatial correla- geneous velocity structure than the mid-lithosphere.
tion between lithospheric thickness, path-averaged Anisotropy within this layer is coherent, with a
seismic wavespeed anomalies and surface ages pattern strongly reminiscent of the inferred geome-
(Archaean v. Proterozoic). This result is similar to try of the THO structure (Darbyshire et al. 2013).
interpretations of the Fennoscandian (Bruneton
et al. 2004) and Australian (Simons et al. 1999; Mantle transition zone structure
Fishwick et al. 2005) lithosphere, but contrasts
with systematic changes in lithospheric thickness The seismic discontinuities observed at depths of c.
between Archaean and Proterozoic domains in 410 and 660 km define the mantle transition zone
central Asia (Lebedev et al. 2009) and southern (TZ), and are commonly attributed to phase tran-
Africa (Li & Burke 2006). sitions in the olivine system (olivine to wadsleyite,
The dispersion curves from a total of 172 inter- the ‘410’, and ringwoodite to perovskite + mag-
station paths across the Hudson Bay region were nesiowüstite, the ‘660’, respectively; Bina &
combined in a tomographic inversion by Darbyshire Wood 1987; Helffrich 2000; Ita & Stixrude 1992).Downloaded from http://sp.lyellcollection.org/ by guest on January 3, 2021
THE HUDSON BAY LITHOSPHERIC EXPERIMENT
3.0 3.5 4.0 4.5 5.0 3.0 3.5 4.0 4.5 5.0 3.0 3.5 4.0 4.5 5.0
0 0
50 50
100 100
Depth (km)
Depth (km)
150 150
200 200
250 250
300 300
350 FRB−STLN ILON−IVKQ KASO−SEDN 350
0
50
70˚
100
Depth (km)
ILON
STLN
150 FRB
SEDN
IVKQ
60˚
200
250 SNQN
KASO
300 -100 VIMO
˚ -95 0˚ -65˚
˚ -90˚ -85˚ -80˚ -75˚ -7
350 ILON−SNQN STLN−VIMO
3.0 3.5 4.0 4.5 5.0 3.0 3.5 4.0 4.5 5.0
Shear wave velocity (km s–1)
Fig. 11. One-dimensional shear wave velocity profiles for selected paths across Hudson Bay derived from surface
wave dispersion. Grey lines are individual model solutions in the Monte-Carlo modelling scheme; the mean
and 1 standard deviation bounds of the ensemble are solid black and dotted black lines, respectively. The black
dashed line is the ak135 global reference model. Inset: inter-station paths and station names. Modified after
Darbyshire & Eaton (2010).
Described by their Clapeyron slopes, the ‘410’ and A new relative arrival-time upper
‘660’ will vary in depth if temperature conditions mantle tomographic model for northern
are varied. The opposite Clapeyron slopes of these
discontinuities result in a thickened transition zone Hudson Bay
in cold regions; hot regions will act to thin it (e.g. Overview
Helffrich 2000). By analysing the nature of tran-
sition zone seismic discontinuities using receiver Using teleseismic data recorded by HuBLE and sur-
function analysis, Thompson et al. (2011) explored rounding POLARIS seismograph stations since
the thermal and chemical state of the mantle beneath 2007 a new study of P-wave mantle velocity struc-
the Hudson Bay region. ture using least-squares tomographic inversion of
Thompson et al. (2011) showed that, beneath relative arrival-times is presented using the method
a significant portion of cratonic North America, of VanDecar et al. (1995). Body wave tomographic
the TZ seismic discontinuities are unperturbed methods such as this benefit from particularly good
compared with the global mean, with the impli- lateral resolution of velocity anomalies. The study
cation that there is no seismically detectable ther- thus presents an excellent opportunity to examine
mal variation at TZ depths beneath one of the whether variations in seismic wavespeed exist
deepest and most laterally extensive continental between Phanerozoic and Archaean mantle juxta-
keels on the planet (Fig. 13). posed during the THO. This study, which samplesDownloaded from http://sp.lyellcollection.org/ by guest on January 3, 2021
I. D. BASTOW ET AL.
Fig. 12. (a) Depth slices through the anisotropic surface-wave tomographic model of Darbyshire et al. (2013). The
colour scale represents the percentage deviation of shear wavespeed from the iasp91 global reference model and
the pale yellow bars indicate the direction and relative strength of azimuthal anisotropy across the region. The arrow
on the colour scale shows the 1.7% positive wavespeed anomaly used as a proxy for the base of the seismological
lithosphere (‘LAB’). (b) Cross-section through profile A– A′ of the tomographic model. The black dashed line shows the
inferred depth to the ‘LAB’ proxy. (c) Lithospheric thickness across the Hudson Bay region inferred from the
tomographic model, using the 1.7% ‘LAB’ proxy.
only Precambrian geology, is particularly valuable Method of relative arrival-time
because most studies of cratons using the method determination
include data from stations deployed within youn-
ger (Phanerozoic) terranes. In Tanzania, for exam- Manual picking of the first arriving P-wave phase
ple, the high wavespeed Tanzania craton contrasts identifiable across the seismograph network was
with the neighbouring East African Rift (Ritsema performed on waveforms that were filtered with a
et al. 1998). In SE Canada, the high wavespeed zero-phase two-pole Butterworth filter with corner
Superior craton contrasts with lower wavespeeds frequencies 0.4–2 Hz. Subsequently, phase arrivals
associated with the Phanerozoic Great Meteor and relative arrival-time residuals were more accu-
Hotspot and Appalachian terranes (e.g. Eaton & rately determined using the multi-channel cross-
Frederiksen 2007; Frederiksen et al. 2007; Ville- correlation technique (MCCC) of VanDecar &
maire et al. 2012). In contrast, the major anomalies Crosson (1990); we selected a 3 s window contain-
illuminated in this study will probably be older ing the initial phase arrival and typically one or
than c. 1.8 Ga. After presenting the results of this two cycles of P-wave energy to cross-correlate.
new tomographic study, these new constraints are The chosen bandwidth is similar to that used in
discussed in light of other tomographic studies in other teleseismic tomographic studies in both tec-
the region that used complementary methods such tonically active (e.g. Bastow et al. 2008) and
as surface wave dispersion (e.g. Darbyshire & shield (e.g. Frederiksen et al. 2007) regions. The
Eaton 2010). filter bandwidth is designed to retain as high aDownloaded from http://sp.lyellcollection.org/ by guest on January 3, 2021
THE HUDSON BAY LITHOSPHERIC EXPERIMENT
frequency as possible since our inversion procedure where ti is the relative arrival time for each station i;
adopts ray theory (the infinite frequency approxi- tei is the expected travel time based on the IASP91
mation). All waveforms with cross-correlation coef- travel time tables (Kennett & Engdahl 1991) for
ficients ,0.85 were eliminated from the analysis. the ith station; and te is the mean of the IASP91 pre-
The MCCC method also provides a means of dicted travel times associated with that particular
quantifying the standard error associated with each event. The final travel time dataset comprises 3682
arrival time. In this study relative arrival times P-wave travel times (Fig. 14).
determined in this way have mean standard devi-
ation of 0.02 s. In line with other studies using the Analysis of travel-time residuals
MCCC method (Tilmann et al. 2001; Bastow et al.
2005), we regard the MCCC-derived estimates of International Seismological Catalogue travel-time
timing uncertainty as optimistic. data for permanent station FRB (Fig. 15) in Iqa-
Relative arrival-time residuals tRES for each luit, Baffin Island (Fig. 3) show that the mean
station are given by: absolute delay time with respect to the IASP91
travel-time tables for P-wave arrivals is amongst
tRESi = ti − (tei − te ), (1) the earliest of all permanent stations; mantle seismic
wave-speeds beneath FRB are therefore amongst
the fastest worldwide (Poupinet 1979). All P-wave
80˚ A’ velocity anomalies shown in this tomographic
(a) study should thus be considered markedly fast com-
B B’ pared with normal mantle, with red low-velocity
60˚ regions slower and blue high-velocity regions
faster than the background mean of the shield, not
the global average.
40˚
A
Model parameterization and inversion
−140˚ −120˚ −100˚ −80˚ −60˚ −40˚ procedure
Upper mantle wavespeed structure is imaged using
(b) A Latitude A′ regularized, least-squares inversion of Canadian
35 40 45 50 55 60 65 70 75 80
100
relative arrival-time residuals following the method
200 LAB
of VanDecar et al. (1995). The parameterization
Depth (km)
300
400
500
600
700
800
(c) B Longitude B′
−130 −120 −110 −100 −90 −80 −70 −60
100
200
LAB
Depth (km)
300
400
500
600
700
800
Fig. 13. (a) The orientation of two receiver function
transects plotted in (b) and (c). (b) A north– south
transect through 788W showing the 1.0 Hz migrated
data (S40RTS corrected). The dashed black line is the
+1.75% contour, sometimes chosen as a proxy for Fig. 14. Back-azimuth and distance distribution of
lithospheric thickness (Fig. 2b). (c) Corresponding earthquakes used in study. Concentric circles indicate
east–west transect showing same data as the 308 intervals from centre of network at 758W,
north– south transect. Modified after Thompson 638N. Dark grey dots are direct P-arrivals; white dots are
et al. (2011). core phases (e.g. PKP).Downloaded from http://sp.lyellcollection.org/ by guest on January 3, 2021
I. D. BASTOW ET AL.
Fast Wavespeed Mantle Slow Wavespeed Mantle
KAR KHC KHO LVV MBO MES PRU SIA
RCD RMP SSC TAN
MNY NRR SAO TCF TUC VOU WIN
KON KRV NIL ORV RBA SEO SOP VLS
15
MCC MNL SLC TOO WDC
WES
VLA
WLS
RSL VAL VKA TNP
PUL SES SIC SHL WIL
ORT
TAS
VIC
PRK
TAM
NVL PRE ROC STJ
Number of Stations
SIM
10
LUB
STU
TIR
PAS
SPA
MSH STR TEH TIF ZAG
PVL ROM SFF SRI TFO
JER KAT LPO UCC VIS
KBL RES SFA
SDB
ISK
PTO
RBZ
LOR
MAW
VRI
SCB
EBL
MOX
LAO
LON
KRA
GRC
MAK
UBO
LWI
PRS
VIE
SPO
WRS YAK
SHI
YKC
WSC
ZAK
SOC
Hudson
Bay
NTI
CNG
MIN
GMA
LBF
IST
COP
JAS
TUM
LPF
LSF
TAU
SOF
MOO UNM
SRO STC TRR WIT
SUD
GIL
OBN
TUL
WMO
PAL
NP-
NEW
SAM
HAL
PYA
NHA
CHG
LPS
ESK
KEW
HAU
UZH
CHC
ISO
TNS
LAR
LMR
PRA
SNG
TAB TAC UKI
TRO
DAR ELT KLG MEK OUL
OTT
SKA
SOD
FCC
LPA
SVE
SCH
LHN
SNA
MIR
MED
IAS
EIL
PNT
KLS NAO NDI UME WRA
5
MOY
BRG
LJU
CBM
HLW
FRI
SSF
CDF
IFR
SPF
KOD
LAN
PHC
MNV
LNS
MHC
HAM
SLD
MDC
TRI
MBT
MUN
POO
FAV
KRR
SLM
MNT
LAH
SCP
LND
SYO
KRK
HLE
EBH
PNS
MDR
BMO
GLP
BUT
HEE
FLN
SKO
BNH
FRU
FUR
GRS
JOS
NIE
MMA
TOL
DAC
LFF
CRC
SBA
LSM
CHT COR FHC KRL
NOR
LHC
SEM
LAW
NUR
DRV
FFC
MBC
KEV
KER
MOS
KIS
OUE
ILT
GEO
DSH
PLG
HHM
BLA
CLE
BUH
DMK
FGU
GRR
BES
CAN
FSJ
FRE
DUG
KSA
LRG
MRG
BKS
KAS
BUD
DBN
LIS
SIT
PRZ
RIV
LIC
MHT
KIR
GOT
KJN
KNA
CAR
CTA
KUL
GAR
IRK
GDH
JCT
PEK
GBA
EGL
CLL
EDU
EAU
BDB
CIN
BRA
BNS
EKA
CHA
BAC
BRW
BAS
DUR
DOU
EUR
EBR
GRF
BCN
ERZ
BEO
BMM
HKC
SAV
LHA
BRK
NAI VHM
PLV SEA
AAE BAK
MTN
KIC
CNN
FLO
FAY
HFS
HYB
BOM
COL
ATH
BUL
INK
CSC
EDM
LPB
EDI
DDI
CIR
EAB
AIA
CMC
ALM
AVE
ADE
BER
BSF
BYR
ANR
ALO
ALB
BYI
BUC
DEV
ASH
GOL
AAB
ANK
ALI
ARH
GCA
PRI
BOG
AOU
FOC
LUX
WRM
CAL
FBC
ATL
BNG
BLC
ROL
UPP
GWC
DBQ
APA
CPO
CMC
ALE
BOD
ASM
BRS
CLK
BOZ
BHA
BAN
AAM
BUB
BAB
BFD
FRB
TIK
-1.5 -1.0 -0.5 0.0 0.5 1.0 1.5 2.0
P-wave Travel-Time Anomaly (s)
Fig. 15. P-Wave travel-time delays for permanent seismograph stations. Note the extremely early arrivals at station
FRB in Iqaluit. Modified after Poupinet (1979).
scheme consists of 23 knots in depth between 0 unknowns than observations), even in the absence
and 1800 km, 50 knots in latitude between 50 and of errors, a unique solution cannot be found. A
788N and 85 knots in longitude between 46 and model is therefore chosen that contains the least
1148W: a total of 97 750 knots parameterizing amount of structure necessary to satisfy the arrival-
slowness. Knot spacing is 35 km in the innermost time data (e.g. Constable et al. 1987).
resolvable parts (58–718N, 63–1008W, 0– 350 km By investigating the trade-off between the root
depth). Outside this region, knot spacing increases mean square (RMS) residual reduction (the percen-
to 50 km between 350 and 500 km, to 100 km tage difference between the initial and final RMS
between 500 –1000 km, and then to 200 km at misfit to the travel-time equations) and RMS model
1800 km depth. Structural interpretations are thus roughness, a preferred model is selected that fits the
limited to features of spatial wavelength ≥70 km data well but does not account for more relative
in the upper part of the model. arrival-time residual reduction than can be justified
The parameterization scheme continues out- by the a priori estimation of data noise levels. All
side the area of interest so that an unwarranted and models in this study account for 95% (from 0.384
spurious structure is not mapped into the region to 0.02 s) of the RMS of the relative arrival-time
where structural interpretations will be made: an residuals. Estimates of RMS timing uncertainty
Occam’s Razor approach (VanDecar et al. 1995). (0.02 s) are thus treated as optimistic bounds when
In the regularized least-squares inversion procedure, fitting the data. Subtracting the station terms from
slowness perturbations, source terms and station the delay times reduces the RMS of the relative
terms are determined simultaneously (VanDecar arrival-time residuals from 0.384 to 0.369 s; these
et al. 1995). The source terms are free parameters corrected residuals reflect more accurately the pro-
used in the inversion procedure to account for portion of the delay-time anomalies that will be
small variations in back-azimuth and incidence mapped into the region of the model where tectonic
angle caused by distant heterogeneities and source interpretations are drawn.
mis-locations. The station terms account for travel-
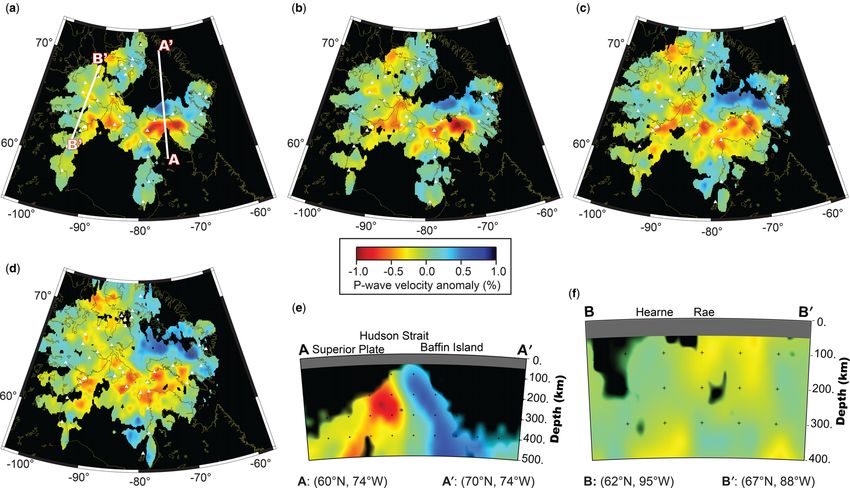
time anomalies associated with the region directly Resolution
beneath the station where the lack of crossing rays
prevents the resolution of crustal structure. Since The resolving power of the inversion technique in
the inverse problem is under-determined (more this study is assessed by analysing the ability ofYou can also read