THE IMPACT OF GLOBAL RECESSION ON THE SOUTH EAST EUROPE AIRLINE INDUSTRY
←
→
Page content transcription
If your browser does not render page correctly, please read the page content below
Božičević A., Tatalović M., Kalanj Z.
THE IMPACT OF GLOBAL RECESSION ON THE SOUTH EAST EUROPE AIRLINE INDUSTRY

    THE IMPACT OF GLOBAL RECESSION ON THE SOUTH
            EAST EUROPE AIRLINE INDUSTRY
                                          Božičević Ana
                                       University of Zagreb
                           Faculty of Transport and Traffic Engineering
                              Vukelićeva 4, 10000 – Zagreb, Croatia
                                          anab@fp-z.hr

                                        Tatalović Mirko
                                         Kalanj Zvonka
                                         Croatia Airlines
                                Bani 75b, 10000 – Zagreb, Croatia
                mirko.tatalovic@croatiaairlines.hr zvonka.kalanj@croatiaairlines.hr

ABSTRACT

       The airline industry is susceptible on global changes which results in instability of
revenue and costs trajectories. The air transport sector has undergone a major crisis after the
events of September 11th 2001 when passenger traffic number first fell sharply and then
stagnated afterwards. After 2003 airline industry recovered, until the first part of 2005 when
fuel prices have soared and caused another shock for a system. Although, airlines are one of
the main players taking part in the global growth and the ones that to a largest extent stimulate
employment, economic benefits, trade expansion, leisure travel and social interactions, in
2008/2009 the global recession caused weakening demand for air travel. Result was that
airline industry ended up with net loss of almost US$28 billion in last two years. Airlines are
in the constant struggle for market share, and in some cases survival which results in
decreasing capacity followed by decreased number of employees.
       This paper treats different levels of recession effects on South East Europe air transport
system as well as Croatian airline industry as a part of the European air transport network.
Effect of recession on air traffic control results, traffic results of airports and airlines of the
SEE region are followed by the actual global recession affect on the Croatian airline industry.

1      INTRODUCTION

       Air transport is still one of the world‟s most important industries, driving economic and
social progress. The global economic income of aviation industry is estimated to 7.5% of the
world Gross Domestic Product. Through the evolution of air transportation at worldwide level
it is visible how economic prosperity can bring along greater demand for mobility and with it
an increased willingness for air travel. As a result, world economy is now increasingly
dependent on air travel. Development in airport capacities at worldwide level is stipulated by
tourism and business travel, supporting millions of jobs in both developed and developing
countries. Recent economic crisis had a very bad impact on the air transport as whole and on
the airline industry especially, which caused waking demand followed by reducing capacity
and finally reducing employment.
       Paper also intends to provide background on a number of crucial aspects explaining the
impact of the economic crisis on the world, EU and finally South East Europe air transport
sector. The current impact of the economic crisis on European, South East European and
Croatian airline industry in terms of passenger transport will be analysed, by using a set of

                                                                                                 1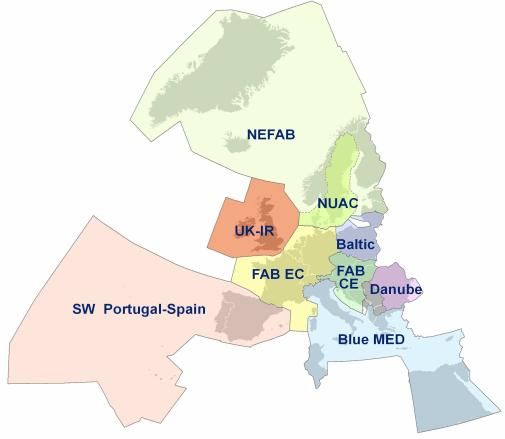
Božičević A., Tatalović M., Kalanj Z.
THE IMPACT OF GLOBAL RECESSION ON THE SOUTH EAST EUROPE AIRLINE INDUSTRY

key indicators such as traffic and capacity data, micro- and macroeconomic data, and
employment figures. Inclusively some possible scenarios are given, including technological
improvements in the air transport sector, for the mid-term development in South East Europe
Airline industry in relation to possible developments of the general economic situation.

2       STATE OF THE AIR TRANSPORT INDUSTRY

      In the year 2009, airlines safely flew 2.2 billion passengers and 35 million tonnes of
cargo, equal to 35% of the value of goods traded internationally which is 8% of global
GDP.[1] For 2007, the net profit was US$12.9 billion (2.5% margin) and operating profit was
US$19.7 billion. The industry net loss for 2008 was US$16.8 billion Drop of passenger
carried and particularly the cargo traffic (-13%), witnessed the drop in demand during the year
2009 as a result of heavy turbulences on the global market. World trade is suffering with a
15% downturn depressing economies everywhere. [2]

                        Figure 1: Capacity changes and regional profitability

       The air transport industry generates a total of 32 million jobs globally, through direct,
indirect, induced and catalytic impacts. Direct jobs represent 5.5 million employees, 4.7
million airline and airport industry, 0.8 million of aircraft systems manufacturers, frames and
engines. Indirect jobs represent 6.3 million employees through purchases of goods and
services in its supply chain. Induced jobs represent 2.9 million through spending by industry
employees. Jobs through air transport‟s catalytic impact on tourism represent 17.1 million
people. [3] Economic recession and its impacts caused increasing number of unemployment.
In Europe in 2009 airlines dismissed more than 21,000 employees1. In addition other
rationalisation and labour cost savings like reduced working hours, pay freezes, unpaid hours
of work have been introduced2. [4]
       Bankruptcies and takeovers used to be rare in the air transport sector during the era of
the so-called flag-carriers. More recently, however, such events have become more common
and have had a significant impact on the market function and competition. By way of
illustration, table provides an overview of recent bankruptcies, mergers and takeovers in the
European airlines sector (data of September 2009).

1
 Airlines - AF/KLM, SAS, Aer Lingus, XL Airways, Dalavia, Aeroflot, Austrian Airlines
2
 Lufthansa, British Airways, Finnair, Blue 1, Virgin, Air India, Cathay Pacific, Japan Airlines (Harvey, 2009:
7– 11)

                                                                                                                 2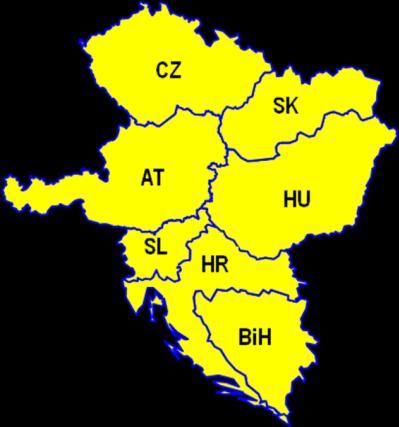
Božičević A., Tatalović M., Kalanj Z.
THE IMPACT OF GLOBAL RECESSION ON THE SOUTH EAST EUROPE AIRLINE INDUSTRY
Table 1: Recent bankruptcies, mergers and takeovers in the European airlines sector [5]
DATE AIRLINE COUNTRY OPS EVENT
STARTED
17-Jan-09 FlyLAL Lithuania 1938 Bankruptcy
19-Jan-09 Apatas Air Lithuania 1994 Bankruptcy
24-jan-09 Nordic Airways Sweden 2006 Bankruptcy
27-Apr-09 Air Sylhet United Kingdom 2007 Bankruptcy
01-May-09 LTU Int Airways Germany 1955 Merged into Air Berlin
01-May-09 ThomsonFly United Kingdom 2004 Became Thomson Airways
01-May-09 First Choice Airways United Kingdom 1987 Became Thomson Airways
06-May-09 Open Skies United Kingdom 2007 Transferred to Elysair
09-Jul-09 ClickAir Spain 2006 Merged into Vueling
24-Jul-09 MyAir Italy 2004 Bankruptcy
01-Sept-09 SkyEurope Slovakia 2002 Bankruptcy
Current regulatory framework surrounding the ATM system in Europe is highly
inefficient and opaque which has negative consequence on airline business performance.
Inflating prices of ATM equipment, to the detriment of airspace users who ultimately
bear the cost. Significant differences between European ANSPs3 in terms of efficiency and
productivity result in unit rates throughout Europe ranging from some 15 to almost 80
Euro in 2008. The cost of ATM in Europe continues to grow, currently exceeding 7
billion Euro per annum. With falls of up to 20 per cent in revenues in Europe, ANSPs face
an unprecedented financial crisis. Moreover, it has been claimed that ANSPs are currently
operating with insufficient, making reduction in headcount difficult if not impossible.
The Civil Air Navigation Services Organisation (CANSO) claims that ANSPs have
responded to the crisis by:
Reducing discretionary expenses
Negotiating concessions with suppliers
Reviewing level of service, without impacting safety
Deferring or reducing capital spending
Extending depreciation/amortisation periods
Considering financial restructuring and debt financing
Finding new sources of revenue
Freezing salaries and wages
Reducing over-time and vacation leave
Reducing use of out-sourced/external staff
Optimising rosters and shift planning
Reviewing training programs, without impacting capacity
Adjusting retirement ages
Converting pension funding to defined contribution [6]
Global passenger traffic dropped to 4.4 billion, the number of international passengers
was down 4.2% to 1.8 billion and total aircraft movements fell 5.5% to 63.9 million in 2009.
Through the first two months of 2010, global traffic rose 6.1% to 472.3 million passengers.
International passenger numbers soared 7.5% to 216.7 million and domestic traffic increased
1.2% to 250.8 million. The overall passenger traffic at European airports for 2009 decreased
by -5.9% compared to 2008 in addition. 86% of airports lost traffic in 2009. [7]
The growth in demand in the developing regions such as South East Europe often
exceeds the economic growth rates of wealthier countries. Airline alliances are curving up the
3
ANSP – Air navigation Service Provider
3Božičević A., Tatalović M., Kalanj Z.
THE IMPACT OF GLOBAL RECESSION ON THE SOUTH EAST EUROPE AIRLINE INDUSTRY
global marketplace and carriers from lesser developed countries can face difficulties in
competing routes outside their own borders.
3 AIR TRANSPORT MARKET IN SOUTH EAST EUROPE
Countries in the region over the last twenty years have passed violently through a period
marked by war events, and transition processes. Relative political stability has created the
conditions of faster economic growth within the region in the last five years. Due to recession
trends macroeconomic forecasts are changing very often in the direction average annual
growing rates. Year 2009 was obviously very critical.
Table 2: GDP Growth Rates 2006 – 2014 [8]
Country 2006 2007 2008 2009 2010 2014
Albania 5.5% 6.3% 6.8% 0.4% 2.0% 6.0%
Bosnia & Herzegovina 6.9% 6.8% 5.5% -3.0% 0.5% 4.5%
Bulgaria 6.3% 6.2% 6.0% -2.0% -1.0% 5.0%
Croatia 4.7% 5.5% 2.4% -3.5% 0.3% 4.0%
FYR Macedonia 4.0% 5.9% 5.0% -2.0% 1.0% 2.0%
Montenegro 8.6% 10.7% 7.5% -2.7% -2.0% 4.0%
Moldova 4.8% 4.0% 7.2% -3.4% 0.0% 5.0%
Romania 7.9% 6.2% 7.1% -4.1% 0.0% 4.1%
Serbia 5.2% 6.9% 5.4% -2.0% 0.0% 5.5%
Slovenia 5.9% 6.8% 3.5% -2.7% 1.4% 3.5%
Southeast Europe region is a modest, undeveloped region, which represents only 1.3%
passenger transportation in the world scheduled traffic and 1% of the number of international
airports in the world. Excluding two biggest and developed countries Greece and Turkey it
can be emphasized that Croatia, Slovenia, Bulgaria and Romania have the most developed air
transport in the region. At the same time the domestic scheduled air transport exists only in
three region states (Croatia, Romania and Bulgaria). The crisis that affected whole air
transport industry as well as big commercial airlines has transposed to the SEE region also.
[9] It is not visible from the data of air control achievements in the last two years (table 3).
Table 3: Total number of flights of selected SEE countries measured by Air traffic control
[10]
COUNTRY 2009 2008 Growth rate 2009/2008
1 Slovenia 310 788 324 353 -4,2%
2 Romania 430 888 440 889 -2,3%
3 Croatia 420 613 424 487 -0,9%
4 Bulgaria 474 463 474 970 -0,1%
5 FYROM 124 424 124 436 0,0%
6 Albania 160 586 147 268 9,0%
7 Bosnia and Herzegovina 222 364 215 477 3,2%
8 Serbia-Montenegro 511 008 494 229 3,4%
Total 2 655 134 2 646109 + 0,3 %
The reduced number of passengers is recorded on SEE airports as well as SEE airlines
struggle with losses imposed by the global economic crisis. While connections with main
European destinations are dominant and all the leading European air carriers are already
operating in the region, presently only 10% of all the SEE airlines‟ commercial activity is
realized within the SEE network. [11]
4Božičević A., Tatalović M., Kalanj Z.
THE IMPACT OF GLOBAL RECESSION ON THE SOUTH EAST EUROPE AIRLINE INDUSTRY
Table 4: Number of passengers on primary airports in South East Europe region
PASSENGERS
AIRPORT INDEX
2009 2008 2007 09/07 INDEX 09/08
1 Bucharest OTP 4 483 661 5 064 230 4 978 587 90 89
2 Sofia 3 314 164 3 230 696 2 746 178 121 103
3 Belgrade 2 384 077 2 650 048 2 512 890 95 90
4 Zagreb 2 062 242 2 192 453 1 992 445 104 94
5 Burgas 1 704 634 1 936 853 1 949 198 87 88
6 Bucharest BBU 2 005 694 1 768 000 928 220 216 113
7 Ljubljana 1 434 000 1 673 079 1 524 028 94 86
8 Varna 1 220 181 1 450 192 1 493 267 82 84
9 Tirana 1 394 688 1 267 041 1 107 325 126 110
10 Split 1 115 099 1 203 778 1 190 551 94 93
11 Dubrovnik 1 122 355 1 191 474 1 142 168 98 94
12 Priština 1 191 978 1 130 640 990 259 120 105
13 Timisoara 956 897 957 000 836 518 114 100
14 Chisinau 808 000 847 900 688 800 117 95
15 Cluj 834 400 753 000 390 521 214 111
16 Skopje 599 000 652 339 626 644 96 92
17 Tivat 532 156 568 083 574 011 93 94
18 Sarajevo 530 391 506 398 505 269 105 105
19 Podgorica 450 508 541 030 460 020 98 83
TOTAL 28 144 125 29 584 234 26 636899 106 95
Therefore, connections between the individual capitals and major cities of the SEE are
underdeveloped which represents a barrier for fast and convenient travel and the opportunity
to unleash potential demand which will lead them out of the crisis.
During the year 2009 number of passengers on primary airports in South East Europe
region4 fall by 5 % compared to previous year. Traffic volume ranges from 450 508
passengers in Podgorica up to 5,064,230 passengers in Bucharest OTP. Traffic statistics for
the carriers of SEE belonging to the Association of European Airlines (AEA- Olympic
Airways, Adria Airways, JAT, Croatia Airlines and Tarom) reveal that passenger numbers
fell average by 9% in 2009, which is an about 1 mill passenger less. Turkish Airlines is the
only one who had increased of passenger number, about 3 mill more compared to the year
2008 (12.3%) and JAT had the highest passenger numbers drop by 18 %.
The crisis came before the airline industry could recover from the fuel price hike and
there is prediction the industry would not see any significant signs of recovery in 2010. An
added deterrent for passengers in Europe is the recent wide scale outbreak of the H1N1 virus.
Also in airlines of SEE financial results in 2009 are poor. Average of carriers AEA is -18,7
mil €5, Croatia Airlines has -27 €, Adria Airways -11€, JAT -15 €, Tarom -22 €, Olympic
Airways expected a huge loss because of only 58.5 % passenger load factor, but Turkish
Airlines is prosperous in financial results + 278,1 million €.
Other airlines in SEE which are not members of the AEA are not doing any better. BH
airlines, had 11.9 % increase of passengers number, but they expect loss, because of hefty
decrease of load factor. Montenegro Airlines flew 527,000 passengers, up to 4.6 % from the
year earlier, but financial loss is -3 mill €. Air Moldova is stagnating in passengers‟ number
4
More than 500 000 passengers per annum
5
More than 500,000 passengers per annum
5Božičević A., Tatalović M., Kalanj Z.
THE IMPACT OF GLOBAL RECESSION ON THE SOUTH EAST EUROPE AIRLINE INDUSTRY
like a year before. Albania Airlines is in lost as well, but traffic has been boosted by the
arrival of Belle Air, low-cost airline. Bulgaria Air group expected financial loss and one of
the reasons are low-cost carriers‟ competition in Bulgaria. MAT Macedonian Airlines is no
longer flying and Kosovo Airlines does not exist.
4 STATE OF THE AIRLINE INDUSTRY IN CROATIA
According to economic theory, air transport growth rates are in high correlation with the
adequate GDP increase. There is an economic model starting from GDP vs. traffic demand of
passengers equals approximately 1:2. [12] From that fact it was realistic to expect high
decrease of air transport indicators in the business year 2009 since GDP dropped for 5,8%
Indeed, recent statistic indicators are showing decrease of -12 % in term of passengers carried
performed by the Croatian air carriers.
The achievement of Croatia Airlines was much better (-6%) compared to Croatian
charter competitors Dubrovnik Airline, Trade Air which dropped for 34 %. Croatian airports
recorded also decrease in turns of passengers carried (-6, 6%), aircrafts movements (-3,5%)
and freight carried (-3,3% ) compared to the year 2008. [13]
Table 5: Passengers (000) in Croatia according traffic category and business model
INDEX INDEX
PAX 2003 % 2008 % 2009 %
09/03 09/08
Domestic
471 19.1 543 11.5 492 11.1 104 91
scheduled
International
0 0.0 1.127 24.0 1.169 26.4 - 104
sched. LCC
International
325 13.2 700 14.9 666 15.1 205 95
sched. FSNC6
International
796 32.3 1.209 25.7 1.188 26.9 149 98
sched. OU
Charter int.
573 23.3 738 15.7 654 14.8 114 89
carrier
Charter dom.
296 12.0 387 8.2 253 5.7 85 65
carrier
Total
2.461 100.0 4.704 100.00 4.422 100.00 180 94
all carriers
OU total 1.468 1.869 1.750 119 94
OU stake in
59.7% 39.7 % 39.6 %
total
During the year 2003, air carriers on Croatian air traffic market carried 2.46 million of
passengers and share of Croatia airlines was almost 60 %. In the year 2009 that share dropped
to 40 % with average annual growing rate in the period 2004-2009 of 87 %. In the year 2003
transport score of LCC was zero.
Table 6: Dynamic of competitors‟ growth on Croatian air transport market
COMPETITION CA LEGACY CARRIERS LCC
PERIOD
AAGR 7 AAGR AAGR AAGR
1996 - 2003 2% 10 % 2% -
2003 - 2009 33 % 7% 13 % 87 %
1996 - 2009 16 % 9% 7% -
6
FSNC - Full Service Network Carrier
7
AAGR – Average Annual Growing Rate
6Božičević A., Tatalović M., Kalanj Z.
THE IMPACT OF GLOBAL RECESSION ON THE SOUTH EAST EUROPE AIRLINE INDUSTRY
Competition structure completely changed by intense arrival of LCCs to the Croatian air
traffic market, and the number of competitors doubled in the first decade. The year 2009
recorded decrease of passengers carried for the first time in the decade. Out of 30 air
companies operating international scheduled traffic during summer season of 2008/2009, half
of them are seasonal, while the rest of them fly during the whole year, part of them with
reduced frequency.
5 AIRLINE COSTS REDUCTION IN SOUTH EAST EUROPE BY FAB
IMPLEMENTATATION
Europe‟s airlines first formally proposed the „Single European Sky‟ concept to the
European Commission in the mid-1990s but it was not until around a decade later that the EC8
embraced it. Many states have been determined to maintain sovereign control of their airspace
and SES9 implementation has been, and still is, a painfully slow progress devoid of any real
sense of urgency despite the EC‟s efforts. Meanwhile airlines have been compelled to fly
excessive route distances caused by the uncoordinated evolution of the European airspace and
the need to meet military requirements. The introduction of Functional Airspace Blocks, the
SESAR project10 and other SES measures ought ultimately to improve the overall efficiency
of the system.
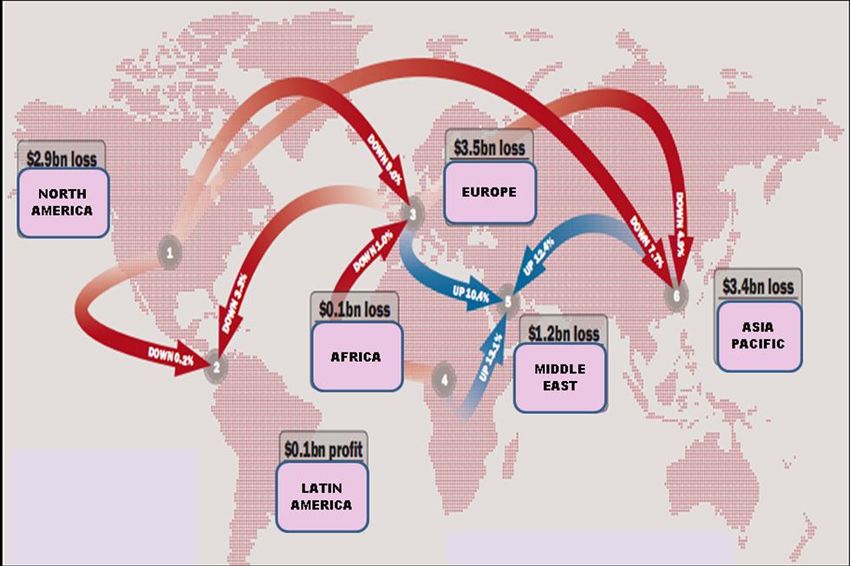
The size of the existing FAB initiatives varies significantly. The geographical scope
covers the 27 EU States as well as Croatia, Norway, Switzerland, Serbia and Montenegro,
FYROM and Albania. FABs that comprise South East European states are FAB CE, FAB
Danube and Blue Med FAB. FAB CE is a joint initiative of seven States and ANSPs from
Central and South East European area. Participating States are Austria, Bosnia &
Herzegovina, Croatia, Czech Republic, Hungary, Slovakia and Slovenia. Danube FAB
comprise, as observers or associated members, Bulgaria and Romania, while Blue Med FAB
associates in addition to European states non-EU States, such as Egypt and Tunisia, which are
important interfaces of the SES.
Figure 2: FABs in Europe Figure 3: FAB CE
Due to a wide range of approaches and quality in cost-benefit Analyses, it is not easy to
assess and compare the magnitude, timing and robustness of expected improvements from
FAB initiatives. In FABs - FAB EC, FAB CE and Blue Med are currently visible significant
differences between operational concepts which is a potential cause of delay in effective
8
EC – European Commission
9
SES – Single European Sky
10
Single European Sky ATM Research
7Božičević A., Tatalović M., Kalanj Z.
THE IMPACT OF GLOBAL RECESSION ON THE SOUTH EAST EUROPE AIRLINE INDUSTRY
implementation. But the largest relative benefits are identified for FAB CE and the Danube
FAB.
Table 7: Summary of quantified benefits from available Cost Benefit Analysis
2013 2013 benefits % from 2018 2018 benefits % from
benefits as % of 2006 flight benefits as % of 2006 flight
in M€ total economic efficiency in M€ total economic efficiency
costs or delay costs or delay
Blue Med 14 – 49 1 – 5% 14 – 71 2 – 7%
Danube 29 – 52 12 – 22% 99% 29 – 52 12 – 22% 99%
FAB CE 6 1% 53% 21 – 30 4 – 6% 55%
Due to the current crisis airline industry is unlikely to see a full recovery until 2013, but
it is needed to look at capacity now to be ready for a new upturn in traffic when it comes. The
environmental benefits from these efficiencies could amount to annual fuel burn reductions of
265.000 tons by 2013. Cost efficiencies are also needed urgently. Furthermore, the average
unit cost of flying is 70% higher in the EU than in the US so an improved performance-based,
system-wide approach is necessity.
In the short-to-medium term, the progressive implementation of FABs is probably the
most significant tool to help airlines to achieve cost savings, customer benefits and revenue
enhancements.
6 CONCLUSION
The global economic recession pushed airline industry to the bottom. The erosion of
yields, accelerated by the loss of business traffic and lower levels of consumer spending on
leisure travel will not recover in short term period. At the moment (2010), liquidity and cash
flow management become the most important subjects of the different airline projects. Banks
are still not able to finance business, while US$1 trillion is still needed to re-capitalize.
Airlines need to reduce debt and that means less cash to spend. With stronger economic
growth in 2010 and oil price forecast to US$75 a barrel. Airlines will continue to create a
losses (IATA prediction for 2010 is approximately 5 billion USD). Unsustainable is business
model in which all participants in the value chain operate profitably (Airports, Global
Distribution Systems Providers, Air Traffic Control, Manufacturers..) except those who
directly perform air transport service of passenger and cargo. It is necessary to restructure the
entire value chain of air transport industry calling for action at all levels of professional
associations, institutional organisations as well as economic and political support at the global
level.
From the point of view of single airline, most important task is to optimise business
model which respects competition, cooperation and sustainable development. One of the
threats to the recovery of the industry is also video conferencing which is now a stronger
competitor.
The opportunity to raise number of frequencies and passengers on regional airports is
through making connection to the world biggest hubs. Government regulations, labour
contract provisions, and financial agreements as well as insurance restrictions of the financial
community prevent management from achieving the benefits.
New air links within the SEE region could considerably improve mobility and
accelerate economic integration and cooperation processes. Specific Croatia Airlines items
additionally affecting its business are: seasonality, average flight distance, price elasticity,
living standard in Croatia and interest burden.
8Božičević A., Tatalović M., Kalanj Z.
THE IMPACT OF GLOBAL RECESSION ON THE SOUTH EAST EUROPE AIRLINE INDUSTRY
REFERENCES
1. Bisignani, G. IATA, 15 September 2009
2. Netherlands Bureau for Economic Policy Analysis (CBP)
3. I. Mišetić , M. Tatalović, J. Bajić, "Airlines odysse in the first decade of a century
Croatia airlines challenges", proceedings from the 5th International Conferrence “An
Enterprice Odyssy”, Opatija, 2010
4. G. Harvey, P. Turnbull, "The impact of financial crisis on labour in the civil aviation
Industry", Final report, Sectoral Activities Programme, 2009
5. R. Macario, E. Van de Voorde: "The impact of the Economic crisis on the EU air
transport sector", European parliament, Directorate General for internal Policies,
2009
6. A. Kuile, "Economics & Charges the ANSP perspective", Informal briefing to the
ICAO Council l2 May 2009 Secretary Genera
7. B. Straus ACI, " Second-half rebound helps limit recession's impact on global
Traffic" April 2010
8. IMF World Economic Outlook, April, 2009
9. S.Steiner, M.Tatalović, J.Bajić, "Competition and cooperation on European
Southeast air transport market", Seventh international conference Economic
integrations, competition and cooperation, Opatija, 2009
10. European Organisation for the Safety of Air Navigation, Central Route Charges
Office Report on the Operation of the Route Charges System in 2008
11. I. Mišetić, M. Tatalović, J. Bajić, "Public Service Obligation Model on European
Southeast Air Transport Market, Proceedings from the Third International
Conference: Regional Cooperation and Economic Integration, Skopje, 2009.pag 261.
12. V. Kandžija, A. Kumar , A., "50 Years of European Union", I. Mišetić,
I.MalovićBeganović, "Croatian Air Traffic Market in Light of Actual Economic
Integration Processes", Rijeka 2008. pag. 320
13. Republic of Croatia, Central Bureau of Statistics, Report no 5.1.5/4, Zagreb,
February 2010, page 1
14. Eurocontrol, 2nd FAB Central Europe (FAB CE) Stakeholders and 2nd SD Workshop
Conclusions and Minutes, 25th November 2009
9You can also read