The impact of green space on heat and air pollution in urban communities: A meta-narrative systematic review
←
→
Page content transcription
If your browser does not render page correctly, please read the page content below
The impact of green space on heat and air
pollution in urban communities:
A meta-narrative systematic review

MARCH 2015
THE IMPACT OF GREEN SPACE ON HEAT AND AIR POLLUTION IN
URBAN COMMUNITIES: A META-NARRATIVE SYSTEMATIC REVIEW

March 2015

By Tara Zupancic, MPH, Director, Habitus Research
Claire Westmacott, Research Coordinator
Mike Bulthuis, Senior Research Associate

Cover photos: centre by Jonathan (Flickr user IceNineJon) courtesy Flickr/
Creative Commons, background by Jeffery Young.

This report was made possible with the support of
the Friends of the Greenbelt Foundation.

Download this free literature review at davidsuzuki.org

2211 West 4th Avenue, Suite 219
Vancouver, BC V6K 4S2
T: 604-732-4228
E: contact@davidsuzuki.og
Photo: Yけんたま/
                                                                                                                                                                                     KENTAMA,
                                                                                                                                                                                     courtesy Flickr/CC

CONTENTS

Executive summary ...................................................................................................................................................4
Introduction ................................................................................................................................................................ 5
Review purpose .......................................................................................................................................................... 6
Background: heat, air quality, green space and health .................................................................................. 7
Method ........................................................................................................................................................................ 11
Findings ...................................................................................................................................................................... 14
Summary of findings .............................................................................................................................................. 41
Recommendations ..................................................................................................................................................43
Areas for future research .....................................................................................................................................45
Review limitations .................................................................................................................................................. 46
Acknowledgements ............................................................................................................................................... 46

Appendix A: Works cited ......................................................................................................................................47
Appendix B: Studies reviewed ............................................................................................................................ 54
Appendix C: Data extraction form ......................................................................................................................61
Appendix D: Climate classifications ................................................................................................................. 64
Appendix E: Key terms and definitions .............................................................................................................65
EXECUTIVE SUMMARY

    It is widely understood that urban green spaces have a natural ability to filter pollution from the air and
    reduce local air and ground temperature. This report analyzed 102 peer-reviewed studies published
    over the past five years that explored the role of urban green space in providing cooling effects and
    reducing air pollution.

    Not surprisingly, the report found that urban green spaces — from trees and parkettes to green
    roofs and large natural spaces — generally provide significant health benefits for residents and the
    community. It also found that these ecological benefits are directly related to the size, quality and
    density of the green space.

    Why is it important to reduce urban heat effects and air pollution? It is estimated that tens of
    thousands of Canadians die prematurely each year due to acute air pollution and that high summer
    temperatures lead to increased illnesses, hospitalizations and deaths, especially among older adults.
    As the Canadian population ages and extreme heat waves become more common across the country,
    urban green spaces can provide essential, natural protection.

    This report examined various types and scales of green space, and generally found that urban green
    space can provide cooler, cleaner air at the site, neighbourhood and city level. Emerging evidence also
    suggests that closely spaced and connected smaller green spaces can provide greater cooling effects
    to adjacent urban areas than large individual parks with open grass areas.

    It found that the density and spatial configuration of an urban forest — the sum of all urban trees,
    shrubs, lawns and pervious soils located in an urban setting — clearly affect land surface temperatures
    in the city and that these elements are critical for improving urban air quality. In general, the research
    suggests that balancing urban forest density, particularly in areas with low green space density, would
    greatly improve both local and city-wide urban air quality.

    Various plant species provide heat and pollution-mitigating capacities, and compact multi-layering
    of diverse plant species can help improve overall resiliency to drought, heat and pollution. Among
    plant types, trees have an exceptional ability to capture and filter multiple air pollutants, including
    ground-level ozone, sulphur dioxide, nitrogen oxides and particulate matter. Trees are also significantly
    associated with improved thermal comfort and relief from heat stress at the street level and
    neighbourhood scale, particularly during hot seasons and times of day.

    The report also highlighted growing evidence of disproportionate heat- and air-pollution-related
    health burdens associated with unequal distribution of green space in urban neighbourhoods. Further
    investigation is needed regarding the prevalence of green space-related health inequalities, considering
    evidence in Canada that dense, low-income inner-city neighbourhoods are generally more vulnerable.

    The report concludes with recommendations that include improving the quantity, quality and
    connectivity of green spaces; prioritizing green strategies for vulnerable urban areas; and integrating
    greening policies with broader health and land-use planning policies.

PAGE 4   THE IMPACT OF GREEN SPACE ON HEAT AND AIR POLLUTION IN URBAN COMMUNITIES
INTRODUCTION

Cities are amazing places. More than half the world’s people live, work, rest and play in urban
communities, and it is estimated that by the year 2030, three out of five people will call a city home
(Fuller & Gaston, 2009; Smith & Guarnizo, 2009). In Canada, we are ahead of the curve. More than
81 per cent of us (over 27 million) live in urban areas. Between 2001 and 2006 the populations of
Canada’s six largest cities grew by almost eight per cent (Statistics Canada, 2011).

While cities bring us together, their rapid and unprecedented growth has also brought serious
challenges, including environmental degradation, loss of natural habitat and species diversity, and
increased human health risks associated with heat, noise, pollution and crowding. That means most
children are growing up in environments with increasing pollution, intense heat and less access to
diverse green spaces (Alberti & Marzluff, 2004; Cohen, Potcher & Matzarakis, 2012; Girardet, 1996;
Gregg, Jones & Dawson, 2003; Grimm et al., 2008; Hough, 2004; Moore, Gould & Keary, 2003;
Newman & Jennings, 2008). Given these challenges, there is a critical need to find ways to reduce
health risks and maximize opportunities for well-being in all urban communities.

In response to this need, the David Suzuki Foundation has undertaken a systematic review of the
evidence to understand how green spaces can help to reduce heat, improve air quality and support
healthy livable urban communities. This report was commissioned by the David Suzuki Foundation in
collaboration with the EcoHealth Ontario Research Working Group.

                                                                                                            Photo: Young Sok
                                                                                                            Yun, courtesy
                                                                                                            Flickr/CC

                                                                          THE DAVID SUZUKI FOUNDATION    PAGE 5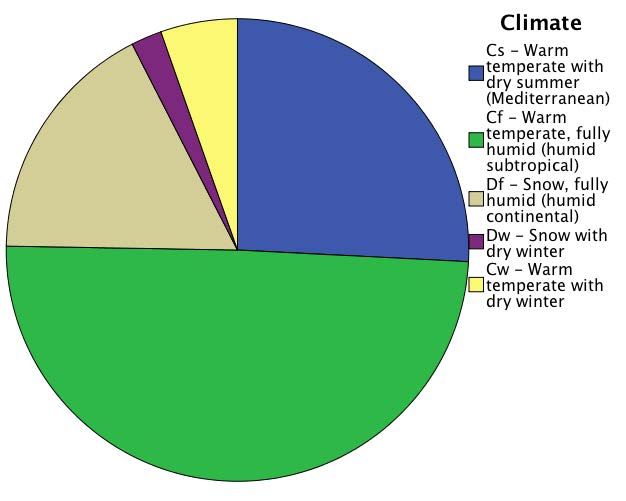
REVIEW PURPOSE

    We know urban green spaces such as parks and urban forests can help reduce heat and improve air
    quality. Recent systematic reviews have assessed a range of evidence to understand the benefits and
    value of urban trees, urban parks and the overall effectiveness of green space to reduce heat, ozone
    and ultraviolet (UV) radiation in urban areas (see Roy, Byrne & Pickering, 2012; Konijnendijk et al, 2013
    and Bowler, Buyung-Ali, Knight & Pullin, 2010). Trees and plants have a varying capacity to capture
    and/or filter air pollution, improve air circulation and decrease ambient temperatures. Despite this, the
    vast array of study topics, methods, green space types and examined plant species make it difficult to
    determine the application of the evidence base in decision-making about community green space and
    health.

    A synthesis of the evidence to better understand how different, types, scales and characteristics of
    urban greening can influnce heat and air polltuion, at both local and city-wide scales, is needed. This
    meta-narrative systemic review has been designed to respond to this need. The aim is to systematically
    identify and synthesize evidence on the specific green space settings and conditions that influence heat
    and air quality to answer the question:

    What is the evidence that green space can support health in urban communities by reducing heat and air
    pollution?

    To answer this question, several question sets were developed to explore specific green space settings
    and conditions that influence heat and air quality (see Table 1). This approach will help to clarify and
    address gaps identified in previous systematic reviews including the optimal amount, distribution and
    types of vegetation; differential impacts of green space scales; and, direct health impacts associated
    with reductions in heat and air pollution from greening (Bowler et al., 2010; Roy et al., 2012). The goal
    is to examine the state of the evidence, identify research gaps and make recommendations in support
    of healthy communities.

     Table 1. Question sets to explore urban green space characteristics associated with heat and air pollution

     1. Green space type and scale: What types of green space are associated with heat and air pollution
        mitigation (e.g., small green roof, large park, urban forest)? What studies, if any, compare different green
        space scales? What scales of impact have been documented (e.g., effect within green space area, effect
        on adjacent non-green areas, effect on entire city or region)?
     2. Vegetation type: What specific types of vegetation are associated with heat and air pollution mitigation
        (e.g., plant types)? What studies, if any, compare the effect of different vegetation types?
     3. Vegetation characteristics: What specific vegetation characteristics have been associated with heat
        and air pollution mitigation (e.g., vegetation density)? Do any studies compare the effect of different
        vegetation characteristics?
     4. Modifying factors: What factors can modify the relationship between green space and heat or air quality
        (e.g., wind, season, time of day, surrounding infrastructure)?
     5. Negative impacts: What, if any, negative impacts or trade-offs associated with green space are identified
        in the evidence base (e.g., BVOC exposure, reduced visibility near roadways)?
     6. Health relevance: What health benefits have been directly associated with observed mitigation of heat or
        air pollution from green space?

PAGE 6    THE IMPACT OF GREEN SPACE ON HEAT AND AIR POLLUTION IN URBAN COMMUNITIES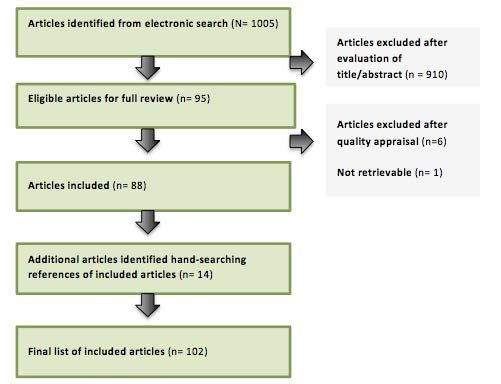
BACKGROUND: HEAT, AIR QUALITY, GREEN SPACE AND HEALTH

HEAT AND HEALTH
Heat can be a killer. Data from around the world consistently show an association between increased
daily temperatures and increased counts of deaths, illnesses and hospitalizations (Vutcovici, Goldberg
& Valois, 2013). Older adults are particularly vulnerable. Heat-related health impacts (HRI) range from
mild symptoms of fatigue and heatstroke to the worsening of preexisting illnesses, hypotension and
death (Bernardo, Crane & Veenema, 2006; Bouchama & Knochel, 2002; Semenza, 1999; Simon, 1993).

A systematic review showed that increases in heat-related morbidity is positively associated with a
growing aging population (Hajat & Kosatky, 2010). During the 2003 European heat wave, the majority
of the estimated 40,000 extra deaths from extreme heat were among older adults (García-Herrera
et al., 2010). The results from a review of 15 European cities showed that even though Mediterranean
and North-Continental countries use different empiric thresholds to define a heat wave, they observed
similar results for the 65- to 74-year-old populations across countries and strong and consistent
temperature-mortality associations for those above the age of 75 (Oudin Åström, Bertil & Joacim
2011). Older adults are also more vulnerable due to social isolation (Hajat & Kosatky, 2010).

Living in an urban centre increases vulnerability to heat exposure. A review on heat-mortality
relationships in cities found that in almost half of the locations studied, the risk of mortality increased
between one percent and three per cent for every 1°C change in high temperature (Hajat & Kosatky,
2010). Urban settings experience higher temperatures than rural areas due a lack of vegetation,
properties of urban materials that have a greater thermal storage capacity, geometry of urban areas,
release of waste heat (e.g., from vehicles and buildings) and a city’s size (Hajat & Kosatky, 2010).
This is known as the urban heat island (UHI) effect. UHIs raise nighttime temperatures, leading to
greater heat stress and limited relief from high temperatures (Kunkel et al., 1996; Harlan et al., 2006).
As urban populations grow, the impact of the UHI effect becomes more dangerous. Globally, higher
population densities were found to correlate with higher temperatures and greater thermal discomfort,
particularly in low-income settings where there is the least economic capacity to adapt in the face of
increasing extreme heat events (Hajat & Kosatky, 2010; Harlan, Brazel & Prashad, 2006).

In Canada, the number of seniors is expected to double by 2033 from about five million to 10 million
(medium-growth scenario) with at least 75 per cent burdened by a chronic health condition (Sheets
& Gallagher, 2013). A Toronto-based study found that, on average, for every one-degree C increase in
maximum temperature, there was a 29 per cent increase in ambulance response calls for HRI (Bassil
et al., 2010). For every one-degree increase in mean temperature, there was a 32 per cent increase in
ambulance response calls for HRI (Bassil et al., 2010).

With a rapidly aging population and most Canadians living in cities, strategies to provide relief from
heat and heat stress are important.

                                                                           THE DAVID SUZUKI FOUNDATION   PAGE 7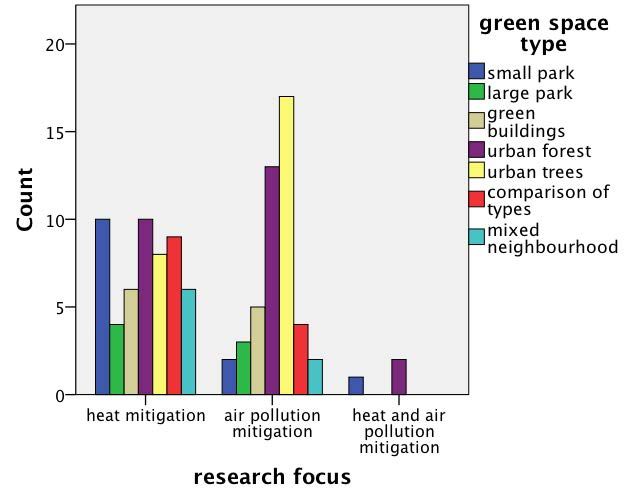
AIR QUALITY AND HEALTH
    Air pollution is a complex soup of chemicals and molecules that most of us breathe daily. By volume,
    infants and children breathe far more air than adults. For example, a resting infant breathes in twice as
    much air as an adult. This means they are more exposed to local air pollutants during a period when
    their lungs are going through vulnerable stages of development (Landrigan et al., 1998). Excess air
    pollution can lead to airway inflammation and reduced lung function and can worsen health problems
    such as asthma, chronic obstructive pulmonary disease and cardiovascular disease (Shah & Balkhair,
    2011).

    Common air pollutants include particulate matter (PM), sulphur dioxide (SO2), ground-level ozone
    (O3), nitrogen dioxide (NO2) and carbon monoxide (CO). In 2005, 89 per cent of the world’s
    population lived in areas where the World Health Organization Air Quality Guideline was exceeded
    (Brauer et al., 2012). Different air pollutants have different adverse health effects.

    Coarse particulate matter (PM10) is emitted from residential heating sources and power plants,
    whereas fine PM2.5 comes from cars, utilities and wood burning (Shah & Balkhair, 2011). The World
    Health Organization estimates that PM contributes to approximately 800,000 premature deaths
    each year and 6.4 million lost years of healthy life in cities (Brauer, et al., 2012). The European Study of
    Cohorts for Air Pollution Effects (ESCAPE) review is the first multicentre study on the effects of long-
    term exposure to air pollution and mortality, and covers a study population of over 300,000 people
    in nine European countries. Most, but not all, studies showed statistically significant associations
    between PM2.5 and PM10 and all-cause or natural-cause mortality. PM2.5 was the pollutant most
    consistently associated with natural-cause mortality in the study (Beelen et al., 2014). Analysis also
    found that for every increase of five micrograms per cubic metre of PM2.5 pollution, the risk of lung
    cancer rose by 18 per cent, and for every increase of 10 micrograms per cubic metre in PM10 pollution,
    the risk increased by 22 per cent. The analysis did not find a threshold below which there was no risk
    (Raaschou-Nielsen et al., 2013)

    A systematic review found exposure to sulphur dioxide (S02) was associated with pre-term births,
    while exposure to PM2.5 is associated with low birth weights, pre-term births and small for gestational
    age births. Ozone exposure may also have negative effects on birth weight and neurodevelopment, but
    its direct effect on pregnancy outcomes is unclear (Shah & Balkhair, 2011).

    Canadian studies have reported significant associations between chronic exposure to traffic-related air
    pollution (specifically NO2) and an increased risk of ischemic heart disease (IHD) (Beckerman et al.,
    2012). Associations between ambient air pollution (nitrogen dioxide, sulphur dioxide, carbon monoxide
    and particulate matter with a diameter of 10 micrometres or less) and respiratory hospitalization,
    particularly for females up to age 14, have also been reported in Canada, as well as significant
    associations between exposures to elevated levels of air pollutants and increased resting blood
    pressure and lower ventilatory function (Luginaah et al., 2005; Cakmak et al., 2011).

    In Canada, about 10 million people (32 per cent of the population) live in areas where they are exposed
    to traffic-related air pollution (Brauer, Reynolds & Hystad, 2013). Approximately 54 per cent of the
    Canadian population lives within 500 metres of a major road or highway, leading to a high prevalence

PAGE 8   THE IMPACT OF GREEN SPACE ON HEAT AND AIR POLLUTION IN URBAN COMMUNITIES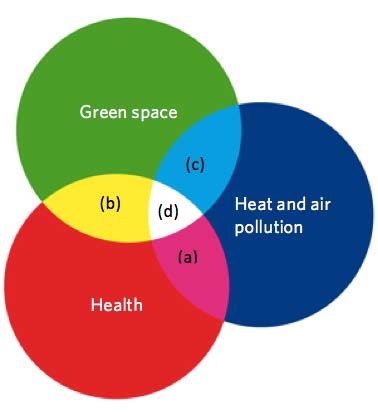
of exposure (Brauer et al., 2013). Estimates suggest approximately 21,000 premature deaths are
related to air pollution in Canada each year (Brauer et al., 2013).

According to a 2008 report by Canadian Medical Association, the number of premature deaths
associated with chronic exposure to air pollution is expected to rise 83 per cent between 2008 and
2031 (an estimated 90,000 deaths from the acute effects of air pollution and an estimated 710,000
deaths due to long-term exposure to air pollution), with Quebec and Ontario bearing the largest
proportion of acute premature deaths (Canadian Medical Association, 2008).

Strategies to reduce local air pollution and improve air quality are important to the health of urban
communities.

UNDERSTANDING THE ROLE OF GREEN SPACE IN PROTECTING HEALTHY COMMUNTIES
As summarized, strong evidence documents the harmful health effects of extreme heat and air
pollution. A large and growing evidence base also shows how green space can help to reduce heat and
combat air pollution in urban settings. A comprehensive systematic review by Bowler et al. in 2010
assessed the effectiveness of greening strategies to reduce exposure to urban heat islands, ground-
level ozone, volatile organic compounds (VOCs) and nitrogen oxides (NOx). They assessed 212 studies
published up to the year 2009. They found that on average the daytime air temperature of parks were
an estimated 1◦C cooler than built-up (non-green) urban areas (Bowler et al., 2010). Overall, the review
found that greening interventions might be effective to help mitigate urban heat islands and improve air
quality but that evaluation of biogenic VOC emissions from certain plants (a precursor to ground-level
ozone) should be included in greening strategies.

Bowler et al. (2010) also identified a number of gaps in the literature, which include a lack of data on
the direct health effects of green space as a result of its influence on heat or air quality, a lack of studies
on the impact of greening on human heat stress or thermal comfort, a lack of studies on the impact of
urban green space on nearby non-green areas, and lack of data on the optimal size, distribution and
characteristics of green space.
Figure 1 depicts a basic conceptual overview of the evidence base on green space, heat, air quality
and health. Strong evidence on the relationship between heat and air pollution and health has been
documented (label a). There is also a large and growing evidence base on the relationship between
green space and health in general (label b) (see systematic reviews by Lachowycz & Jones, 2011, and
Lee & Maheswaran, 2011). Evidence on the influence of green space on heat and air pollution mitigation
is extensive and broad, but there is a gap in understanding of how specific settings and green space
characteristics can maximize these benefits (label c). Lastly, studies that examine the relationship of all
three spheres together (i.e., health benefits that have been directly associated with observed mitigation
of heat or air pollution from green space) are lacking (label d).
This review focuses on evidence published since the Bowler et al. systematic review and explores the
state of recent evidence in addressing gaps c and d of figure 1.

                                                                             THE DAVID SUZUKI FOUNDATION     PAGE 9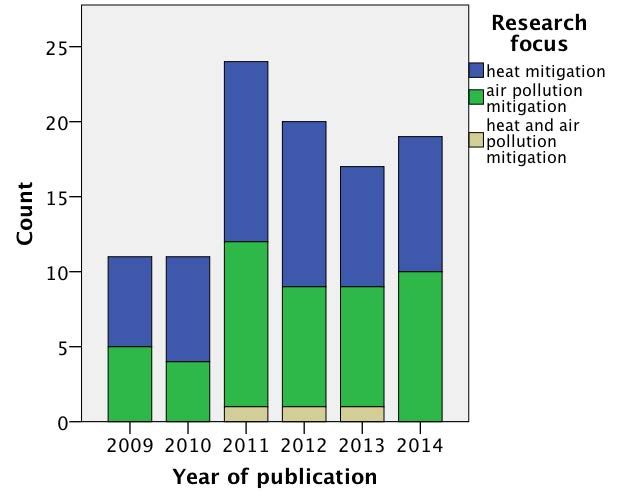
Figure 1. The data gap: understanding the evidence base on green space, heat, air quality and health
    (a) Strong evidence base on the relationship between heat and health and air pollution and health; (b) Large and
    growing evidence base on the relationship between green space and health in general; (c) Growing evidence
    base on the relationship between green space heat and air quality but gaps regarding the specific settings and
    greening characteristics to maximize benefits; (d) Data gap: documented health impacts as a result of greening
    strategies that reduce urban heat and air pollution.

PAGE 10   THE IMPACT OF GREEN SPACE ON HEAT AND AIR POLLUTION IN URBAN COMMUNITIES
METHOD
A meta-narrative systematic review was used to synthesize evidence on urban green space, heat and
air quality. The review method is designed to support complex policy decisions, where the evidence
base includes many different disciplines and study designs (Barnett-Page & Thomas, 2009). This
review process is ideal when there is a need to examine a range of methods for studying an issue (as
opposed to a single intervention), interpret and create an account of different streams of evidence
and create an overarching meta-summary of the findings (see Gough, Thomas & Oliver, 2012). The
approach is well-suited to evidence reviews on human health and the environment, where there is
typically a complex, diverse and interdisciplinary evidence base (see Greenhalgh et al. 2005).
Six standard review stages were completed to identify and consolidate the broad evidence base on
urban green space, heat and air quality (see Wong et al., 2013):
1) scoping (July 2014)
2) systematic database searching (final database search completed October 21, 2014)
3) article appraisal and quality assessment (October 2014)
4) data extraction (November 2014)
5) data analysis and synthesis (November 2014)
6) integration and results reporting (December 2014 to January 2015)
Landmark papers and systematic reviews identified by members of the EcoHealth Ontario Research
Working Group were explored to develop the search protocol. (See Table 2 for list of scoping papers
and Table 3 for search protocol.) The electronic database search was limited to studies published
between 2009 and October 2014 (since the publication of the review by Bowler et al., 2010).
Studies in climates relevant to Canada were included in the review. For example, studies from warm-
temperate climates are relevant to summer condition in many Canadian provinces. Using the Köppen
Climate Classification System, studies from locations in Warm Temperate Climates (type C), Snow
Climates (type D) and Polar Climates (Type E) were included in the review (Kottek et al., 2006).
Studies from Equatorial Climates (Type A) and Arid Climates (Type B) were excluded. (See appendix D
for glossary of climate classifications.)
The electronic database search returned 1,005 unique articles. Two reviewers independently appraised
the articles, by title and abstract, and rejected articles that failed to meet the inclusion criteria.
Disputed articles were rejected. The full text of 95 accepted articles was retrieved and appraised for
meeting the quality criteria. The reference lists of 88 accepted articles were hand searched to identify
an additional 14 relevant studies. A total of 102 studies were accepted into the review. (See Figure 2 for
demonstration of selection process.)
Two reviewers independently applied a standard data-extraction form to 20 per cent of the articles to
test inter-rater reliability. Data extraction was then completed for all remaining studies.1 Variables such
as date, city, climate, green space type and method for each article were recorded using the statistical
software program (SPSS), and each article’s findings, limitations and implications were also explored
1 Raw inter-rater concordance (the degree of agreement between reviewers) averaged 93 per cent, with a range of 89.4 per
cent to 100 per cent across variables.
THE DAVID SUZUKI FOUNDATION PAGE 11and documented. The contribution of each study to each of the question sets was examined and a
synthesis of findings was completed and summarized in a narrative report.
Table 2. Reviews and studies examined during scoping phase
Bowler, D., Buyung-Ali, L., Knight, T., & Pullin, A. S. (2010). How effective is “greening” of urban areas in reducing
human exposure to ground level ozone concentrations, UV exposure and the “urban heat island effect”. Environmental
Evidence: www. Environmental evidence.org/SR41. Html
Depietri, Y., Renaud, F. G., & Kallis, G. (2012). Heat waves and floods in urban areas: a policy-oriented review of
ecosystem services. Sustainability science, 7(1), 95-107
Escobedo, F. J., Kroeger, T., & Wagner, J. E. (2011). Urban forests and pollution mitigation: analyzing ecosystem
services and disservices. Environmental Pollution, 159(8), 2078-2087
Haase, D., Larondelle, N., Andersson, E., Artmann, M., Borgström, S., Breuste, J., ... & Elmqvist, T. (2014). A
quantitative review of urban ecosystem service assessments: Concepts, models, and implementation. Ambio, 43(4),
413-433
Konijnendijk, C. C., Annerstedt, M., Nielsen, A. B., & Maruthaveeran, S. (2013). Benefits of urban parks: a systematic
review. A report for IPFRA. IFPRA
Nowak, D.J., Hirabayashi S., Bodine A, Greenfield, E., (2014) Tree and forest effects on air quality and human health
in the United States. Environmental Pollution 193 119e129
Rowe, D. B. (2011). Green roofs as a means of pollution abatement. Environmental Pollution, 159(8), 2100-2110
Roy, S., Byrne, J., & Pickering, C. (2012). A systematic quantitative review of urban tree benefits, costs, and
assessment methods across cities in different climatic zones. Urban Forestry & Urban Greening, 11(4), 351-363.
Figure 2. Demonstration of article selection process and results
PAGE 12 THE IMPACT OF GREEN SPACE ON HEAT AND AIR POLLUTION IN URBAN COMMUNITIESTable 3. Search protocol and selection criteria
Inclusion Peer-reviewed empirical studies on the relationship between (a) urban green space
criteria and air quality or (b) urban green space and heat that are;
· Published between the years 2009 and 2014;
· Set in a “Moist Subtropical Mid-Latitude Climates” (type C) or a “Moist Continental
Mid-latitude Climates” (type D) or a “Polar Climate” (Type E) according to the Köppen
Climate Classification System (Kottek et al. 2006).
Exclusion · Non-empirical studies (theoretical or narrative articles that do not present original
criteria empirical data);
· Papers written in languages other than English or French;
· Studies focusing on green space in a rural context;
· Studies reporting the impact of green space on direct health outcomes (physical, mental
or social health of individuals or populations) with no original data on air pollution or
heat mitigation;
· Papers published before the year 2009;
· Studies from Equatorial (Tropical) Climates (Type A) and Arid Climates (Dry) (Type B)
according to the Köppen Climate Classification System (Kottek et al. 2006).
Key words green space OR park* OR garden* OR field* OR green trail OR living wall OR green roof* OR
green corridor OR vegetation OR tree* OR woods OR forest* OR green wall OR plant* OR urban
forest OR meadow OR ecosystem service OR naturalized area OR grass OR open space OR
urban greening OR urban cool island
AND
heat OR urban heat island OR heat wave OR temperature OR heat mitigation OR air quality OR
air pollution OR volatile organic compounds OR biogenic volatile organic compounds OR nitrogen
dioxide OR particulate matter OR carbon monoxide OR criteria pollutants OR ozone OR sulfur
dioxide OR heavy metal
AND
urban OR peri-urban OR suburban OR city OR town
Electronic GreenFILE @ EBSCO; PubMed; Ecology Abstracts @ProQuest; Environment Abstracts@
databases ProQuest; Plant Science@ProQuest, Pollution Abstracts@ProQuest; Sustainability Science
(n= 11) Abstracts@ProQuest, TOXLINE@ProQuest; MEDLINE @ OVID; Embase@OVID; Google Scholar
Quality This review draws on diverse studies, methods and disciplines. As a result, no single set of
criteria quality criteria could be applied, since each study would have to be assessed in its particular
research tradition (see Wong et al, 2013). Articles were appraised and accepted if they met the
three following quality criteria (see Hannes, 2011, Cochrane Collaboration Qualitative Methods
Group):
· Credibility: evidence of outside auditors or participants validating findings, such as peer
debriefing or independent analysis of data by more than one researcher;
· Transferability: details of the study context, to enable reviewers to evaluate which target
groups or context the study covers; and,
· Dependability: clear documentation of methods with third-party validation or peer
review.
THE DAVID SUZUKI FOUNDATION PAGE 13FINDINGS
OVERVIEW OF STUDIES
There is considerable research interest regarding the influence of urban green space on heat and air
quality. Database searches identified 102 relevant peer-reviewed studies published between 2009 and
October 2014. Figure 3 shows the annual distribution of studies by research topic. It shows an even
distribution among studies focused on heat mitigation (52 per cent) and air pollution mitigation (45 per
cent). (Three per cent of studies focused on both heat and air pollution mitigation.) Almost 90 per cent
of the research is made up of observational studies. Among the observational studies, almost 50 per
cent use modelling methods, followed by remote sensing (26 per cent), ground-level data collection (21
per cent), cross-sectional studies (three per cent) and longitudinal studies (one per cent). Five studies
apply experimental approaches and the remaining six studies are reviews.
Many of the recently published studies directly address data gaps identified in previous reviews
(Bowler et al., 2010; Roy et al. 2012). This includes the comparison of amounts, distribution and types
of vegetation (e.g., Chen, Yao, Sun, & Chen, 2014; Perini & Magliocco 2014); differential impacts of
green space scales (e.g., Cohen et al., 2012); and, direct health impacts associated with heat and air
pollution mitigation from greening (e.g., Alonso et al., 2011; Nowak et al., 2014). The data set also
includes first-of-its-kind studies, such as the cooling effects of parks on surrounding air and surface
temperatures (see Feyisa et al., 2014), the impact of greening on individual and household-level
exposure to air pollution (see Dadvand et al., 2012 and Maher et al., 2013), the impact of urban green
spaces on human thermal comfort in winter (see Cohen et al., 2012), differential air quality impacts of
roadside plants (see Weber, Haase & Franck, 2014) and the effects of trees on air quality and human
health at a national level (see Nowak et al., 2014).
A total of 27 countries are represented, with the majority of research set in the United States (26.3
per cent), followed by China (12.6 per cent), Japan (7.8 per cent), England (7.4 per cent), Italy (6.3 per
cent), Greece (4.2 per cent), and Germany (4.2 per cent). Only two studies are from Canada. Climate
settings were categorized using the Köppen climate classifications (Kottek et al., 2006). 2 Almost half of
the research is set in “warm temperate fully humid climates” (Cf) such as London, England, and Beijing,
China (49.5 per cent), followed by “warm temperate dry summer climates” (Cs) such as Athens,
Greece (25.8 per cent); “snow climate, fully humid” (Df) such as Toronto, Canada (17.2 per cent);
“warm temperate climate with dry winter” (Cw) such as Hong Kong, China (5.2 per cent) and “snow
climate with dry winter” (Dw) such as Seoul, Korea (2.2 per cent).
2 Studies set in tropical or arid climates were excluded from this review
PAGE 14 THE IMPACT OF GREEN SPACE ON HEAT AND AIR POLLUTION IN URBAN COMMUNITIESFigure 3. Research focus by year of publication Figure 4. Distribution of studies by climate settings
OVERVIEW OF THE RELATIONSHIP BETWEEN GREENSPACE, HEAT AND AIR QUALITY
Among the identified studies on green space and air pollution, 92 per cent reported pollution
mitigating effects (Figure 5). Among studies on heat mitigation, 98 per cent reported urban cooling
effects associated with green space (Figure 6). Five studies did not report beneficial effects of green
space. Three studies reported increased air pollution resulting from BVOC emissions from green space
(Curtis et al., 2014; Bao et al., 2010; Ren, et. al., (2014). One study found that street canyon vegetation
increased levels of air pollution within the canyon (Vos, Maiheu, Vankerkom & Janssen, 2013), and one
study of a large park in Athens, Greece, reported no observed cooling effect (Zoulia, Santamouris &
Dimoudi, 2009).
Figure 5. Studies reporting pollution mitigation Figure 6. Studies reporting heat mitigation from
from green space green space
STUDY VARIABLES
Six different urban green space types were identified in relationship to heat and air pollution mitigation.
These are: 1) green buildings, 2) small parks, 3) urban trees, 4) mixed neighbourhood green space,
5) large parks, and 6) urban forests. Figure 7 shows the distribution of green space types examined.
Among studies on air pollution and green space, studies on urban trees and urban forests predominate
THE DAVID SUZUKI FOUNDATION PAGE 15the literature, with only four studies comparing the effects of different green space types or scales. For
studies on heat mitigation, research is more evenly distributed among the different green space types
and more studies draw comparisons among them.
Figure 7. Distribution of green space types among studies on heat mitigation and air pollution mitigation
In terms of plant types, the effects of trees were
examined the most, making up almost half of the
studies reviewed, followed by comparisons of
mixed vegetation (table 4).
Among the different characteristics of urban
green space found to influence heat, green space
density was examined the most (n=39), followed
by patch size (n=9), patch shape (n=9) and spatial
configuration (where it was located in an urban
setting) (n=4).
Among the modifying variables identified for affecting the relationship between green space and
heat, the surrounding built environment was examined the most (n= 24), followed by season (n=12),
temperature (n=14), wind (n=9) and precipitation/irrigation (n=3). The only main trade-off identified in
the literature is the cost associated with greening.
The main characteristics explored in relation to green space and air quality are green space density
(n=32), plant height (n= 8) and plant leaf characteristics (n=8). Modifying variables identified for
affecting the relationship between green space and air quality are wind (n=16), patterns of the
surrounding built environment (n=11), season (n=8), air pollution levels (n=5), precipitation (n=3) and
location of vegetation (n=3). Particulate matter was the main air pollutant studied (n=23), followed by
N02 (n=18), O3 (n=11), SO2 (n=4), BVOC (n=4) and airborne heavy metals (n=1). Two main negative
impacts were identified in the literature associated with urban greening: 1) increased BVOC emissions
and 2) increased localized air pollution in street canyons. Exploration of direct health impacts was
limited to mortality rates, respiratory health and health inequalities related to green space distribution.
Table 4. Distribution of plant types examined
Vegetation type Studies on heat mitigation Studies on air pollution
(count) mitigation (count)
Tree 13 24
Grass 1 1
Shrubs 0 0
Mixed 8 3
Comparison of types 17 9
PAGE 16 THE IMPACT OF GREEN SPACE ON HEAT AND AIR POLLUTION IN URBAN COMMUNITIESTYPES OF GREEN SPACES FOUND TO INFLUENCE HEAT AND AIR QUALITY
Among the studies reviewed, all types of green space, ranging from small green walls to large-scale
urban forests, were positively associated with both cooling effects and improvements to air quality. The
following sections describe the overall findings for each type of green space as well as comparisons
where they exist.
Green buildings: Overview
In this review, green buildings refer to urban buildings with an exterior vegetated roof or wall. Green
walls may serve as a significant intervention for mitigating heat stress and urban heat islands but they
are underexplored in the literature. The combined benefits of green roof heat mitigation and pollution
mitigation need to be taken into consideration to assess the overall cost/benefit of green roofs
compared to other cool roof alternatives. While green roofs may not be as effective as street trees in
improving air quality, they may be a useful alternative in areas where there is limited capacity for tree-
planting (Speak, Rothwell, Lindley & Smith, 2012; Baik, Kwak, Park & Ryu, 2012).
Green buildings and heat
Since 2009, six studies on the relationship between green buildings and heat were identified. All six
studies reported positive cooling effects from green building interventions.
Cooling effects of green walls were documented in two experimental studies of living walls, both in
warm temperate fully humid climates (Cf). In Sheffield, U.K., a controlled experiment by Cameron,
Taylor and Emmett (2014) analyzed the effect of living walls on adjacent air temperature compared
to brick walls. The “living walls” provided local cooling and significantly reduced both wall surface
and adjacent air temperatures. During the warmest periods, air temperatures were 3°C cooler in the
presence of the vegetated wall and surface temperatures behind the vegetation were as much as 9.9°C
cooler than the brick wall, even though both walls were irrigated at the same rate. A similar study by
Koyama et al. (2013) in Nagoya, Japan, found that living walls also cooled wall surface temperatures
and showed potential to mitigate urban heat island effects by blocking the long wave radiation from
the walls into the environment at night. While research on the impact of green walls is still emerging,
these results suggest that vegetated building walls can mitigate urban heat island effects and provide
considerable relief from heat stress, particularly in areas where ground space for vegetation is limited.
Green roofs can help to combat urban heat islands through the combined effect of evapotranspiration
of plants and the surface albedo (Susca, Gaffin & Dell’Osso, 2011; Smith & Roebber 2011). However,
there is some debate over whether green roofs are as effective as simpler and less expensive cool
(high albedo) roofing systems that reflect heat during the day. Four studies on green roofs across three
different climates generally show that green roofs provide some heat mitigation but that the effects
are equal to or less than cooling effects achieved from more simple cool roof surfaces (such as white
high-albedo roofs). A city-scale modelling study in Chicago (Df climate) by Smith and Roebber (2011)
explored the impact of green roofs on the urban heat island in summer and estimated that the green
rooftops would reduce air temperatures in the urban environment (by as much as 3°C). Similarly, an
experimental study by Susca et al. (2011) compared the effects of a white and green roof during the
summer in New York City (Df climate) and reported that during the hottest period of the day, the
THE DAVID SUZUKI FOUNDATION PAGE 17surface temperature of the green roof was almost one to eight K lower than the white roof. However,
in a warm temperate fully humid climate (Cf) of Melbourne, Australia, an experimental comparison
of four green roofs (steel, white, vegetated and soil-only roofs) found that the high albedo rooftop,
if combined with insulation, provided the greatest overall benefit in terms of urban heat mitigation
(Coutts, Daly, Beringer & Tapper, 2013). The differences in findings could be the result of many factors
such as study method, setting, vegetation type or climate.
Studies on surface temperature can only provide data relating to urban heat islands but do not provide
information about the effects on air temperature, which is important for understanding the effect of
green space on human exposure to heat and thermal comfort. For example, one study on the impact
of green roofs on thermal comfort in the cities of Barcelona, Palermo and Cairo (Cs) found that only
well-irrigated green roofs provided cooling (Zinzi & Agnoli, 2012). Increases in moisture resulting
from evapotranspiration lead to only marginal cooling when apparent temperatures are considered,
therefore modelled estimates of green roof performance are difficult to assess (Smith & Roebber,
2011). However, green roofs provide more benefits than heat mitigation and cost/benefits comparisons
to “cool roof” systems alone may underestimate the value of green roofs in cities.
Green buildings and air quality
Among the studies on green roofs and air quality is an extensive review by Rowe, 2011, which found air
pollution removal through the intensive application of green roofs is comparable to mitigation effects of
urban forests. For example, adoption of green roofs by 20 per cent of “ready” buildings in Washington,
D.C., was estimated to remove the same amount of air pollution as 17,000 street trees, and an
estimated 20 per cent conversion of all industrial and commercial roofs to green roofs in Detroit,
Michigan, would remove over 800,000 kilograms (889 tonnes) per year of NO2 (Rowe, 2011).
A more recent modelling study in Washington, D.C., reported that increasing the scale of green roofs
to 20 per cent of “ready” roofs would result in an estimated uptake of 38,000 kilograms of NO2 per
year and 513,000 kilograms per year using experimental metric (Niu, Clark, Zhou & Adriaens, 2010).
In Manchester, England, ground-level data on the impact of two green roofs were used to estimate the
PM mitigation from a 50-hectare green roof strategy. They estimate that 0.21 tonnes or 2.3 per cent of
PM10 levels would be removed annually (Speak et al., 2012).
The first-known study of green roofs on air quality in a street canyon found that the cool air produced
from the roof flows into the canyon and improves air flow and air quality near the road. The study
found that air cooling from green roofs causes air quality near the road to improve by strengthening
street canyon flow and enhancing pollutant dispersion when compared with the no-cooling case.
Among the eight roof experiments, the average pollutant concentration (NO and NO2) was reduced by
49 per cent from 247 to 126 ppb with the largest reduction being 57 per cent (Baik et al., 2012).
Small urban parks: Overview
For this review, a park was considered small if it was reported to be less than one hectare in size
or referred to as “small”. The range of studies examined in this review report significant cooling
effects of small parks in all climates examined. The intensity of park cool island effects (PCIs) may
PAGE 18 THE IMPACT OF GREEN SPACE ON HEAT AND AIR POLLUTION IN URBAN COMMUNITIESbe confounded by many variables, particularly the surrounding density of non-green urban areas. In
general, modelling for PCI is expected to be underestimated for very small parks (Cao, Onishi, Chen &
Imura, 2010). Despite the possible confounders, a large cross-sectional study reported that longer and
frequent visits to small urban parks were significantly associated with relief from heat stress. Research
on the impact of small parks on air quality is limited; however, emerging evidence has documented
differences in the air quality of urban parks according to the socioeconomic status of neighbourhoods.
This suggests possible inequities related to green space quality that may affect urban health
inequalities.
Small urban parks and heat
The effects of small green urban areas on heat have been less explored in comparison to larger parks
and urban forests (Oliveira, Andrade, & Vaz, 2011). A previous larger review reported that, on average,
daytime air temperatures of parks were an estimated 1◦C cooler than built-up non-green urban areas
(Bowler et al., 2010). Among the 11 identified studies published in the past five years, all reported
cooling effects (ranging between 4 to 7◦C) compared to adjacent non-green areas.
Overall, the findings show that in all climates studied, small parks can provide a park cool island (PCI)
that provides relief from heat stress. The degree of cooling was influenced by variables such as local
temperature, plant type and density, wind and green patch size (Armson, Stringer, & Ennos, 2012; Cao
et al., 2010; Feyisa et al., 2014; Fintikakis et al., 2011; Froehlich & Matzarakis, 2013; Gaitani et al., 2011;
Konijnendijk et al., 2013; Lafortezza, Carrus, Sanesi, & Davies, 2009; Oliveira et al., 2011; Onishi et al.,
2010; and Vidrih & Medved, 2013).
Studies set in warm temperate dry summer climates (Cs) found that, on average, air temperatures of
parks are 2◦C cooler and up to 3◦C cooler at peak summer temperature with surface temperatures
from 6 to 8◦C cooler (Fintikakis et al., 2011; Gaitani et al., 2011). One study reported that air
temperatures within the park were significantly cooler than both shaded and sunny non-green areas,
with the greatest difference reaching a maximum of 6.9◦C (Oliviera et al., 2011). A study of 21 parks in
the warm temperate dry winter climate (Cw) of Addis Ababa reported an average park cooling effect
of 3.93◦C (ranging from 0.11 to 6.72◦C) (Feyisa et al. 2014). In warm temperate humid climates (Cf),
local air temperature cooling in parks compared to non-green areas ranged from 4.8◦C in Ljubljana,
Slovenia, to 5 to 7◦C in Manchester, England (Vidrih & Medved, 2013; Armson et al., 2012).
These cooling effects contribute significantly to the well-being and quality of life of life of urban citizens
by reducing heat stress. A cross-sectional study of 800 people reported that longer and frequent visits
to small urban parks are significantly associated with improvements to perceived well-being and relief
from thermal discomfort during periods of heat stress (Lafortezza et al., 2009).
Among the studies identified, three respond to a research gap identified by Bowler et al. (2010)
regarding the cooling impact of small parks on adjacent non-green areas. A study of 21 urban parks
in a warm temperate dry winter climate (Cw) found that the mean surface temperature from the
edge of each park to adjacent areas outside of the park was significantly influenced by park size,
vegetation density, park shape and distance from park, and that the maximum cooling distance from
THE DAVID SUZUKI FOUNDATION PAGE 19a park was 224 metres (Feyisa et al., 2014). Similarly, in a warm temperate fully humid climate (Cf) a
study of 92 parks on the surface temperature of the surrounding 500-metre area found the cooling
effect depended on park size, seasonal temperature, vegetation density and park shape, with greater
size, density and complex shapes contributing to greater cooling distances (Cao et al., 2010). These
emerging data may help to guide planning for optimal distances between small urban green spaces to
provide maximum cooling to urban communities (Doick, Peace & Hutchings, 2014).
Small urban parks and air quality
Only three studies were identified on the impact of small urban parks on air pollution. A recent
systematic review found that although the impacts of urban trees have been studied extensively,
research specifically on urban parks has been limited. In general there appears to be a dearth of
research in this area and there is currently only moderate evidence that urban parks mitigate SOx,
NOx, CO and particulate matter (Konijnendijk et al., 2013; Yin et al., 2011).
A unique cross-sectional study on the relationship between green space, air pollution and health
inequality was identified (Su, Jerrett, de Nazelle, & Wolch, 2011). The study explored pollution levels of
Los Angeles parks according to neighbourhood socioeconomic status. The study found that exposures
to NO2 and PM2.5 were significantly and systematically higher for the lower socioeconomic and higher
minority population neighbourhoods. This suggests that possible inequities related to green space
distribution and neighbourhood quality might affect urban health inequalities.
Urban trees: Overview
In this review, urban trees include stands of trees found in urban spaces other than parks or forested
areas. They can include street trees, trees in public community areas other than parks and trees in
backyards, commercial areas and other private properties (Roy et al. 2012). Evidence from this review
and earlier reviews suggests that even single trees are critical for reducing heat stress and related
health risks, buffering the urban heat island and cleaning the urban air. Ensuring equal distribution of
trees in urban neighbourhoods may be particularly important for reducing health inequalities. However,
in the case of street canyons, trees in some cases could be detrimental and increase localized exposure
to traffic emissions and other air pollution due to the confluence of many variables such as wind speed,
building heights and traffic levels. Therefore, many authors suggest case-by-case modelling of tree-
planting in street canyons to maximize benefits and minimize negative impacts.
Urban trees and heat
Eight studies on the effects of urban trees on heat were identified. Five studies explore thermal
comfort, two studies explore urban heat island and one is a review of the literature. All studies report
heat mitigation from urban trees.
Tree shade is significantly associated with improved thermal comfort and relief from heat stress at the
street level and neighbourhood scale (Hwang, Lin & Matzarakis, 2011; Lin, Matzarakis & Hwang, 2010;
Meier & Scherer, 2012; Park, Hagishima, Tanimoto & Narita, 2012; Shashua-Bar, Tsiros & Hoffman,
2012; and Sung, 2013). Experimental field data collected in summer in a warm temperate fully humid
climate (Cf) found that trees with dense shade along a sidewalk significantly decreased the mean
radiant temperature, radiation flux and thereby the thermal comfort of urban streets (Park et al., 2012).
PAGE 20 THE IMPACT OF GREEN SPACE ON HEAT AND AIR POLLUTION IN URBAN COMMUNITIESBoth objective and subjective measures of thermal comfort found it is improved by tree shade during
spring, summer and autumn but not winter when shade is not needed (Lin et al., 2010; Hwang et al.,
2011). Ground-level data collected in Berlin (Df climate) found that even in distinct hot and dry periods,
mature trees remained relatively cool in contrast to non-green impervious surfaces (Meier & Scherer,
2012). These findings are supported by an earlier review on urban trees and heat, where all studies
reviewed reported a cooling effect on urban climate mainly through shade provision, reduction of air
temperature and the mitigation heat island effects (Roy et al., 2012).
Studies suggest that urban trees have a superior ability to provide thermal comfort and relief from heat
(Hwang et al., 2011; Lin et al., 2010; Lynn et al., 2009; Meier & Scherer, 2012; Park et al., 2012; and
Shashua-Bar et al., 2012). For example, a comparison of natural and man-made shading scenarios in a
warm temperate dry summer climate (Cs) showed that all types of shade could reduce the number of
heat stress hours in the day but that trees with dense canopy coverage were the best for decreasing
air temperatures, particularly on the hottest days (Shashua-Bar et al., 2012). Although other shade
structures improved thermal comfort, they did not provide evapotranspirative cooling. Therefore, trees
are likely the most beneficial shade intervention due to their ability to affect both the microclimate
through their cooling effect and thermal comfort through shade provision.
A similar investigation in New York City (Df climate) by Lynn et al. (2009) showed that increased heat
reflecting surfaces (increasing surface albedo) to combat urban heat island may be detrimental due to
increased thermal stress at the street level from reflected solar radiation and emitted thermal radiation
from the street. The presence of shade trees is shown to reduce the energy load on a person by
blocking downward solar radiation and thereby reducing the amount of reflected shortwave radiation
from the surface. Upward thermal radiation from the surface is also reduced in this case because the
surface under the tree is also cooler than indirect sunlight. The implication is that although trees may
be less effective than other strategies in reducing overall urban air temperature, trees provide the best
combination of reducing late-day surface temperature and midday radiation stress on a person at
street level (Lynn et al., 2009).
At the broader neighbourhood scale, ground-level data in the warm temperate fully humid climate
(Cf) of Texas showed that neighbourhoods with tree protection policies reported average land
surface temperatures that were consistently cooler (between 1.5 and 3.9◦C) than those of the control
neighbourhoods that were otherwise physically and socioeconomically similar (Sung et al., 2013).
Emerging evidence shows some neighbourhoods may be disproportionality burdened by heat-related
health risks associated with a lack of urban trees. A cross-sectional study of multiple cities in the
United States reported significant differences in the distribution of urban trees according to “ethno-
racial” background. Living in areas with less tree cover was associated with greater inequality in terms
of heat-related health risk. Adjustment for home ownership and income level did not substantially alter
these results. However, adjustment for population density reduced the effects, suggesting a mediating
or confounding role. Other possible confounding factors were not accounted for, such as unequal
access to air conditioning and social isolation. However, the results suggest that health disparities
related to tree cover among city neighbourhoods can exacerbate health inequalities (Jesdale, Morello-
Frosch & Cushing, 2013).
THE DAVID SUZUKI FOUNDATION PAGE 21Urban trees and air quality
Trees are well-known for removing a number of air-borne pollutants, including ozone, sulphur dioxide,
nitrogen dioxide and particulate matter (Grundstrom & Pleijel, 2014; Harris & Manning, 2010; Kocic,
Spasic, Urosevic & Tomasevic, 2014; and Roy et al., 2012). A large body of evidence documents the
exceptional ability of trees to improve air quality at local sites and across cities (Nowak et al., 2014).
This section focuses on some of the challenges in the research associated with trees and air quality.
A new study suggests that the air quality effects of trees may be different in northern climates like
Canada. Setala, Viippola, Rantalainen, Pennanen and Yli-Pelkonen (2013) collected ground-level
data from 20 sites to examine seasonal difference of trees in northern conditions (in urban areas of
Finland, Df climate). They found that the ability of trees to remove air pollutants is minor in northern
climates. They report a decrease in PM and NO2 concentrations compared to non-treed areas, but
the difference was not significant. They also found that the relative effect of tree-covered areas on air
pollution concentrations did not differ between winter and summer, challenging the notion that leaves
are the main mechanism for air-quality improvement in urban settings. The reason for the reduced
pollutant concentrations in tree-covered areas during winter remains unexplained but these findings
contradict modelled predictions of significant removal of air pollution from trees. Their findings may
be the result of differences in climate, tree species or study methods and should be explored further
(Setala et al., 2013).
There is evidence that some trees emit BVOCs and can contribute to an increase in ground-level
ozone when mixed with NO2 in the presence of sunlight. Harris and Manning (2010) found that
when ambient NO2 levels are high, tree canopies will act as NO2 sinks, but when ambient levels
are low, canopies will act as indirect sources of NO2. Some trees are high emitters of BVOCs and
it is suggested that tree selection, particularly in high-traffic areas, is important for air-quality
improvements. Curtis et al. (2014) assessed nine urban tree species for air-quality impacts in the warm
temperate fully humid climate of Denver (Cf). They estimated that planting one million low-emitting
tree species (sugar maple, Ohio buckeye, northern hackberry, Turkish hazelnut, London planetree,
American basswood, littleleaf linden, Valley Forge elm, and Japanese zelkova) will prevent between
300,000 kilograms and 1.1 million kilograms in VOC emissions, compared to planting the same
number of high-BVOC-emitting Kermes and English oak tree species, respectively. This reduction in
VOC emission is estimated to be equivalent to removing almost 500,000 cars from inner city traffic
(Curtis et al., 2014). Compared to other potential urban tree species, the selected trees had BVOC
emission rates that were one-tenth to one-hundredth the rates of high-BVOC emitting trees.
Trees as sources of pollution represent a complex trade-off, but most studies that examined BVOC
emissions find that proper species and site-specific management would lead to air-quality benefits that
would outweigh negative impacts associated with effects of BVOCs (Harris & Manning, 2010; Ren et
al., 2014).
The first known study to examine the effectiveness of street trees as a barrier to PM10 exposure at the
household level found that the temporary installation of a curbside line of young birch trees resulted
in more than a 50 per cent reduction in measured PM levels inside the houses compared to controls
PAGE 22 THE IMPACT OF GREEN SPACE ON HEAT AND AIR POLLUTION IN URBAN COMMUNITIESYou can also read