The International Communications Market 2016 - Internet and online content - Ofcom

 
CONTINUE READING
The International Communications Market 2016 - Internet and online content - Ofcom
The International
Communications Market 2016
   6

        6   Internet and online
                       content

                             159
Contents
6.1 Internet and online content: overview and key market
       developments                                        161
       Overview                                            161
       Internet advertising                                163
       Mobile internet advertising                         166
       E-commerce                                          166
6.2 Internet and devices                                   169
       Device take-up                                      169
       Time spent online                                   170
6.3 Online content                                         171
       Websites and apps                                   171
       Social networking                                   175
       Mobile banking                                      177
       Mobile payments                                     177

                                                           160
6.1 Internet and online content: overview
and key market developments
         Overview
Portable devices were more popular than desktops in all the comparator countries
In the UK, 78% of consumers have access to a laptop and 72% use a smartphone, but only
53% of consumers have desktop computers. Among our comparators, the UK stands
relatively high on tablet take-up, at 60%, which is significantly higher than take-up in France,
Germany, the US, Japan and Australia. However, the UK is comparatively low on
smartphones; take-up is lower than in the majority of countries, with the exception of the US
and Japan.

Smartphones stand out as being the device of choice for consumers to use to spend time
online, across all the comparator countries. In the US, smartphone users spent 87 hours per
month browsing on their smartphones, compared to 34 hours on their laptops or desktops.
UK smartphone users spent the second-longest time browsing online, at 66 hours per
month.

The UK reported the third highest use of smartphones for shopping online
The wide availability and use of smartphones demonstrates the increased connectivity
across the UK and other comparator countries. Consumers in each of our comparator
countries use their smartphones for a wide range of activities including banking, streaming,
booking cabs and reserving tables at restaurants (Figure 1.1). The UK reported the third
highest use of smartphones for browsing or shopping online, behind Italy and the US.

Online advertising spend grew for all our comparator countries
The popularity of smartphones is reflected in substantial year-on-year increases in mobile
advertising spend per head, with the UK maintaining its position in second place (£39.63 in
2015) behind the US (£42.02). In 2015, China had the greatest share of all advertising
expenditure on the internet; 53% of all its advertising spend was online, overtaking the UK
(48%) and Sweden (48%).

Google and Facebook were among the most-visited online entities among the majority
of comparator countries
Turning to the most frequently accessed online content, Google sites are the most-visited
online entity, among the majority of comparator countries, on laptops and desktops, with the
exception of Japan, where Yahoo is the top online entity. Social networking continues to be
popular among consumers; in the UK, 73% use social networking sites at least once a week.
In Italy and Spain, more than eight in ten consumers access social networks every week. In
the UK, the US, Italy and Spain, Facebook is the second most visited online entity accessed
on a smartphone or tablet.

                                                                                            161
Figure 6.1              Key metrics: 2015 and 2016

                                                                                 SWE
                                       GER

                                                                                                   KOR

                                                                                                                           CHN

                                                                                                                                  NGA
                                                                           NED

                                                                                             SGP

                                                                                                               RUS
                                                   USA

                                                               AUS

                                                                                                         BRA
                                 FRA

                                                                     ESP

                                                                                       POL
                                                         JPN

                                                                                                                     IND
                                             ITA
                            UK
 1Online   Universe (MM)
 (2016)
                            41   38    52    25    205   59    16    21 n/a n/a n/a n/a n/a n/a n/a n/a n/a n/a

 2Desktop                   53   58    63    63    61    51    61    69 n/a 56 n/a n/a n/a n/a n/a n/a n/a n/a
             take-up (%)

 2Laptop                    78   79    75    74    69    61    76    70 n/a 70 n/a n/a n/a n/a n/a n/a n/a n/a
           take-up (%)

 2Tablet   take-up (%)
                            60   50    49    63    49    34    56    64 n/a 57 n/a n/a n/a n/a n/a n/a n/a n/a

 2Smartphone    take-up     72   77    78    89    68    72    78    87 n/a 81 n/a n/a n/a n/a n/a n/a n/a n/a
 (%)

 3Internetshare of total    48   33    29    28    35    23    40    24    42    48    30    18    29    22    31    11    53 n/a
 Adverting spend (%)
 4Fixed internet
 advertising expenditure
                          5.7 3.1 4.2 1.2 25.4 4.4             2.2 0.8 1.1 0.9 0.4 0.2 2.5 0.8 1.0 0.3 13.7 0.02
 (£bn)
 4Fixed internet

 advertising expenditure
                          88 48 51 20 79 35                    92    17    65    88    12    31    50    4     7     13    10 0.1
 per capita (£)
 4Mobile internet

 advertising expenditure
                         2564 433 275 168 13528 938            766 89      10 166      3     23 673 129 130          9 1525 10
 (£m)
 4Mobile internet

 advertising expenditure
                          40 7 3 3          42   7             32 1.93 1         17 0.1      4     13    1     1     0.4 1.1 0.1
 per capita (£)
 5B2C  e-commerce          1760 730 536 201 1207 590 227 285 688 717 143 n/a 841 n/a 104 n/a 364 n/a
 turnover per capita (£)
 6Use mobile phone to
 browse shopping
                            54   45    28    56    58    45    52 n/a n/a 47 n/a n/a n/a n/a n/a n/a n/a n/a
 websites and apps (%)
 6Use mobile phone to   37       34    25    30    43    16    48 n/a n/a 58 n/a n/a n/a n/a n/a n/a n/a n/a
 check bank balance (%)
 2Weekly or greater
 access to social
                            73   70    64    82    76    53    74    85 n/a 74 n/a n/a n/a n/a n/a n/a n/a n/a
 networking (%)

Source: 1comScore MMX, August 2016, home and work panel, persons 15+; 2Ofcom consumer
research October 2016; 32015 Data. Warc data (www.warc.com) Please refer to notes on adspend
data for further detail and source information. http://www.warc.com/NotesOnAdspendData *UK
excludes certain types of adspend which is not monitored in other markets, enabling a like-for-like
comparison 42015 data. Ofcom analysis based on data from PwC Global entertainment and media
outlook 2016-2020 @ pwc.com/outlook. Interpretation and manipulation of data are solely Ofcom’s
responsibility. Population figures from Ofcom/IHS. Ofcom have used an exchange rate of $1.529 to
the GBP, representing the IMF average for 2015. 52015 data. European B2C e-commerce report
2016, Ecommerce Foundation & Ecommerce Europe. Values converted from Euros to British Sterling
(£1=€1.38). Interpretation and manipulation of data are solely Ofcom’s responsibility. Population
figures from Ofcom/IHS 6Deloitte Global Mobile Consumer Survey 2016. Some figures in table have
been rounded. MM = millions

                                                                                                                                 162
Internet advertising
The UK continues to have the highest internet share of advertising, at 48%
The UK was on a par with Sweden; only China, at 53%, was higher among our comparator
countries, overtaking the UK for the first time.

 Figure 6.2              Internet share of total advertising spend: 2009 - 2015
      Internet share of all advertising spend (%)                                                          2014-15
                                                                                                         Change (pp)
      60%
                                                                                                   UK         4

      50%
                                                                                       48%         FRA        3
                                                                                                   GER        2
      40%
                                                                                                   ITA        2
      30%                                                                                          USA        5
                                                                                                   JPN        2
      20%
                                                                                       23%         AUS        6
      10%                                                                                          ESP        2

       0%
                                                                                                   SWE        6
            2009        2010           2011           2012     2013      2014         2015         NED        3

      Internet share of all advertising spend (%)                                                          2014-15
                                                                                                         Change (pp)
      60%
                                                                                53%          CHN             10
      50%
                                                                                             KOR              1
      40%
                                                                                             POL              2
      30%
                                                                                             RUS              7
      20%
                                                                                             BRA              2
      10%
                                                                                11%          SGP              4
      0%
         2009          2010          2011           2012     2013     2014      2015         IND              1

Source: Warc data (www.warc.com)
Please refer to notes on adspend data for further detail and source information.
http://www.warc.com/NotesOnAdspendData *UK excludes certain types of adspend which is not
monitored in other markets, thus enabling a like-for-like comparison

The UK had the second highest fixed internet advertising expenditure per head in
2015
The UK’s spend per head on fixed internet advertising140 in 2015 was £88.49. Per-capita
spend was highest in Australia, at £92.04, overtaking the UK.

140Fixed internet advertising refers to adverts viewed on fixed or ‘wired’ devices, predominantly
through web browsers on laptop and desktop computers.

                                                                                                                  163
Figure 6.3                  Fixed internet advertising expenditure per head: 2014 - 2015

        Internet advertising spend per head (£)

                                                                               2014            2015
                                                                                                               92.04
          85.27 88.49                                                                                  82.47
                                                                                                                                                                     88.32
                                                                                                                                                             80.82
                                                                         75.87 78.99
                                                                                                                                                    65.07
                                                                                                                                            58.74
                                   48.39 47.49 51.46
                           42.13
                                                                                       32.58 34.89

                                                          18.36 19.51                                                   15.18 16.81

              UK              FRA               GER          ITA               USA        JPN             AUS                  ESP             NED                 SWE
  YoY
              4%              15%               8%           6%                4%         7%              12%                  11%             11%                 9%
 change

     Internet advertising spend per head (£)
                                                                               2014            2015

                                                           50.20
                                                  42.98

                                        30.79
                               25.32

                   11.56                                                                                               13.25
          10.56                                                                                            10.86                              9.92
                                                                                        6.18    6.98                                 7.83
                                                                        3.32    3.97
                                                                                                                                                            0.08     0.09

               POL                   SGP               KOR                 BRA              RUS                  IND                    CHN                    NGA
  YoY
 change       10%                    22%               17%                 19%             13%                   22%                    27%                    13%

Source: Ofcom analysis based on data from PwC Global entertainment and media outlook 2016-
2020 @ pwc.com/outlook. Interpretation and manipulation of data are solely Ofcom’s responsibility.
Ofcom has used an exchange rate of $1.529 to the GBP, representing the IMF average for 2015.
Population figures from Ofcom/IHS.

                                                                                                                                                                             164
Search advertising accounted for more than half of total fixed internet advertising
spend in the UK in 2015
The respective strengths of internet, classified,141 display, search and video advertising142
are likely to be the result of a number of country-specific factors including broadband
penetration, broadband speeds, and the strength of other media competing for advertising
spend.

Over half of our comparator countries spend more on search advertising than any other type.
Search accounted for just over half of internet advertising revenue in the UK (51%). Of all
the comparator countries, search’s share of total fixed internet advertising expenditure was
highest in Russia (77%).

Video advertising continued to account for a generally small share of fixed internet
advertising expenditure. It had the smallest share in all but two countries: Italy (19%) and the
US (11%). Video advertising made up 6% of expenditure in the UK.

 Figure 6.4             Fixed internet advertising expenditure, by category: 2015
  Proportion of internet advertising revenue (%)
      6%    5%    6%                  2%             5%     2%                         4%   4%    6%    3%    5%    4%
                                11%          11%                    8%        6%
                                                                                                        5%
                          19%                        10%   13%                              14%
                                                                                      15%         16%         15%
      19%         17%           7%    24%                                     15%                       15%
            23%                                                    19%                                              25%
                          12%                25%
                                                           22%
                                                     28%                                          21%
                  25%           29%
      24%                                                                                                     36%
            23%                                                    25%
                                             18%                              43%     50%   51%                     29%
                          38%         42%

                                                                                                        77%
                                                           63%
                                                     56%                                          58%
      51%   48%   53%           53%                                48%
                                             46%                                                              43%   41%
                          32%         32%                                     36%     31%   31%

      UK    FRA   GER     ITA   USA   JPN    AUS     ESP   NED     SWE        POL     SGP   KOR   BRA   RUS   IND   CHN

                                            Search    Display    Classified        Video

Source: Ofcom analysis based on data from PwC Global entertainment and media outlook 2016-2020
@ pwc.com/outlook. Interpretation and manipulation of data are solely Ofcom’s responsibility. Ofcom
has used an exchange rate of $1.529 to the GBP, representing the IMF average for 2015.

141 Online classified advertising is a brief advert, usually in small print, in an online newspaper,
magazine or similar publication.
142 Online video display advertising can take one of two forms. The first is similar to display advertising

on websites, but in the form of an audio-visual advert rather than a static image or series of animated
images, and like banner advertising, can sit in the page alongside other content. The second is similar
to traditional spot television advertising, where adverts are shown either before, after, or midway
through an online video, and the advert is embedded within the video player.

                                                                                                                     165
Mobile internet advertising
The UK had the second highest spend per head on mobile internet advertising
Of all our comparator countries, the US had the highest mobile advertising143 expenditure
per head in 2015, at £42.02, followed by the UK at £39.63.

 Figure 6.5                  Mobile internet advertising expenditure, per head: 2014 - 2015
      Mobile internet advertising spend per head (£)

                                                                         2014              2015
                                                                          42.02
              39.63

                                                                                                           31.95

      24.58                                                       25.54

                                                                                                   17.88                                                  16.94
                                                                                                                                                  11.77
                               6.72                                               6.55 7.41
                        4.59
                                        2.52 3.41     1.99 2.81                                                     1.23 1.93        0.52 0.60

          UK                 FRA            GER           ITA        USA            JPN               AUS               ESP            NED              SWE
  YoY   61%                  46%            35%           42%        65%            13%               79%               57%            16%              44%
 change

      Mobile internet advertising spend per head (£)

                                                                          2014              2015
                                                          13.38

                                                  11.10

                                        4.18
                               3.21

                                                                           0.62              0.90                             0.87     1.11
          0.07        0.09                                        0.52              0.44                   0.28    0.39                          0.03     0.06

               POL                    SGP             KOR            BRA               RUS                    IND                CHN                NGA
  YoY
 change        26%                    30%             21%            19%               107%                       40%            28%                87%

Source: Ofcom analysis based on data from PwC Global entertainment and media outlook 2016-2020
@ pwc.com/outlook. Interpretation and manipulation of data are solely Ofcom’s responsibility. Ofcom
has used an exchange rate of $1.529 to the GBP, representing the IMF average for 2015.
Population figures from Ofcom/IHS.

              E-commerce
The UK continued to have the highest per-capita turnover for e-commerce in 2015
The business-to-consumer (B2C) e-commerce market is supported by consumers who
increasingly expect to do their shopping online and at any time, via their connected device.

143Mobile advertising includes all advertising delivered directly to a mobile device, and includes
search and display advertising as well as SMS/MMS advertising formats. Mobile display advertising
can also be delivered to the device’s browser or to a mobile app.

                                                                                                                                                                  166
As in 2014, among our comparator countries, B2C e-commerce turnover, on a per-capita
basis, was highest in the UK, at £1760 per person. This is much larger than the next highest
markets: the US (£1207 per head), and South Korea (£841 per head).

This high UK figure may be due to a combination of factors, including a traditionally strong
history of catalogue shopping, overall satisfaction with postal services and the high
availability of debit and credit cards.

E-commerce turnover per head was relatively low in Italy (£201), despite the high proportion
of those with a smartphone who claimed to shop online regularly (Figure 6.7).

 Figure 6.6                            B2C e-commerce turnover, per head: 2014 - 2015
        Turnover per head (£)
                 £1,760

                                                                                                    2014          2015
        £1,590

                                   £1,207
                          £1,086

                                                   £841
                                            £770

                                                                 £730

                                                                               £717

                                                                                             £688
                                                                        £650
                                                          £641

                                                                                      £597

                                                                                                           £590
                                                                                                    £545

                                                                                                                         £536
                                                                                                                  £464

                                                                                                                                       £364

                                                                                                                                                     £285
                                                                                                                                £275

                                                                                                                                              £250

                                                                                                                                                                   £227

                                                                                                                                                                                 £201
                                                                                                                                                            £201

                                                                                                                                                                          £171

                                                                                                                                                                                               £143
                                                                                                                                                                                        £122

                                                                                                                                                                                                            £104
                                                                                                                                                                                                      £98
  YoY       UK              USA              KOR           FRA           SWE           NED            JPN          GER           CHN           ESP           AUS           ITA          POL            RUS
 Change 11%                 11%              9%            14%           10%           15%             8%          16%           33%           14%           13%           18%          17%            6%
Source: European B2C e-commerce report 2016, Ecommerce Foundation & Ecommerce Europe
Notes: Values converted from Euros to British Sterling (£1 = €1.38). Interpretation and manipulation of
data are solely Ofcom’s responsibility. Population figures from Ofcom/IHS.

Four in ten mobile phone users in the UK browse shopping websites and apps every
week
At 42%, Italy had the highest proportion of mobile phone users who claimed to use their
devices to browse shopping websites or apps at least once a week. The UK reported the
second highest use, of our comparator countries (39%), in line with the US. In contrast, both
Germany and Japan had the lowest proportion of respondents who said they did this at least
once a week. The UK was one of four comparator countries where less than half of mobile
phone users said that they did not use their device for browsing shopping websites and
apps.

                                                                                                                                                                                                            167
Figure 6.7            Use of mobile phone to browse shopping websites and apps: 2016

             Proportion of all respondents (% )

                                                                                Do not use
              46%                                 42%               44%
                                                              48%         53%
                           55%                          55%
                                         72%
                                                                                Have ever used
                                                  8%                6%
               6%                                             6%
               9%                                 12%               8%
                            6%                                11%         9%
                            7%                                                  At least once a month
                                                        23%               10%
                                         7%
              39%                                 38%   7%          42%
                           32%           6%                   35%
                                                                          28%   At least once a week
                                         15%            15%

               UK          FRA           GER      US    JPN   AUS   ITA   SWE
   NET:
 Ever Used    54%          45%           28%      58%   45%   52%   56%   47%

Source: Deloitte Global Mobile Consumer Survey 2016
Base: All adults 18-75 who have a mobile phone, UK=3712, FRA=1847, GER=1838, ITA=1862,
USA=1776, JPN=1431, AUS=1864, SWE=1893
Q50NEW_2 - Activities use mobile phone for - Browse shopping websites/apps.
Note: Figures have been rounded

                                                                                                 168
6.2 Internet and devices
           Device take-up
The UK has comparatively high take-up of tablets and laptops
Tablet ownership in the UK was among the highest across our comparator countries, with
60% of respondents saying they had one in their household - higher than all countries apart
from Italy, Spain and Sweden.

Laptop ownership for UK consumers was also higher than most comparator countries, at
78%, in line with France (79%) and higher than in the US, Japan, Spain and Sweden. In
contrast, desktop take-up in the UK, at 53%, was lower than in six of our other comparator
countries.

Although the UK was the second lowest among our comparator countries, nearly three-
quarters (72%) of respondents here claim to have a smartphone.

 Figure 6.8          Availability and personal use of devices: 2016
 Proportion (%) of all respondents
           89%

                             87%
                           81%

                                                                                     79%
                                                                                     78%
     78%

                     78%
     77%

                                                                                    76%
                                                                                   75%
                                                                                   74%
   72%

                   72%

                                                                                 70%
                                                                                 70%
                                                                                69%

                                                                                                               69%
                 68%

                                                                     64%

                                                                                                             63%
                                                                                                             63%
                                                63%

                                                                                                            61%
                                                                             61%

                                                                                                            61%
                                    60%

                                                                                                           58%
                                                                  57%
                                                                  56%

                                                                                                          56%
                                                                                                         53%

                                                                                                        51%
                                          50%
                                          49%

                                                      49%
                                                            34%

          Smartphone                              Tablet                           Laptop                      Desktop

                           UK      FRA          GER               ITA      USA   JPN        AUS   ESP    SWE

Source: Ofcom consumer research, October 2016
Base: All respondents, UK=1000, FRA=1008, GER=1010, ITA=1032, USA=1016, JPN=1011,
AUS=1007, ESP=1016, SWE=1000
Q.3a Which of the following devices do you have in your home? (tablet, laptop, desktop)
Q.4a Which of the following devices do you personally use either at home or elsewhere?
(smartphone)

                                                                                                                         169
Time spent online
UK users spend 29 hours per month browsing on their laptops or desktop computers
Internet users in the US spent 34 hours online on a laptop or desktop computer in August
2016. This was the highest among our comparator countries, followed by Germany and
Japan (both 31 hours), and the UK and France (both 29 hours).

 Figure 6.9        Average time spent browsing on a laptop or desktop computer: August
 2016
 Hours per month

      34
                   31       31          29         29
                                                               26
                                                                           24         23

     USA           GER      JPN         UK         FRA         AUS        ITA         ESP

Source: comScore MMX, work and home panel, August 2016, persons 15+

UK smartphone users spend 66 hours per month browsing online
In the UK, smartphone owners spent, on average, 66 hours online on their smartphones in
August 2016. Smartphone users in the US spent more time online, at 87 hours. UK users
spent more than twice as much time browsing on a smartphone than on their laptop or
desktop; this was also the case in the US, Spain and Italy.

 Figure 6.10       Average time spent browsing on a smartphone: August 2016
 Hours per month

            87

                                  66
                                                         57
                                                                                 52

            USA                   UK                     ITA                    ESP

Source: comScore Mobile Metrix, August 2016, adults 18+, all smartphones, browsing and application
combined.
Note: *Mobile Metrix in the UK, US, Italy and Spain is supplemented by panel data and has not been
directly compared with the remaining comparator countries.

                                                                                              170
6.3 Online content
            Websites and apps
Google-owned sites had the highest reach in all but one of our comparator countries
in August 2016, on desktop and laptop computers
Google’s properties144 (which include services such as Gmail and YouTube, as well as
Google search) had the highest reach in all of our comparator countries, with the exception
of Japan. Microsoft sites145 were among the top three in reach across all comparator
countries. Amazon sites were among the top ten properties in all comparator countries, while
eBay was in the top ten in five of the comparator countries.

As in previous years, domestic media and publishing services such as the BBC in the UK,
Gruppo Editoriale Express (Italy) and Vocento (Spain) featured among the top ten properties
in their home countries. The BBC is the only public broadcaster to feature in the top ten,
although other properties that relate to companies with broadcast TV divisions, such as CBS
Interactive and Comcast NBC Universal (both US) also appear.

Only in the UK and Australia did a government property feature within the top ten highest-
ranked web properties in August 2016 (WWW.GOV.UK146 and ABS.GOV.AU147
respectively).

144 comScore Properties represent all Full Domains (i.e. felmont.com), Pages (i.e.
sports.felmont.com/tennis), Applications or Online Services, under common ownership or majority
ownership for a single legal entity. A Property may also contain digital media content that is not
majority-owned but has been legally signed over for reporting purposes by the majority owner.
145 These sites include MSN (which is likely to be used as a default browser homepage by some

users), Bing Search, and websites for Microsoft Office, Outlook and Windows.
146 Its feature in the top 10 reflects its role as a single point of contact for citizens to access central

government services online in the UK.
147 In August 2016, the Australian Bureau of Statistics held Australia’s census. People were able to

complete this online, accounting for the reach of the Bureau’s website (ABS.GOV.AU).

                                                                                                          171
Figure 6.11 Top ten properties accessed on a laptop or desktop computer, by
 country: 2016
           UK               FRA             GER             ITA              US             JPN              AUS            ESP

 1   Google Sites      Google Sites    Google Sites     Google Sites   Google Sites    Yahoo Sites       Google Sites   Google Sites

 2   Microsoft Sites     Facebook        Facebook        Facebook      Yahoo Sites     Google Sites Microsoft Sites Microsoft Sites

 3     Facebook        Microsoft Sites Microsoft Sites Microsoft Sites Microsoft Sites Microsoft Sites    Facebook       Facebook

                                                                                           LINE
 4   Amazon Sites Yahoo Sites              eBay         ItaliaOnline     Facebook                        Yahoo Sites    Yahoo Sites
                                                                                        Corporation
                                                                                                                           Unidad
                                                                                                          News Corp
 5    Yahoo Sites Webedia Sites Amazon Sites Yahoo Sites Amazon Sites                    FC2 inc.                         Medios
                                                                                                           Australia
                                                                                                                          Digitales
                         Schibsted  Axel Springer
 6       eBay                                     Amazon Sites           AOL, Inc.     Amazon Sites         eBay        Amazon Sites
                        Media Group      SE

                                         Deutsche
 7     BBC Sites       Solocal Group                      Banzai         Apple Inc.    Rakuten Inc. Amazon Sites           Prisa
                                         Telekom
                                                                                                          Telestra
      WWW.GOV             CCM          Hubert Burda
 8                                                         eBay            eBay         NTT Group        Corporation      Vocento
        .UK             Benchmark         Media
                                                                                                          Limited
                                                        Wikimedia                                                        Wikimedia
                                                                            CBS
 9     Apple Inc.      Amazon Sites Yahoo Sites         Foundation                       Facebook        ABS.GOV.AU      Foundation
                                                                         Interactive
                                                           Sites                                                           Sites
      Wikimedia                                           Gruppo                                          Wikimedia
                                           United-                     Comcast NBC                                       Schibsted
10    Foundation       Orange Sites                      Editoriale                CyberAgent             Foundation
                                       Internet Sites                    Universal                                      Media Group
        Sites                                            Espresso                                           Sites

Source: comScore MMX, home and work panel, August 2016 persons 15+

Google sites and domestic media companies were among the most popular
properties on smartphones and tablets in August 2016
There are some differences between online content consumption on laptop and desktop
computers, and mobile devices (smartphones and tablets). Media groups and multimedia
publishing groups were notably popular on mobile devices. RCS MediaGroup was in the top
ten properties in Italy and Spain, while Trinity Mirror Group (UK) and Prisa (Spain) featured
among the top ten properties in the markets in which they operate.

On smartphones and tablets, Yahoo and Google sites featured in the top ten properties in all
of the comparator countries.

Conversely, some properties were less popular on mobile devices than on laptops or
desktops. Amazon was in the top ten most-accessed properties on a laptop or desktop for all
comparator countries, but in only two countries for mobile phone access. eBay was among
the ten most popular properties on laptops and desktops in five countries, but was in the top
ten properties on mobile devices only in the UK.

                                                                                                                                      172
Figure 6.12        Top ten properties accessed on smartphones and tablets, by country:
 2016

           UK               ITA                US            ESP

  1   Google Sites      Google Sites      Google Sites   Google Sites

  2    Facebook          Facebook          Facebook        Facebook

                                                             RCS
  3    BBC Sites           Banzai         Yahoo Sites
                                                          MediaGroup
                          Gruppo
  4   Amazon Sites       Editoriale       Amazon Sites     Vocento
                         Espresso
      Trinity Mirror       RCS              Comcast
  5                                                          Prisa
         Group          MediaGroup        NBCUniversal

      Trip Advisor
  6                    Leonardo ADV CBS Interactive       Grupo Godo
           Inc.

                                                          Schibsted
  7     Sky Sites       Yahoo Sites         AOL, Inc.
                                                         Media Group

                           Gruppo
  8   Yahoo Sites                           Apple Inc.   Grupo Heraldo
                          Mediaset

      Mail Online /
  9                    Tripadvisor Inc.     LinkedIn      Yahoo Sites
       Daily Mail

                                            Weather
 10       eBay          Italia Online                     Atresmedia
                                          Company, The

Source: comScore MoMX, Total mobile, browser and applications, August 2016.
Note: *Mobile Metrix in the UK, US, Italy and Spain is supplemented by panel data and has not been
directly compared with the remaining comparator countries which have a related but different
methodology.

In August 2016, Pokémon Go was the most downloaded iOS app in the UK
According to App Annie’s data on downloads from the App Store, Niantic’s Pokémon GO
was the most downloaded iOS app in the UK, as it was in France and Italy. The 2016
Olympic Games were held in August 2016, and in both France and Italy, the Olympic Games
apps that were published by the national public service broadcasters (Télévisions
Françaises and Rai respectively) were among the top ten iOS apps by downloads,
coinciding with the Olympics taking place that same month.

Apple’s iTunesU148 educational app was in the top ten in all of the countries. In several of the
comparator countries, August-September marks the end of the summer holiday and the start
of a new school or university year.

148iTunesU allows tutors and students to access educational resources, and manage and submit
lessons and assignments on mobile devices such as tablets.

                                                                                               173
Figure 6.13              Top ten iOS apps, by downloads: August 2016
               UK                      FRA                      GER                      ITA                   US                   JPN                ESP
                                                                                                                                                     Rio 2016
                                                                                                                             White Cat Tennis (     Olympics
         Pokémon GO               Pokémon GO                                        Pokémon GO                                            )
  1                                                       iTunesU [Apple]                                iTunesU [Apple]                             (Juegos
           [Niantic]                [Niantic]                                         [Niantic]                              [COLOPL (
                                                                                                                                      )]          Olímpicos Río
                                                                                                                                                   2016) [RTVE]
          WhatsApp                                                                                                                                Pokémon GO
                                                           Apple iMovie           Rai Rio2016 [Rai        Pokémon GO
  2       Messenger            Bitmoji [Snapchat]                                                                             iTunesU [Apple]        [Niantic]
                                                             [Apple]                    Net]                [Niantic]
          [Facebook]
                                francetv JO – Rio                                    WhatsApp                                                      Apple iMovie
                                                           Pokémon GO                                     Apple iMovie          Apple iMovie
  3   Flip Diving [Miniclip]       2016 [France                                      Messenger                                                        [Apple]
                                                             [Niantic]                                      [Apple]               [Apple]
                                   Télévisions]                                      [Facebook]

            Snapchat                 Snapchat                                     Rio 2016 Olympic                                                iTunesU [Apple]
  4                                                        Pages [Apple]                                Bitmoji [Snapchat]     Pages [Apple]
           [Snapchat]               [Snapchat]                                     Games [Neowiz]

           Facebook                WhatsApp                                           Facebook                                                    Prisma [Prisma
                                                          Apple Numbers                                                       Apple Numbers
  5       Messenger                Messenger                                         Messenger            Pages [Apple]                                labs]
                                                              [Apple]                                                             [Apple]
          [Facebook]               [Facebook]                                        [Facebook]
                                    Facebook
            Facebook                                      Apple Keynote                                  Apple Numbers          Pokémon GO         Google Maps
  6                                Messenger                                     Prisma [Prisma labs]
           [Facebook]                                        [Apple]                                         [Apple]              [Niantic]          [Google]
                                   [Facebook]
                                                                                                                                                  Apple Numbers
        Premier League               Facebook                                        Instagram           Apple Keynote
  7                                                     GarageBand [Apple]                                                     SNOW [NAVER]           [Apple]
       [Premier League]             [Facebook]                                       [Facebook]             [Apple]

                                                            WhatsApp                                                                              Apple Keynote
                                                                                                                               Apple Keynote
  8     iTunesU [Apple]        Flip Diving [Miniclip]       Messenger            Flip Diving [Miniclip] GarageBand [Apple]                           [Apple]
                                                                                                                                  [Apple]
                                                            [Facebook]
         Apple iMovie                                                                 Facebook              Snapchat                              Pages [Apple]
  9                              iTunesU [Apple]        Flip Diving [Miniclip]                                               GarageBand [Apple]
           [Apple]                                                                   [Facebook]            [Snapchat]
                                                                                                                                                    WhatsApp
                                                                                                            Facebook          Yahoo! Japan
                                  Apple iMovie                                                                                                      Messenger
 10   Bitmoji [Snapchat]                                Bitmoji [Snapchat]         iTunesU [Apple]         Messenger         Weather (Yahoo
                                    [Apple]                                                                                                         [Facebook]
                                                                                                           [Facebook]          ) [Yahoo Japan]

Source: App Annie Intelligence. Note: app publishes are shown in parentheses

In August 2016, the most downloaded app from Google Play was either PokémonGO
or WhatsApp Messenger, in all but one of the reported countries
Messaging apps149 such as Facebook Messenger, Snapchat and WhatsApp Messenger
accounted for at least at least two of the top three downloads in August 2016 from Google
Play in four comparator countries, including the UK. Messaging services among the top ten
downloads in Japan (but not in the other countries) included Line and SNOW.150

The BBC Media Player (allowing the playback of BBC video and audio content on Android
devices)151 was the seventh most popular Google Play app downloaded in the UK in August
2016. Italy was the only other country in which an app published by a public service
broadcaster was among the top ten downloads (Rai’s Rio 2016 app).

149 ‘Over the top’ (OTT) messaging apps use a data connection to allow users to send messages,
(text/photos/voice/video) between each other over the internet, rather than the voice call / video call,
SMS/MMS services provided by the user’s mobile operator.
150 LINE is a multimedia OTT messaging application published by South Korean online content and

portal company Naver Corporation. SNOW, also published by Naver, is a video and picture
messaging app which allows users to apply filters and effects to their pictures and videos.
151 The app provides support for, and management of, playback of content on a range of BBC

services including the mobile website, BBC apps, and services such as iPlayer on Android devices.

                                                                                                                                                             174
Figure 6.14                 Top Google Play apps, by downloads: August 2016
               UK                      FRA                   GER                    ITA                     US                    JPN                     ESP

                                  Pokémon GO              WhatsApp              WhatsApp                                                              WhatsApp
                                                                                                    Facebook Messenger      Pokémon GO
          Pokémon GO                [Niantic]             Messenger             Messenger                                                             Messenger
 1                                                                                                       [Facebook]           [Niantic]
            [Niantic]                                     [Facebook]            [Facebook]                                                            [Facebook]

                                                                                                                         White Cat Tennis (
                               Facebook Messenger        Pokémon GO         Facebook Messenger         Pokémon GO
      Facebook Messenger                                                                                                         ) [COLOPL (         Pokémon GO
 2                                  [Facebook]             [Niantic]             [Facebook]              [Niantic]
           [Facebook]                                                                                                                 )]               [Niantic]

           WhatsApp                                                                                                                                     Facebook
           Messenger           Snapchat [Snapchat] Facebook Messenger Facebook [Facebook] Facebook [Facebook]              SNOW [NAVER]
 3                                                                                                                                                     [Facebook]
           [Facebook]                                   [Facebook]

                                                                                                                                                       Facebook
                                                                               Pokémon GO
      Facebook [Facebook] Facebook [Facebook] Facebook [Facebook]                                     YouTube Music      LINE (          ) [LINE      Messenger
 4                                                                               [Niantic]
                                                                                                         [Google]             (         )]            [Facebook]

                                   WhatsApp
                                   Messenger          Snapchat [Snapchat]                           Snapchat [Snapchat] GO Security [Sungy             Instagram
 5    Snapchat [Snapchat]                                                   Instagram [Facebook]
                                   [Facebook]                                                                          Mobile (           )]           [Facebook]

                                                                                                                          Yahoo! Japan             Clean Master (
      Instagram [Facebook]      Bitmoji [Snapchat] Instagram [Facebook]      Rio 2016 Olympic       Instagram [Facebook] Weather (Yahoo
 6                                                                                                                                                          ) [Cheetah
                                                                              Games [Neowiz]                               ) [Yahoo Japan]
                                                                                                                                                   Mobile (         )]
                                                                                                                           AbemaTV                  Prisma [Prisma
       BBC Media Player                                 360 Battery Plus    Prisma [Prisma labs] Rolling Sky [Cheetah [CyberAgent (
 7                             Instagram [Facebook]                                                                                                      labs]
            [BBC]                                     [Qihoo 360 (    360)]                       Mobile (        )]
                                                                                                                                )]
        Z Camera: Filter                              Farm Heroes Super                                                                            Rio 2016 Olympic
                                                                         Snapchat [Snapchat]           Pandora Radio         SmartNews
 8     Photo Editor [Sungy        Waze [Google]         Saga [Activision                                                                            Games [Neowiz]
                                                                                                         [Pandora]          [SmartNews]
      Mobile (            )]                               Blizzard]
                               Farm Heroes Super                                                                                                        Snapchat
                                                      eBay Kleinanzeigen     Slither.io [Lowtech     Bitmoji [Snapchat] Instagram [Facebook]
 9       Spotify [Spotify]       Saga [Activision                                                                                                      [Snapchat]
                                                            [eBay]                 Studios]
                                    Blizzard]
                                                                                                        WhatsApp
       Slither.io [Lowtech
                                                                            Rai Rio2016 [Rai Net]       Messenger          Yahoo! JAPAN                Wallapop
 10          Studios]            Skype [Microsoft]     Amazon [Amazon]
                                                                                                        [Facebook]         [Yahoo Japan]               [Wallapop]

Source: App Annie Intelligence. Note: app publishes are shown in parentheses

           Social networking
Around three-quarters of UK internet users use social networks at least once a week
The majority of internet users in all of our eight comparator countries said they accessed
social networks at least once a week in 2016. This was highest in Italy (82%) and Spain
(85%), compared to 73% in the UK. Japan had the least active social networkers compared
to the eight comparator countries, with just over half of respondents using social networks at
least once a week.

In the majority of the comparator countries, the proportion of weekly social networkers
increased between 2015 and 2016. The largest increase was in the US, from 62% to 76%.

                                                                                                                                                                 175
Figure 6.15               Weekly access to social networks: 2015 - 2016

                                                                         2015        2016
 Respondents (%)

                                                                                                                                        85%
                                                            82%
                                                      78%

                                                                              76%

                                                                                                                                  76%
                                                                                                                    74%

                                                                                                                                                          74%
              73%

                             70%

                                                                                                                                                    68%
       65%

                                                                                                              65%
                                            64%

                                                                        62%
                       61%

                                      54%

                                                                                                53%
                                                                                          50%
         UK                FRA         GER              ITA              USA                JPN                AUS                 ESP               SWE

Source: Ofcom consumer research October 2015 and October 2016 Base (2016): All respondents,
UK=1000, FRA=1008, GER=1010, ITA=1032, USA=1016, JPN=1011, AUS=1007, ESP=1016,
SWE=1000 2015 Q.8 How often do you use an internet connection on any of your devices for each of
the following activities? 5.Accessing social networking sites (e.g. Facebook, Twitter)  | 2016 Q.9 How often do you use the internet on any of your devices for each of the following
activities? 2. Accessing social networking sites 

Facebook has the highest reach among social networks for all comparator countries
Among our comparator countries, Facebook’s reach on laptop or desktop computers was
highest (in August 2016) in Italy (at 72%) compared to 64% in the UK.

LinkedIn had the second highest reach among the selected social networks in Italy, the US
and Australia, while Twitter ranked second in the UK and Spain and Japan.

 Figure 6.16 Active reach of selected social networks on laptop and desktop
 computers: 2016

                              Facebook [P]        Twitter [P]         Linkedin [P]          Google+ [C]              Pinterest.com [P]
 Active reach (%)
                                                        72%
                     71%

                                                                              66%
                                     65%
 64%

                                                                                                                                              64%
                                                                                                                          59%
                                                                                                  45%
                                                                                                      32%

                                                                                                                                25%
      23%

                                                                                   19%

                                                                                  18%

                                                                                                                                                 18%
                                                                                  18%
                         16%
   16%

                        15%

                                                                                                                                                15%
               14%

                       14%
                       14%

                                                                                13%

                                                                                                                                        13%
                                                              11%

                                                                                                                                                           11%
                                                                                                                            10%
                                         10%
                                         10%
             9%

                                                             8%
                                        8%

                                                                                                                                                          8%
                                        7%

                                                            6%
                                                            6%

                                                                                                                                   4%
                                                                                                         3%
                                                                                                         3%
                                                                                                        2%

       UK                  FRA              GER                 ITA                 USA                 JPN                     AUS                 ESP

Source: comScore MMX, home and work panel, August 2016, persons 15+
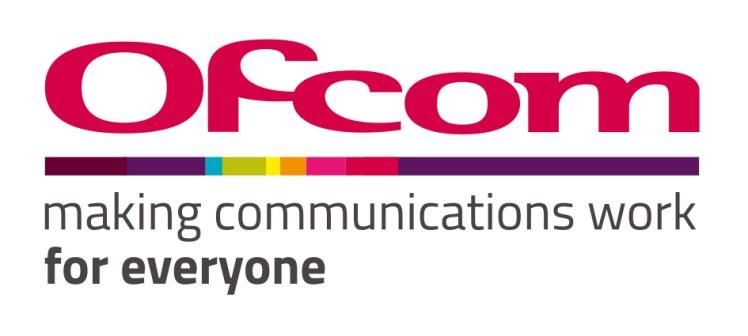
                                                                                                                                                                 176
Mobile banking
More than a third of UK mobile phone users check their bank balance on their device
In the majority of comparator countries, more than a quarter of phone users claimed to check
their bank balance using their device. In the UK the figure was 37%, ranking the UK fourth of
the eight comparator countries.

An increasing number of apps offer the ability to send money to friends or businesses via a
handset. These on-demand services can be delivered through integrated online platforms
such as PayPal. In the UK, 20% of phone users transferred money with their device; the
fourth highest among the comparator countries.

 Figure 6.17        Use of mobile phone to check bank balance or transfer money: 2016
   Proportion of respondents (%)

                                              Check bank balance     Transfer money

                                                                                                       58%
                                                                                                             54%
                                                                                           48%
                                                               43%
      37%            34%
                                                 30%                                             28%
                                   25%                               22%
             20%
                                                                             16%
                           11%                            9%
                                         6%                                           5%

         UK             FRA          GER            ITA            USA          JPN          AUS         SWE

Source: Deloitte Global Mobile Consumer Survey 2016
Base: All adults 18-75 who have a phone or smartphone, UK=3712, FRA=1847, GER=1838,
ITA=1862, USA=1776, JPN=1431, AUS=1864, SWE=1893
Q50BIS - In the last 3 months, have you used your phone to do any of the below?
Check bank balances / transfer money to another individual in the same country

        Mobile payments
Three in ten mobile phone users in UK have ever used their mobile to pay for a
product online
Across all of the comparator countries, a minority of mobile phone users had made an online
payment on their mobile phone. In the UK, around a third (32%) of mobile phone owners
claim to have used their device to purchase a product online, in line with Italy. This activity is
most popular in Japan, where nearly half (47%) claim to have ever purchased a product
online using their mobile device.

                                                                                                               177
Figure 6.18            Use of mobile phone to pay for a product online: 2016

              Proportion of respondents (% )

                                                                                Do not use

                                                      53%
                                                61%
                68%                                               67%
                             79%          78%               80%           79%   Have ever used

                                                9%    24%                       At least once a month
                7%                                                 8%
                                                11%
                11%          6%           7%          11%         10%
                                                            7%             8%
                             8%           6%    19%         7%             6%   At least once a week
                14%                                   12%         15%
                             7%           9%                6%             7%
                UK           FRA         GER    US    JPN   AUS    ITA    SWE
    NET:
  Ever Used     32%          21%          22%   39%   47%   20%   33%     21%

Source: Deloitte Global Mobile Consumer Survey 2016
Base: All adults 18-75 who have a phone or smartphone, UK=3712, FRA=1847, GER=1838,
ITA=1862, USA=1776, JPN=1431, AUS=1864, SWE=1893
Q50NEW_3 - Activities use mobile phone for: Pay for a product
Note: Figures have been rounded

                                                                                                 178
You can also read