The Internet of Things Gets Smarter - November 2017 - BNY Mellon Investment ...
←
→
Page content transcription
If your browser does not render page correctly, please read the page content below
BNY Mellon Investment Conference | November 2017

                                  The Internet of Things Gets Smarter
                                                                                    November 2017

                                                                                 Strictly private and confidential.
                            This presentation is for the attendees of the BNY Mellon Conference 2017 only and is intended for their internal information purposes only.
                   Not for further distribution in Singapore.. Any views and opinions are those of the investment manager, unless otherwise noted and is not investment advice.
BNY Mellon Investment Conference | November 2017

The Internet of (EVERY)Thing
                                                                                                    Consumer-stated interest in each of the following IoT Categories1

                                                                                                       75%
     IoT holds the promise of        a more efficient
                                                                                             2016
                                                                                                                                                                         2016    65%
     world as corporations and consumers alike                                                  2015   68%
     embrace smarter cities, transportation, and                                                                                                                          2015     53%
     factories, with trillions of dollars of future
     economic value to be won or lost.                                                                                                                                    2016     62%

                                                                                                                                                                            2015   59%

               IoT Endpoint Spending Worldwide by Category ($B) 2                                              Forecast Economic Impact of IoT in 2025 ($B)2
    3500
                                                                                                           Human                                      1,590
                                                                                                                          170
    3000                                                                                                                    350
                                                                                                            Home
                                                                                                                          200
    2500                                                                     911             Retail Environments                             1,160
                                                                                                                                410
                                                                                                           Offices        150
    2000                                                                                                                 70
                                                                             566                                                                                                     3,700
                                                                                                        Factories
                                                                                                                                              1,210
    1500
                                                                                                        Worksites                       930
                                                                                                                          160
    1000                                                 667                                                                          740
                                    612                                                                  Vehicles
                                                                                                                          210
                                                                            1534
                  567                                    201                                                                                           1,660
    500                             155                                                                      Citis
                                                                                                                                        930
                  115                                    546                                                                           850
                  257               416                                                                   Outside
      0                                                                                                                          560
                 2014               2015                2016*               2020*                                    0                1000              2000         3000                4000
           Consumer      Business: Cross-Industry          Business: Vertical-Specific                                                High Estimate       Low Estimate

1Source: USA edition, Deloitte Global Mobile Consumer Survey, July 2015; Base: All adults: 2,069; All Smartphone owners: 1,458; All tablet owners: 1,059. https://www2.deloitte.com/us/en/
pages/technology-media-and-telecommunications/articles/global-mobile-consumer-survey-us-edition.html. 2Source: Statista, Internet of Things, Worldwide; 2014-2015; *Estimates. Some
information contained herein has been obtained from third party sources that are believed to be reliable, but the information has not been independently verified by TBCAM. TBCAM makes no
representations as to the accuracy or the completeness of such information.
                                                                                                                                                                                                2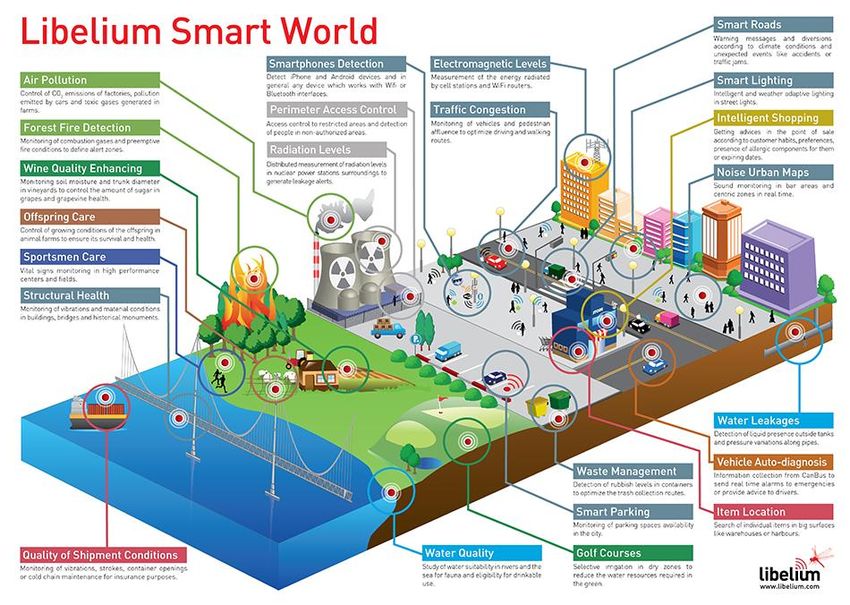
BNY Mellon Investment Conference | November 2017

IoT Will Affect All Facets of Our Lives

Source: Libelium. Some information contained herein has been obtained from third party sources that are believed to be reliable, but the information has not been independently verified by
TBCAM. TBCAM makes no representations as to the accuracy or the completeness of such information.
BNY Mellon Investment Conference | November 2017

Connected Things/Devices Worldwide Should More Than Double Over the Next 5 Years

                                                                                   Number of Connected Things/Devices Worldwide by Vertical
                                                                                                  2015 to 2021 (in millions)*
                                    9000

                                    8000

                                    7000
     Connected things in millions

                                    6000

                                    5000

                                    4000

                                    3000

                                    2000

                                    1000

                                      0
                                                       2015                     2016                2017                 2018                   2019                2020                   2021

                                           Utilities   Consumer electronics**     POS/Vendong/ATM     Automotive   Smart cities   Smart buildings   Smart homes   Wearables   Healthcare    Other

Source: Statista, Berg Insight, August 2016. Note: Worldwide; 2015. *Forecasts figured for 2016 to 2021. **Including home appliances. Some information contained herein has been obtained from
third party sources that are believed to be reliable, but the information has not been independently verified by TBCAM. TBCAM makes no representations as to the accuracy or the completeness
of such information.
                                                                                                                                                                                                    4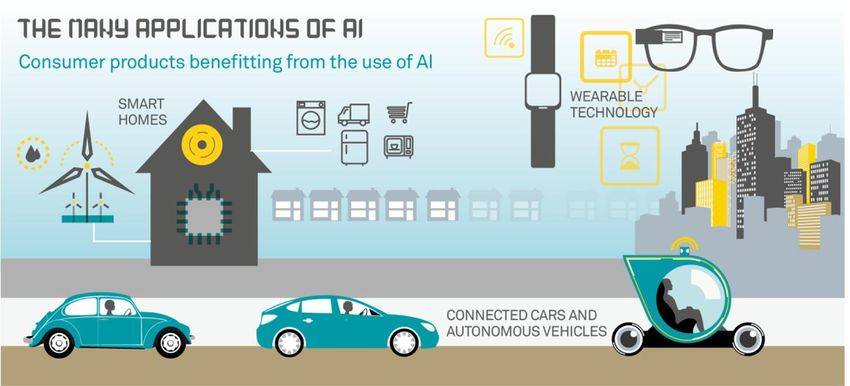
BNY Mellon Investment Conference | November 2017

Global Smart Home Growth Should Drive Further IoT Adoption

                                                                Market Size of the Global Smart Home Market
                                                                       2013 to 2025 (in million units)
                                                  Smart Buildings
                                    1000

                                    900                                                                                                                                  37

                                                                                                                                                                        437
                                    800

                                                                                                                                             30
                                    700
                                                                                                                                            331
     Market size in million units

                                    600

                                    500                                                                         22

                                                                                                                205
                                    400                                                                                                                                 185
                                                                                    17
                                                                                                                                            156
                                                                                   140
                                    300

                                                          12                                                    113
                                                                                                                                                                        254
                                    200
                                            9             76                        86                                                      218
                                                                                                                165
                                            56
                                    100                   53                       127
                                            38
                                                          76
                                            55
                                      0
                                           2013          2015                     2018*                        2020*                       2023*                       2025*

                                                                 North America     Europe       Asia/Pacific    Latin America

Image Source: Cisco; Smart+Connected Communities Canada, Smar+Connected Real Estate, Rick Huijbregts, June 2012. Graph Source: Statista, IDATE; June 2016. Note: Worldwide, 2013 to
2015. *Forecast. Some information contained herein has been obtained from third party sources that are believed to be reliable, but the information has not been independently verified by
TBCAM. TBCAM makes no representations as to the accuracy or the completeness of such information.
                                                                                                                                                                                             5
BNY Mellon Investment Conference | November 2017

The Internet of Things Connects Everything

                                                   . . . .Even my chicken coop

                                                                                 6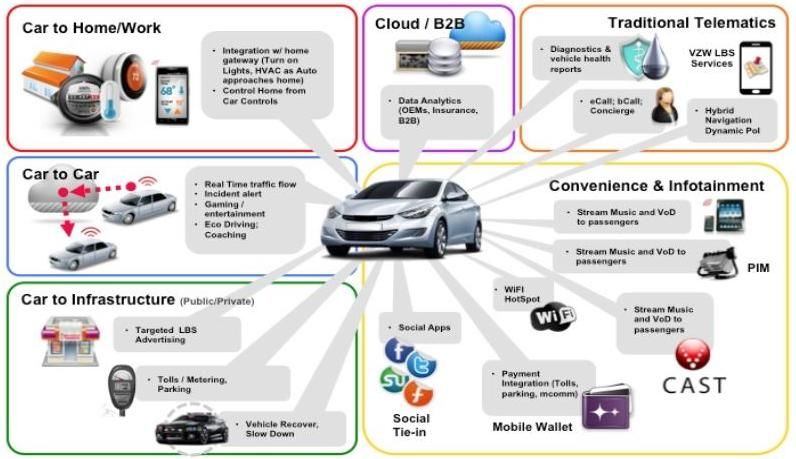
BNY Mellon Investment Conference | November 2017
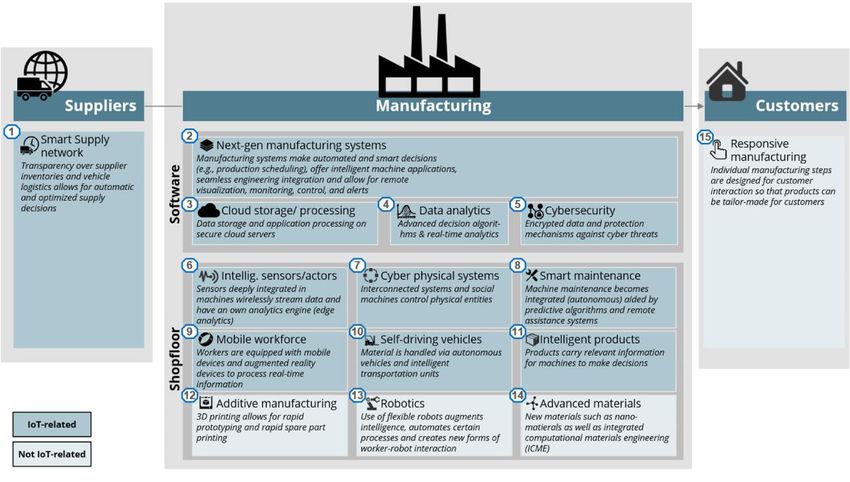
Factory of The Future
15 Components of the Smart Factory of the Future
Source: IoT Analytics, https://iot-analytics.com/industrial-internet-disrupt-smart-factory/. Some information contained herein has been obtained from third party sources that are believed to be
reliable, but the information has not been independently verified by TBCAM. TBCAM makes no representations as to the accuracy or the completeness of such information.
7
BNY Mellon Investment Conference | November 2017

Autonomous Driving Components Set For Explosive Growth

Source: Carvoyant. Some information contained herein has been obtained from third party sources that are believed to be reliable, but the information has not been independently verified by
TBCAM. TBCAM makes no representations as to the accuracy or the completeness of such information.
                                                                                                                                                                                               8
BNY Mellon Investment Conference | November 2017

Wearable Device Unit Shipments Worldwide by Category 2016-2018, 2021

                                                                     Forecast Unit Shipments of Wearable Devices Worldwide
                                                                      2016 to 2018 and in 2021 (in million units), by category
                                600

                                500
                                                                                                                                                                    58.7
   Unit shipments in millions

                                                                                                                                                                    22.3
                                400                                                                                                                                 63.9

                                                                                                                         56.2
                                                                                                                                                                    206.0
                                                                                     55.7
                                300                                                                                       21.7
                                                   55.5                              21.4                                48.8
                                                                                     44.1
                                                   21.2                                                                  168.0
                                200                35.0                             150.0
                                                   128.5                                                                                                            5.6

                                                                                                                                                                    67.2
                                100
                                                                                                                         1.6
                                                                                     1.1
                                                   0.2                                                                   28.3                                       81.0
                                                                                     22.0
                                                   16.1
                                                                                     41.5                                48.2
                                                   34.8
                                 0
                                                   2016                             2017*                               2018*                                       2021*

                                      Smartwatch      Head-mounted display   Body-worn camera   Bluetooth headset      Wristband       Sports watch        Other fitness monitor

Source: Statista, Gartner, August 2017. Note: Worldwide, 2017. *Forecast. Some information contained herein has been obtained from third party sources that are believed to be reliable, but the
information has not been independently verified by TBCAM. TBCAM makes no representations as to the accuracy or the completeness of such information.
                                                                                                                                                                                                   9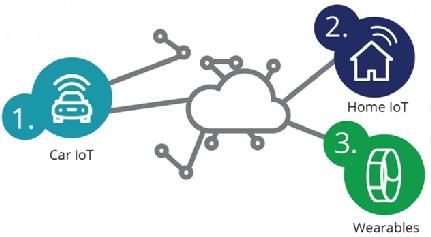
BNY Mellon Investment Conference | November 2017

The Many Applications of AI

                                                   10
BNY Mellon Investment Conference | November 2017
Internet of Things Spending Worldwide by Vertical
Spending on Internet of Things Worldwide by Vertical
in 2015 and 2020 (in billion U.S. dollars)
45
40 40 40
40
35
Spending in billion U.S. Dollars
30
30
25
25
20
15 15
15
12 12 12
10 10
10 8
7
5 5 5 5
5 4
3
2 2
0
Discrete Tranportation & Utilities B2C Healthcare Process Energy & Retail Government Insurance Other
Manufacturing Logistics Natural
Resources
2015 2020*
Source: Statista, BCG, January 2017. Note: Worldwide; 2014-2015. *Forecast. Some information contained herein has been obtained from third party sources that are believed to be reliable, but
the information has not been independently verified by TBCAM. TBCAM makes no representations as to the accuracy or the completeness of such information.
11BNY Mellon Investment Conference | November 2017
Fundamental Characteristics Remain Attractive for IoT Universe
As of September 30, 2017
Price/Earnings Ratio
22
20
18
16
14
12
10
IBES LTG Estimate
20
18
Percent Growth
16
14
12
10
Source: Compustat/Worldscope, IBES and IDC. Based on the Internet of Things custom benchmark. Some information contained herein has been obtained from third party sources that are
believed to be reliable, but the information has not been independently verified by TBCAM. TBCAM makes no representations as to the accuracy or the completeness of such information. Past
performance is not a guarantee for future performance. No investment strategy or risk management technique can guarantee returns or eliminate risk in any market environment. [21095]
12BNY Mellon Investment Conference | November 2017
Internet of Things
13BNY Mellon Investment Conference | November 2017 Internet of Things
Representative Portfolio Strategy
Investable Buy
Universe Candidate Portfolio
Criteria Construction Process Internet of Things
Portfolio
ACWI Index constituents in
IoT-related industries
Most attractive alpha model
Qualitative assessment for
scores
consistency with theme
New positions only from Buy
Market cap and liquidity
Xx platform identifies candidate list Qualitative review
screen
companies benefiting from
Maximize portfolio Risk management
growth in IoT Fundamentally recommended
alpha subject to
by TBCAM analysts Implementation and trading
predicted volatility
constraint
Rules-based sell discipline
3500
200
70
Investment 30-40
Universe Buy Candidate
List
Optimized Portfolio
No investment strategy or risk management technique can guarantee returns or eliminate risk in any market environment.
14BNY Mellon Investment Conference | November 2017 Internet of Things
Representative Portfolio Strategy: Stock-Selection Disciplines
TBCAM Global Research Rating TBCAM
Long Shorts
Holdings Buy Overweight Hold Underweight Sell Holdings
1
2 New Buy Candidates
Alpha Model Decile
3
4
5
6
7 Sell Candidates
8
9 Required Sales to Zero*
10
= Investment Universe
*Subject to overall portfolio exposure to theme. No investment strategy or risk management technique can guarantee returns or eliminate risk in any market environment.
15BNY Mellon Investment Conference | November 2017 Internet of Things
Systematic Portfolio Management Drives Consistency
Daily Bi-Weekly Monthly
Performance monitoring Quantitative model review Attribution review
Trading update Fundamental rating review Quantitative factor review
Dedicated team meeting Risk exposure review Optimized portfolio review
Global Research team meeting Rules-based portfolio rebalance Global sector team meetings
Outlier review
Key Benefits
Efficiently blends fundamental and quantitative stock insights
Upgrades alpha profile at individual security level
Identifies, assesses and mitigates risks
Bi-weekly cycle optimizes trading and execution impacts
No investment strategy or risk management technique can guarantee returns or eliminate risk in any market environment.
16BNY Mellon Investment Conference | November 2017 Internet of Things
Representative Portfolio Strategy
As of June 30, 2017
Characteristics Industry Allocation (%)
Internet of Things
Internet of Things
Custom Index
Electronic Equip. Inst. & Comp. 21.0
Price/Earnings 21.3 x 19.9 x
Software 17.4
Est 3-5 Yr EPS Growth 16.8 % 17.6 %
Electrical Equipment 14.2
ROE 5.4 % 11.5 %
Semiconductors & Semi. Equip. 7.3
Wtd. Avg. Market Cap ($) 33.5 B 6.6 B
Household Durables 7.1
Top 10 Holdings (%) Communications Equipment 6.8
Internet of Internet Software & Services 5.8
Company Country Industry
Things
Media 4.9
Garmin Ltd. Switzerland Household Durables 6.1
LogMeIn, Inc. United States Internet Software & Services 5.8 Auto Components 4.7
Nuance Communications, Inc. United States Software 5.4
OMRON Corp. Sponsored ADR Japan Electronic Equip. Instruments & Comp. 5.3 Industrial Conglomerates 3.4
Zebra Technologies Corp. Class A United States Electronic Equip. Instruments & Comp. 5.0
Comcast Corporation Class A United States Media 4.9 Health Care Equipment & Supplies 2.4
ABB Ltd. Switzerland Electrical Equipment 4.6
Internet & Direct Marketing Retail 2.1
Schneider Electric SE France Electrical Equipment 4.1
HubSpot, Inc. United States Software 3.9 Health Care Providers & Services 1.9
Lumentum Holdings, Inc. United States Communications Equipment 3.8
Construction & Engineering 1.1
Total 49.0
Representative Institutional Account – where applicable, excludes cash, ETFs and futures. There may be material differences between the representative account and other accounts managed
with the same strategy. Because of these differences, the information based on the representative account should not necessarily be relied upon. It should not be assumed that securities
identified were or will be profitable or that decisions we make in the future will be profitable. Certain securities may not remain in the portfolio at the time that you receive this report. No investment
strategy or risk management technique can guarantee returns or eliminate risk in any market environment. The information shown above is supplemental to the GIPS presentation that can be
found at the end of this book along with other important disclosures. Variation in totals due to rounding.
17BNY Mellon Investment Conference | November 2017 Internet of Things
Representative Portfolio Strategy Holdings by Country (%)
As of June 30, 2017
United States 64.5 Japan 9.8
LogMeIn, Inc. 5.8 OMRON Corporation Sponsored ADR 5.3
Nuance Communications, Inc. 5.4 Mitsubishi Electric Corp. Unsponsored ADR 3.5
Zebra Technologies Corporation Class A 5.0 Sony Corporation Sponsored ADR 1.0
Comcast Corporation Class A 4.9
HubSpot, Inc. 3.9 France 5.7
Lumentum Holdings, Inc. 3.8
Schneider Electric SE 4.1
Itron, Inc. 3.0
Valeo SA 1.7
Splunk Inc. 3.0
NETGEAR, Inc. 2.9
Proofpoint, Inc. 2.9 Netherlands 2.0
iRhythm Technologies, Inc. 2.4 Philips Lighting NV 2.0
Silicon Laboratories Inc. 2.3
Amazon.com, Inc. 2.1
Swededn 1.8
Honeywell International Inc. 2.1
Hexagon AB Class B 1.8
Cognex Corporation 2.0
BioTelemetry, Inc. 1.9
Brooks Automation, Inc. 1.7 Germany 1.3
Visteon Corporation 1.6 Siemens AG 1.3
Skyworks Solutions, Inc. 1.5
Amphenol Corporation Class A 1.4
United Kingdom 1.3
Delphi Automotive PLC 1.4
AVEVA Group plc 1.3
Control4 Corporation 1.2
Keysight Technologies Inc 1.2
Comfort Systems USA, Inc. 1.1 Canada 1.0
Kinaxis, Inc. 1.0
Switzerland 12.5
Garmin Ltd. 6.1
ABB Ltd. 4.6
STMicroelectronics NV 1.8
Representative Institutional Account – where applicable, excludes cash, ETFs and futures. There may be material differences between the representative account and other accounts managed
with the same strategy. Because of these differences, the information based on the representative account should not necessarily be relied upon. It should not be assumed that securities
identified were or will be profitable or that decisions we make in the future will be profitable. Certain securities may not remain in the portfolio at the time that you receive this report. No
investment strategy or risk management technique can guarantee returns or eliminate risk in any market environment. The information shown above is supplemental to the GIPS presentation that
can be found at the end of this book along with other important disclosures. Variation in totals due to rounding.
18BNY Mellon Investment Conference | November 2017 Internet of Things
Representative Portfolio Strategy Holdings by Industry (%)
As of June 30, 2017
Electronic Equipment Instruments & Components 21.0 Communications Equipment 6.8
OMRON Corporation Sponsored ADR 5.3 Lumentum Holdings, Inc. 3.8
Zebra Technologies Corporation Class A 5.0 NETGEAR, Inc. 2.9
Itron, Inc. 3.0
Cognex Corporation 2.0
Hexagon AB Class B 1.8
Internet Software & Services 5.8
Amphenol Corporation Class A 1.4 LogMeIn, Inc. 5.8
Control4 Corporation 1.2
Keysight Technologies Inc 1.2 Media 4.9
Comcast Corporation Class A 4.9
Software 17.4
Nuance Communications, Inc. 5.4 Auto Components 4.7
HubSpot, Inc. 3.9 Valeo SA 1.7
Splunk Inc. 3.0 Visteon Corporation 1.6
Proofpoint, Inc. 2.9 Delphi Automotive PLC 1.4
AVEVA Group plc 1.3
Kinaxis, Inc. 1.0
Industrial Conglomerates 3.4
Honeywell International Inc. 2.1
Electrical Equipment 14.2
Siemens AG 1.3
ABB Ltd. 4.6
Schneider Electric SE 4.1
Mitsubishi Electric Corp. Unsponsored ADR 3.5 Health Care Providers & Services 2.4
Philips Lighting NV 2.0 iRhythm Technologies, Inc. 2.4
Semiconductors & Semiconductor Equipment 7.3 Internet & Direct Marketing Retail 2.1
Silicon Laboratories Inc. 2.3 Amazon.com Inc. 2.1
STMicroelectronics NV 1.8
Brooks Automation, Inc. 1.7
Health Care Providers & Services 1.9
Skyworks Solutions, Inc. 1.5
BioTelemetry, Inc. 1.9
Household Durables 7.1 Construction & Engineering 1.1
Garmin Ltd. 6.1
Comfort System USA, Inc. 1.1
Sony Corporation Sponsored ADR 1.0
Representative Institutional Account – where applicable, excludes cash, ETFs and futures. There may be material differences between the representative account and other accounts managed
with the same strategy. Because of these differences, the information based on the representative account should not necessarily be relied upon. It should not be assumed that securities
identified were or will be profitable or that decisions we make in the future will be profitable. Certain securities may not remain in the portfolio at the time that you receive this report. No
investment strategy or risk management technique can guarantee returns or eliminate risk in any market environment. The information shown above is supplemental to the GIPS presentation that
19
can be found at the end of this book along with other important disclosures. Variation in totals due to rounding.BNY Mellon Investment Conference | November 2017 Internet of Things
Disclosure
20BNY Mellon Investment Conference | November 2017 Internet of Things
Disclosure
21BNY Mellon Investment Conference | November 2017
Disclosure
The Boston Company Asset Management, LLC (“TBCAM”) and its affiliates (collectively, “We”) are providing the information in this presentation at your request based on our
understanding that, to the extent such information (and all subsequent information and communications by us, whether written or verbal) may be used by the recipients in evaluating a
potential investment by an employee benefit plan covered under ERISA or an individual arrangement covered under Section 4975 of the Internal Revenue Code, each recipient is an
“independent fiduciary with financial expertise,” as described in regulation 29 CFR § 2510.3-21(c)(1).
In addition, we are providing this information (and any subsequent information or communications) on the basis that each of the recipients understands that: (i) we have not undertaken to
provide impartial investment advice, or to give advice in a fiduciary capacity, to you or any prospective investor and (ii) we have a financial interest if the prospective investor makes an
investment with us given the compensation that would be earned by us and/or our affiliates under the arrangement, as described in an agreement with the prospective Retirement Client
and/or in separate disclosure/offering documents.
You must notify us immediately if our understanding about your status is incorrect. If you do not provide us with such notification, then you acknowledge and agree that our understanding
is correct.
22BNY Mellon Investment Conference | November 2017
Important Information Singapore
The information contained in this document is confidential and is provided solely for presentation at BNY Mellon Conference 2017.
This document is personal and confidential to, and is for the exclusive use of the attendees of the BNY Mellon Conference 2017 (the “Recipient”) for information purposes only and may
not be copied, duplicated in any form by any means, published, circulated or redistributed or caused to be done so, whether directly or indirectly, to any other persons without our prior
written consent.
This document is personal and confidential to, and is for the exclusive use of the Recipient. The Recipient shall not issue, circulate, distribute, publish, reproduce or cause to be issued,
circulated, distributed, published or reproduced (whether in whole or in part) this document to any other persons without the prior written consent of BNY Mellon Investment Management
Singapore Pte. Limited. All information relating to this document has been prepared by BNY Mellon Investment Management. Any views and opinions contained in this document are those
of the Investment Manager as at the date of issue; are subject to change and should not be taken as investment advice. BNY Mellon Investment Management and its affiliates are not
responsible for any subsequent investment advice given based on the information supplied.
BNY Mellon is the corporate brand of The Bank of New York Mellon Corporation and may also be used as a generic term to reference the corporation as a whole or its various
subsidiaries. This document is not intended as investment advice. Investment involves risk. Past performance is not indicative of future performance. No investment strategy or risk
management technique can guarantee returns or eliminate risk in any market environment. The value of investments and the income from them is not guaranteed and can fall as well as
rise due to stock market and currency movements. When you sell your investment you may get back less than you originally invested.
This document may not be used for the purpose of an offer or solicitation in any jurisdiction or in any circumstances in which such offer or solicitation is unlawful or not authorised. No
warranty is given as to the accuracy or completeness of this information and no liability is accepted for errors or omissions in such information. The investment program contained in this
presentation may not meet the objectives or suitability requirements of any specific investor. An investor should assess his/her own investment needs based on his/her own financial
circumstances and investment objectives.
Portfolio holdings are subject to change at any time without notice, are for information purposes only and should not be construed as investment recommendations. The information
contained in this document should not be construed as a recommendation to buy or sell a security. It should not be assumed that a security has been or will be profitable. There is no
assurance that a security will remain in the portfolio. Tax treatment will depend on the individual circumstances of clients and may be subject to change in the future.
The contents of this document have not been reviewed or authorised by any regulatory authority in Singapore. You are advised to exercise caution when reading this document. If you are
in any doubt about the contents of this document, you should obtain independent professional advice. If there is any inconsistency between this warning statement and the disclosure
stated under this document, this warning statement shall prevail to the extent of the inconsistency.
In Singapore, this document is issued by BNY Mellon Investment Management Singapore Pte. Limited, Co. Reg. 201230427E. BNY Mellon Investment Management Singapore Pte.
Limited and any other BNY Mellon entity mentioned are ultimately owned by The Bank of New York Mellon Corporation.
AP2730-02-11-2017 (3M)
23You can also read