The Latest Myths and Facts
    on Global Warming
←
→
Page content transcription
If your browser does not render page correctly, please read the page content below
The Latest Myths and Facts
on Global Warming
The Latest Myths and Facts
      on Global Warming

                               AUTHORS
                           Dr. James Wang
       SCIENTIST, CLIMATE AND AIR PROGRAM, ENVIRONMENTAL DEFENSE

                       Dr. Michael Oppenheimer
PROFESSOR OF GEOSCIENCES AND INTERNATIONAL AFFAIRS, PRINCETON UNIVERSITY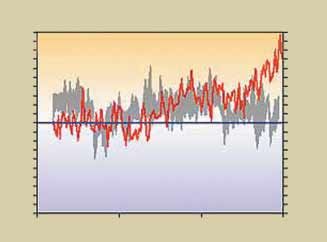
Cover image: Photodisc

Our mission
Environmental Defense is dedicated to protecting the environmental rights of all
people, including the right to clean air, clean water, healthy food and flourishing
ecosystems. Guided by science, we work to create practical solutions that win last-
ing political, economic and social support because they are nonpartisan, cost-
effective and fair.

©2005 Environmental Defense

Printed on paper that is 80% recycled, 80% post-consumer, processed chlorine free (text);
100% recycled, 50% post-consumer, processed chlorine free (cover).

The complete report is available online at www.environmentaldefense.org.
Contents
Executive summary iv
Introduction 1
Part I. Is global warming happening? 2
MYTH #1: Winters have been getting colder 2
MYTH #2: Satellite measurements show a smaller warming than surface 2
measurements
MYTH #3: The warming over the past century is nothing unusual; it is 3
part of a natural cycle
MYTH #4: Earth’s climate is self-regulating 5
MYTH #5: Recent extreme events have no link to climate change 5
Part II. Is global warming being caused by human activities? 8
MYTH #6: Humans cannot be responsible for the increase in atmospheric CO2 8
MYTH #7: The warming of the past century has been caused by natural 8
factors, such as solar variability, a recovery from the Little Ice Age, cosmic rays
MYTH #8: Global warming has been caused by the urban heat island effect 10
Part III. Can we have any confidence in predictions of future climate 11
change?
MYTH #9: Models cannot predict the climate many years in advance 11
MYTH #10: Models have many flaws that make them useless in predicting climate 11
MYTH #11: The growth of emissions in the IPCC scenarios is unrealistically high 11
MYTH #12: We can’t trust global warming predictions since scientists just a few 12
decades ago warned that a new ice age was approaching
MYTH #13: The science behind the theory of global warming is too uncertain 13
for policy making
Part IV. How harmful would the predicted warming be? 14
MYTH #14: The warming predicted by the IPCC is small and hardly a cause 14
for concern
MYTH #15: Global warming and increased CO2 would be beneficial 14
Part V. What should we do about global warming? 16
MYTH #16: Society can easily adapt to climate change 16
MYTH #17: Forests in the Northern Hemisphere are absorbing as much CO2 16
as is emitted by burning fossil fuels
MYTH #18: It would be safe and more effective to wait to solve the problem 17
rather than act now
MYTH #19: Humankind is foolish to believe it is capable of controlling the climate 17
References 18
Figures
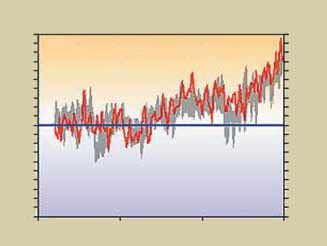
Figure 1: Temperature trends for the Northern Hemisphere over the past 4
1,000–2,000 years.
Figure 2: Comparison of modeled and observed temperature trends since 1860 9
iiiExecutive summary
This summary provides a brief overview of the most common myths regarding
global warming. For a more comprehensive and in-depth discussion of the
scientific issues, please see the main body of the report. While written for a
general audience, the main body of the report includes citations of peer-reviewed
scientific literature.
MYTH: Global warming can’t be happening, since winters have been getting colder.
FACT: Winters have been getting warmer. Measurements show that Earth’s climate
has warmed overall over the past century, in all seasons, and in most regions. The
skeptics mislead the public when they bill the winter of 2003–2004 as record cold in
the northeastern United States. That winter was only the 33rd coldest in the region
since records began in 1896. Furthermore, a single spell of cold weather in one small
region is no indication of cooling of the global climate, which refers to a long-term
average over the entire planet.
MYTH: Satellite measurements of temperature over the past two decades show a much
smaller warming in the atmosphere than is measured by thermometers at the surface.
This contradicts global warming predictions based on climate models.
FACT: Recent research has corrected problems that led to underestimates of the
warming trend in earlier analyses of satellite data. The new results show an
atmospheric warming trend slightly larger than at the surface, exactly as models
predict.
MYTH: The global warming over the past century is nothing unusual. For example, the
Medieval Warm Period (MWP), roughly from A.D. 1000 to 1400, was warmer than
the 20th century. This indicates the global warming we are experiencing now is part of
a natural cycle.
FACT: Ten independent scientific studies all have found a large 20th-century
warming trend compared to temperature changes over the past millennium or two.
Uncertainty exists as to exactly how warm the present is compared to the MWP.
Some studies have received valid criticism for possibly underestimating the magni-
tude of longer-lasting, century-scale temperature changes, such as the warming
during the MWP. However, other studies, using different methods, still find no
evidence of any period during the last 2,000 years that was warmer than the 1990s.
Most importantly, any uncertainty about whether the present is warmer than the
MWP has little effect on the finding that humans likely have caused most of the
warming over the past 50 years. A separate body of studies has provided the main
evidence for this finding. (See the Myth on causes of warming.)
MYTH: Human activities contribute only a small fraction of carbon dioxide (CO2)
emissions, far too small to have a significant effect on the concentration of the
greenhouse gas in the atmosphere.
FACT: Before the Industrial Revolution, the amount of CO2 emitted from large
natural sources closely matched the amount that was removed through natural
processes. That balance has now been upset by human activities, which since the
ivIndustrial Revolution have put twice as much CO2 into the atmosphere as can be
readily removed by the oceans and forests. This has resulted in the accumulation of
CO2 to the highest levels in 420,000 years.
MYTH: The Earth’s warming is caused by natural factors like increased sunlight and
sunspots or decreased cosmic rays, not by greenhouse gases (GHGs).
FACT: Modeling studies indicate that most of the warming over the past several
decades was probably caused by the increase in human-produced GHGs. Climate
models have difficulty reproducing the observed temperature changes over the past
150 years unless they account for the increase in GHGs as well as natural factors,
such as sunlight and volcanic eruptions, and changes in the amount of human-
produced sulfate particles, which cool the planet. Satellite measurements of the
intensity of sunlight exhibit little or no trend over the past 25 years, when there was
rapid warming on Earth. The purported correlations between the amount of cosmic
rays and Earth’s temperature are the result of flawed analysis methods.
MYTH: The warming observed during the past century was caused by urbanization
(urban heat island effect).
FACT: Urbanization does increase temperatures locally, affecting thermometer
readings in certain areas. But the temperature data used in trend analyses are adjusted
to remove any bias from urbanization. In any case, urbanization has an insignificant
effect on global temperature trends.
MYTH: Models have trouble predicting the weather a few days in advance. How can
we have any confidence in model projections of the climate many years from now?
FACT: Climate prediction is different from weather prediction, just as climate is
different from weather. Models are now sophisticated enough to be able to repro-
duce the observed global average climates over the past century as well as over
other periods in the past. Thus, scientists are confident in the models’ ability to
produce reliable projections of future climate for large regions. Furthermore,
climate assessments typically consider the results from a range of models and
scenarios for future GHG emissions, in order to identify the most likely range
for future climatic change.
MYTH: The science behind the theory of global warming is too uncertain to draw
conclusions useful to policy makers.
FACT: The primary scientific debate is about how much and how fast, rather than
whether, additional warming will occur as a result of human-produced GHG
emissions. While skeptics like to emphasize the lower end of warming projections,
uncertainty actually applies to both ends of the spectrum—the climate could change
even more dramatically than most models predict. Finally, in matters other than
climate change, policy decisions based on uncertain information are made routinely
by governments to ensure against undesirable outcomes. In the case of global
warming, scientists have given society an early warning on its possibly dangerous,
irreversible and widespread impacts.
MYTH: Global warming and increased CO2 would be beneficial, reducing cold-related
deaths and increasing plant growth (“greening the Earth”).
vFACT: If society does not limit further warming, the beneficial effects probably will
be heavily outweighed by negative effects. Regarding cold-related deaths, studies
have indicated that they might not decrease enough to compensate for a significant
increase in heat-related deaths. Even though higher levels of CO2 can act as a plant
fertilizer under some conditions, they do not necessarily benefit the planet, since
the fertilization effect can diminish after a few years in natural ecosystems as plants
acclimate. Furthermore, increased CO2 may benefit undesirable, weedy species
more than others.
MYTH: Society can easily adapt to climate change; after all, human civilization has
survived through climatic changes in the past.
FACT: While humans as a species have survived through past climatic changes, indi-
vidual civilizations have collapsed. Unless we limit GHGs in the atmosphere, we
will face a warming trend unseen since the beginning of human civilization. Many
densely populated areas, such as low-lying coastal zones, are highly vulnerable to
climate shifts. A middle-of-the-range projection indicates the homes of 13 to 88
million people would be flooded by the sea each year in the 2080s. Many ecosystems
and species already threatened by other human activities may be pushed to the point
of extinction.
MYTH: CO2 is removed from the atmosphere fairly quickly, so we can wait to take
action until after we start to see dangerous impacts from global warming.
FACT: Global warming cannot be halted quickly. CO2 and other GHGs can remain
in the atmosphere for many centuries. Even if emissions were eliminated today, it
would take centuries for the heat-trapping GHGs now in the atmosphere to fall to
pre-industrial levels. Only by starting to cut emissions now can humanity avoid the
increasingly dangerous and irreversible consequences of climate change.
viIntroduction
A vast majority of climate scientists agree that global warming is happening and that
it poses a serious threat to society. They also agree that it is being caused largely by
human activities that release greenhouse gases, such as burning fossil fuels in power
plants and cars and deforesting the land. This scientific consensus emerged gradually
over decades of research and debate. The current state of knowledge on climate is
summed up in the periodic reports of the Intergovernmental Panel on Climate
Change (IPCC), which are compiled by thousands of scientists. Unfortunately, much
of the American public remains unaware of this overwhelming scientific agreement.
Part of the blame for this lies with coordinated efforts within certain industries
to spread misinformation about global warming.
This report is intended to provide a comprehensive discussion of common myths
and misunderstandings regarding climate change. Our goal is to provide members of
Congress and their staff, journalists and the public with detailed, well-researched and
user-friendly information on these issues. This will allow readers to see that global
warming science is not split between two opposing camps, as the public may often
believe. Our rebuttals of myths are based on peer-reviewed, widely accepted scientific
publications, which are cited and listed at the end of the report. For a less technical
summary of only the most common myths, see the executive summary.1
1
This report will be updated in response to new developments. Suggestions for improvements and
additions are welcome. Please send suggestions to Dr. James Wang, Environmental Defense, 257
Park Ave. S., New York, NY 10010; jwang@environmentaldefense.org
1PART I
Is global warming happening?
MYTH #1: Winters have been getting colder; for example, the winter of 2003–2004 in the
northeastern U.S. was the coldest on record. Therefore global warming can’t be happening.
FACT: Winters have been getting warmer. Independent analyses of measurements
by different scientists show that the Earth’s climate has warmed overall over the past
century, in all seasons, and in most regions. (The studies are summarized in the Third
Assessment Report of the Intergovernmental Panel on Climate Change, 2001.)
The skeptics are doubly misleading when they bill the winter of 2003-2004 as
record cold in the northeastern U.S. and imply that it disproves global warming
predictions. While that winter was colder than average in the Northeast, it ranked as
only the 33rd coldest in that region since records began in 1896 (NCDC, Climate of
2004, 2004). January 2004, when the most severe cold of the season occurred, was the
11th coldest January in the Northeast. No all-time low temperature records were
broken in the Northeast that winter (NCDC, Climate of 2004, 2004). Only records
for a given day of the year, such as January 16th, were broken, which is nothing
unusual; the temperatures were not the coldest that had ever been experienced on any
day. This contrasts with the 2003 heat waves in Europe, during which many all-time
record high temperatures occurred (see Myth #5).
In addition, a single spell of cold weather in one small region is no indication that
the Earth’s climate is not warming. “Weather” refers to the atmospheric conditions at
a particular time and location, while “climate” refers to the long-term average weather
for a location. Scientists say that the Earth’s climate has been warming, since, on
average, temperatures have been increasing over a long period of time in most
regions. The global average temperature for January 2004 ranked as the fourth
warmest on record (NCDC, Climate of 2004, 2004), showing that colder-than-usual
weather was limited to a small area. Even with global warming, we will occasionally
experience an unusually cold winter somewhere on Earth, since weather varies
naturally from year to year and from place to place. But record-breaking cold is
expected to become less common as the climate continues to warm, shifting the
bounds within which weather fluctuates.
MYTH #2: Satellite measurements of temperature over the past two decades show a
much smaller warming a few miles above Earth’s surface than is measured by ther-
mometers at the surface.2 These observations show that computer climate models are
wrong, since they predict that increasing amounts of greenhouse gases should cause
slightly greater warming above the surface.
FACT: Recent research has corrected problems that led to underestimates of the
warming trend in earlier analyses of satellite data. The early work of Spencer and
Christy (1990), as well as subsequent revisions (Christy et al. 2003, and references
therein), found little or no warming in the troposphere based on satellite data.
Skeptics continue to cite these results.
But two recent studies made different corrections to those analyses which, when
added together, completely eliminate the discrepancy between climate models and
2
The region of the atmosphere examined in these satellite analyses, comprising the lowermost part
of the atmosphere, is known as the troposphere.
2observations. Mears et al. (2003), in a reanalysis of the satellite data, took into
account various difficulties in determining a temperature trend from weather
satellites. First, since no single satellite has been monitoring temperatures for a
long period of time, researchers have had to rely on combining data from different
satellites. However, different satellites have different instruments that need to be cali-
brated precisely against one another. Second, even one satellite may not produce con-
sistent measurements over time, since satellite orbits can drift. After accounting for
these factors, Mears et al. found a satellite temperature trend closer in size to the
surface trend than in previous studies.
Fu et al. (2004) found another major problem with previous analyses. Satellite data
that actually blend temperature readings in the stratosphere (the layer of atmosphere
above the troposphere) with those in the troposphere were previously misinterpreted
as representing only tropospheric temperatures. A strong cooling of the stratosphere
over the same time period partly cancels out the tropospheric warming in the satellite
measurements (the averaging of a warming trend and a cooling trend results in little
trend).3 Fu et al. isolated the portion of the data that represented just the troposphere,
and, accounting also for the corrections by Mears et al., found that the troposphere
warmed slightly more than the surface, exactly as models predict. This finding dispels
the notion that satellite data disprove the role of greenhouse gases in global warming.
Weather balloon measurements may also show a smaller tropospheric warming
trend than that observed at the surface. But here again, the interpretation of these
measurements suffers from difficulties, such as sparse spatial coverage and incon-
sistencies among instruments (Fu et al. 2004). So trends derived from balloon data
are not reliable.
MYTH #3: Even if Earth has been warming over the past century, it is nothing
unusual. For example, temperature reconstructions show that there was a period
known as the Medieval Warm Period, roughly from A.D. 1000 to 1400, that was
warmer than the 20th century. This means that the global warming we are experi-
encing now is part of a natural cycle.
FACT: Ten independent scientific studies have all found a large 20th-century
warming trend compared to other temperature changes over the past millennium
or two. (See Figure 1a.) Some of the studies carefully reconstructed a history of
temperatures across the globe over the past 1,000 years or more based on different
kinds of records (ice cores, tree rings, historical documents, etc.) The rest of the
studies calculated past temperature changes using climate models and an estimate
of how climatic factors such as sunlight, volcanic eruptions and greenhouse gases
changed over time.
Uncertainty exists as to exactly how warm the present is compared to the Medieval
Warm Period. Recently, von Storch et al. (2004) argued validly that the method used
in some temperature reconstruction studies may underestimate the magnitude of past
climate changes; however, the study does not answer the question of how warm the
Medieval Warm Period actually was. Further support for the idea of an unusual 20th
century warming is provided by a recent temperature reconstruction by Moberg et al.
(2005), who consciously avoided the method criticized by von Storch et al. Although
3
The cooling of the stratosphere was largely a result of ozone depletion caused by chloro-
fluorocarbons (CFCs) and other human-produced chemicals.
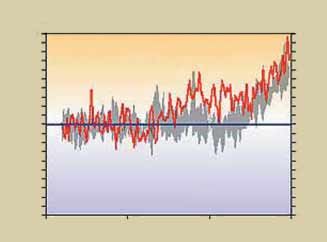
3FIGURE 1
Temperature trends for the Northern Hemisphere over the past
1,000–2,000 years.
0.8
Instrumental records/reconstructions
Instrumental record Simulations
0.6 Mann et al. 1999 with uncertainties Crowley EBM
Jones et al. scaled 1856-1980 Bauer et al. EBM
Crowley and Lowery Gerber et al.1.5CO2
0.4 Esper et al. scaled 1856-1980 Gerber et al. 2.5CO2
Mann et al. 2003 (gridded, area-weighted boreholes)
Mann et al. 2003 ("optimal" borehole reconstruction)
Temperature change (°C)
Mann and Jones with uncertainties
0.2 Briffa et al. scaled 1856-1980
0
–0.2
–0.4
–0.6
–0.8
200 400 600 800 1000 1200 1400 1600 1800 2000
Year A.D.
a) Comparison of various temperature reconstructions and model simulations for the
Northern Hemisphere (more data is available here than in the Southern Hemisphere)
for the last 2,000 years. All show anomalous warming in the 20th century.
Source: Mann et al. (2003a). Copyright 2003 American Geophysical Union. Reprinted by permission of
American Geophysical Union.
1.0
Instrumental data (AD 1902 to 1969)
Northern Hemisphere anomaly (°C) relative to 1961 to 1990
Reconstruction (AD 1000 to 1980)
Reconstruction (40-year smoothed)
Linear trend (AD 1000 to 1900) 1998 instrumental value
0.5
0.0
–0.5
–1.0
1000 1200 1400 1600 1800 2000
Year
b) Northern Hemisphere temperature changes over the past millennium based on
the work of Mann et al. (1999). The gray vertical lines represent the uncertainty (two
standard deviations).
Source: Reprinted with permission from the IPCC Third Assessment Report (2001).
4they find that the Medieval Warm Period may have been warmer than previously
estimated, they “find no evidence for any earlier periods in the last two millennia with
warmer conditions than the post-1990 period—in agreement with previous similar
studies.” In contrast to these two studies, a number of papers arguing for a very warm
Medieval Warm Period contain serious flaws. These include articles by Willie Soon
and Sallie Baliunas, and Stephen McIntyre and Ross McKitrick. See the box on “The
‘hockey stick’ controversy.”
But what if future research were to produce results drastically different from the
scientific studies to date, indicating with a high degree of certainty that the Medieval
Warm Period was warmer than the present? That would have very little impact on
the scientific case for a human cause of the current warming; whether or not the
Medieval Warm Period was warmer provides only one piece of evidence in deter-
mining what is causing the current warming. That there were warmer periods in the
past caused by natural factors (such as millions of years ago when tropical species
flourished in polar regions) is insufficient reason to assume that the current warming
also is natural. In fact, a whole body of studies separate from the ones discussed above
have focused on the physical factors potentially responsible for changing the climate
over the past 150 years, and they indicate with a high degree of confidence that most
of the warming over the past 50 years was caused by human-produced greenhouse
Whether or not gases. (See Myth #7.)
the Medieval Warm The current warming is unlikely to be entirely natural and inevitable. Humanity
Period was warmer largely controls how much climate change will unfold over the coming centuries.
than the present
MYTH #4: The Earth’s climate is self-regulating—natural control mechanisms prevent
provides only one very large swings. For example, Richard Lindzen claims that the Earth has a planetary
piece of evidence in “iris,” consisting of tropical cloud cover that expands or contracts to control the amount
determining what is of heat that escapes from the surface out to space (Lindzen et al. 2001).
causing the current FACT: The Earth’s climate actually has been very unstable in the distant past. There
warming. have been times, hundreds of millions of years ago, when much of the planet was
covered in ice. Tens of millions of years ago, tropical species flourished in polar
regions (such as during the era of the dinosaurs). A wealth of scientific evidence
indicates that the climate has changed significantly and abruptly (within one or a
few decades) numerous times in the past. (For a comprehensive review of
the literature on this subject, see the 2002 report by the National Academy
of Sciences.) While the climate has been relatively stable since human civilization
started around 10,000 years ago, the warming projected to occur over the next
century with unrestrained emissions of greenhouse gases is likely to exceed anything
seen in the last 10,000 years (IPCC 2001). This warming could cross certain
thresholds for abrupt climate change, triggering such dangerous events as a shutdown
of the ocean currents that supply nutrients to important fisheries and moderate the
climate in Europe and other regions (Sarmiento et al. 2004).
MYTH #5: Recent extreme events such as record heat waves, intense precipitation,
massive forest fires and worldwide coral bleaching have no link to climate change.
FACT: These recent events are all consistent with a warming world and can be
expected to occur more frequently with global warming.
Heat waves and extreme precipitation: Weather fluctuates naturally, resulting at
times in extreme events, even in the absence of climate change. However, the increase
5The “hockey stick” controversy
Many critiques by global warming skeptics have studies were misinterpreted by Soon and
focused on the work of one particular group Baliunas in a way that bolstered the authors’
of climate scientists, Dr. Michael Mann and thesis (Monastersky 2003).
colleagues. Their graph of temperature variations A paper published in 2003 by Stephen McIntyre
over the past 1,000 years (Mann et al. 1999) is and Ross McKitrick, claiming to be an audit of a
featured prominently in the 2001 Assessment study by Mann et al. (1998), used data from a
Report of the Intergovernmental Panel on corrupted electronic file, arbitrarily omitted 80%
Climate Change (IPCC). The temperature trend of the data before 1600, and replaced certain data
is often known as the “hockey stick” because of with incompatible data, artificially resulting in
its shape: nearly flat for most of the millennium temperatures during the 1400s that were warmer
and then a sharp upward turn in the 20th century than during the late 1900s (Rutherford et al., in
(see Figure 1b). In their critiques of Mann’s press, 2005). A paper published in 2005 by
findings, the skeptics claim that they have McIntyre and McKitrick claims that the hockey
weakened a primary pillar on which the IPCC’s stick pattern is an artificial result of the method
conclusions about human-produced warming used by Mann et al. rather than an unbiased
rest. That claim is incorrect. The truth is that compilation of the data. Mann et al. used a
other independent studies have found similar version of a method known as principal com-
temperature trends; the differences that do arise ponents analysis, which basically boils a large
do not affect the overall conclusion that 20th amount of data down to its main features, or
century warming is relatively large and long- “principal components.” One main problem with
lasting (see Figure 1a). Furthermore, how warm McIntyre and McKitrick’s critique is that they
the Medieval Warm Period was compared to the misunderstand why Mann et al. used principal
present, which is the focal point of the skeptics’ components analysis—Mann et al. used it to
critiques, is only a secondary piece of evidence summarize all the important features of the data,
for what is causing the present warming. The not to extract only the one chief feature. The
IPCC actually assessed an entirely different body reason McIntyre and McKitrick’s version of the
of studies to come to the conclusion that humans data doesn’t have a hockey stick pattern is that
caused most of the recent climatic change.4 they display only the first principal component,
Some of the analyses critiquing the work of omitting other critical principal components. In
Mann et al. have serious flaws. For example, a addition, scientists have shown that the hockey
pair of similar papers by Willie Soon and Sallie stick pattern emerges regardless of what version
Baliunas use subjective and unscientific methods of principal components analysis is used or even
to paint a picture of a Medieval Warm Period whether principal components analysis is used
that was much warmer than the present. A (Rutherford et al., in press, 2005).
rebuttal was published by thirteen climate Recently, von Storch et al. (2004) argued validly
scientists (Mann et al. 2003a, b). Soon and that the method used in Mann et al. and some
Baliunas use incorrect criteria for defining other temperature reconstruction studies may
past warm periods. They actually consider a underestimate the magnitude of past climate
period to be warm even if it was simply unusually changes, particularly the longer-lasting, century-
wet or dry, rather than basing their judgment scale changes such as during the Medieval Warm
strictly on direct indicators of temperature. The Period. But this paper provides no definitive
authors also consider the entire interval, A.D. answer as to how large the underestimates are
800–1300, to be warm, even though their data (Osborn and Briffa 2004). Also, the temperature
indicate that the warmth occurred only in reconstruction of Moberg et al. (2005), which
scattered regions at any given time. True global avoids the method criticized by von Storch et al.,
warming occurs when temperatures over large still provides no indication that there were any
areas increase simultaneously. Also, many periods in the past 2,000 years that were warmer
scientists have found that the results of their than the 1990s.
4
Chapter 2 in volume 1 (“The Scientific Basis”) of the Third Assessment Report describes the hockey stick, while Chapter 12 analyzes the causes
of climate change.
6in global average temperature over the past century, which constitutes a change
in climate, shifts the bounds within which weather fluctuates. This climate change
increases the likelihood that high temperature records will be broken and intense
precipitation events will occur. (Precipitation becomes more intense because higher
temperatures promote increased evaporation and thus higher moisture content in the
atmosphere.) In fact, some scientists estimate that human-produced greenhouse gases
have already at least doubled the chance of an extreme heat wave like the one that
scorched Europe in 2003 (Stott et al. 2004). According to measurements, precipi-
tation appears to have increased in intensity over recent decades, at least in certain
regions (IPCC 2001).
During the 2003 heat waves in Europe, many all-time high temperature records
were broken. The temperature surpassed 100°F in the United Kingdom for the first
time since records began (NCDC, Climate of 2003, 2004). Furthermore, the European
heat waves were part of an unusually warm summer overall, which appears to have
been the hottest in Europe in at least the last 500 years (Luterbacher et al. 2004).
Forest fires: Global warming is expected to cause, and may already have caused,
more severe droughts in many regions. The ongoing drought in the western U.S.,
possibly the worst in 500 years, may be caused by unusually warm waters in the
western Pacific and other effects of global warming (Cook et al. 2004; Hoerling and
Kumar 2003). Parched conditions and high temperatures associated with drought
create ideal conditions for wildfires to spread. Global warming also lengthens the fire
season and promotes outbreaks of tree-killing insects, which create a large amount of
dry fuel to stoke forest fires (ACIA 2004). The amount of forest burned annually has
been increasing over recent decades in some regions, such as the Arctic (ACIA 2004).
Alaska experienced its worst fire year ever in 2004, a year with the warmest and third
driest summer on record (NIFC 2004).
Coral bleaching: The incidence of large-scale coral “bleaching” events has increased
around the world since 1979, and most evidence indicates that these mass bleachings,
which can lead to coral death, are caused by global warming (Hoegh-Guldberg 1999).
An increase in water temperature causes coral bleaching, and the average surface
ocean temperature in many tropical regions rose by almost one degree C (1.8°F) over
the last century. In 1997–98, the largest bleaching event on record damaged 16% of
the reefs in the world and killed 1,000-year-old corals (Global Coral Reef Monitor-
ing Network 2004; Hoegh-Guldberg 1999).
7PART II
Is global warming being caused by human activities?
MYTH #6: The amount of carbon dioxide (CO2) generated by human activities is much
smaller than natural sources; therefore, human activities cannot be responsible for the
large observed increase in atmospheric CO2 over the past few centuries.
FACT: It is undisputed that humans are entirely responsible for the increase in
atmospheric CO2 over the past few centuries. In pre-industrial times, large natural
sources of CO2 were balanced by equally large natural removal processes, such as
photosynthesis in plants, maintaining a stable level of CO2 in the atmosphere for
thousands of years. Human-produced emissions, though smaller than natural
emissions, upset this balance. Because human-produced emissions aren’t completely
absorbed by natural processes, they accumulate in the atmosphere, increasing the
concentration of CO2 (McElroy 2002).
MYTH #7: The warming of the past century has been caused by natural factors, such as
solar variability, a recovery from the Little Ice Age, cosmic rays, etc.; the warming was
not caused by the increase in greenhouse gases (GHGs). This is shown by the fact that
the warming has not followed the trend of GHG concentrations.
FACT: While natural factors have been important causes of climatic changes in the
past, human-produced GHGs have become increasingly dominant over the last
century. Scientists know with certainty that GHGs have an important effect on
climate. GHG molecules absorb infrared radiation emitted by the Earth’s surface and
re-emit it downward, acting as a blanket that traps heat at the surface and warms the
planet. Without the naturally occurring “greenhouse effect,” the average temperature
of the Earth would be about 35°C (63°F) colder than at present, or an inhospitable
–20°C (–4°F) (McElroy 2002). The problem is that humans are increasing the amount
of GHGs in the atmosphere.
Scientists have conducted studies to calculate how much of the warming over the
past century was caused by GHGs as opposed to natural factors. When human
influences (including the effects of GHGs and cooling sulfate particles5) and natural
factors (including solar variations, volcanic eruptions and random variability) are both
taken into account in climate models, the simulated temperature changes over the
past 140 years agree closely with observed changes (see Figure 2). If, however, human
influences are omitted from the models, the simulated temperature changes do not
match the observed changes. These results provide strong evidence that human
influences have contributed to the observed warming. In fact, it is likely that human-
produced GHGs have been the dominant cause of the observed global warming over
the past few decades, as can be seen in Figure 2. Natural factors are unlikely to
explain the increased rate of warming since the middle of the 20th century, as the
overall trend in natural forcing (warming effect) was likely small or even negative
over the last two to four decades, according to measurements (IPCC 2001).
Trends of temperature vs. GHGs: It is true that temperatures have not strictly
followed the trend of GHGs—over the past century, temperatures first rose, then
fell slightly, then rose again, while GHGs rose steadily the entire time. But our
5
Human-produced sulfate particles originate primarily from the combustion of fossil fuels,
especially coal. Sulfate particles in the air reflect sunlight and cool the Earth.
8FIGURE 2
Comparison of modeled and observed temperature trends since 1860
Temperature anomalies in °C Temperature anomalies in °C Temperature anomalies in °C
1.0 1.0 1.0 1.0 1.0 1.0
(a) NATURAL FORCING ONLY (b) ANTHROPOGENIC FORCING (c) NATURAL + ANTHROPOGENIC
ONLY FORCING
0.5 0.5 0.5 0.5 0.5 0.5
0.0 0.0 0.0 0.0 0.0 0.0
–0.5 –0.5 –0.5 –0.5 –0.5 –0.5
Model results Model results Model results
Observations Observations Observations
–1.0 –1.0 –1.0 –1.0 –1.0 –1.0
1850 1900 1950 2000 1850 1900 1950 2000 1850 1900 1950 2000
Source: Figure adapted from IPCC (2001) by permission.
discussion in the previous paragraph provides an obvious explanation. There are
factors besides GHGs that affect climate, including natural forces and human-
produced sulfate emissions. Since these other factors changed over time, especially
early in the century, the pattern of observed temperature changes does not follow just
the trend of GHGs.
Solar variability and sunspots: Skeptics often claim that an increase in solar activity
and sunspots is responsible for most of the warming over the past century. (Sunspots
are small dark areas on the sun. The number of sunspots is higher during periods of
high solar activity and high overall sunlight intensity.) The fact is that direct satellite
measurements of solar intensity exhibit little or no trend over the past 25 years, a
time of rapid warming (IPCC 2001). Thus, changes in sunlight contributed little if
anything to recent warming. Changes in the sun are thought to have been an
important factor in climate change in the past, such as the first half of the 20th
century and the Little Ice Age.
Direct satellite
measurements Recovery from the Little Ice Age: Skeptics have claimed that the warming over the
20th century is simply a natural recovery from the Little Ice Age (roughly A.D.
of solar intensity
1600–1850), a cool period caused by changes in natural forces. The facts are similar
exhibit little or no
to what we have discussed above: Climate studies have taken into account all the
trend over the past major forces that can change the climate, and have shown that the warming over the
25 years, a time of second half of the 20th century can be explained only if GHGs are included. While
rapid warming. changes in sunlight and volcanic activity can possibly explain the transition into the
Little Ice Age, they cannot fully explain the warming since the end of the Little Ice
Age.
Cosmic rays: The purported correlations over recent decades and centuries between
the amount of cosmic rays hitting the Earth (which is influenced by fluctuations in
the solar wind) and cloudiness (which influences surface temperatures) appear to be
the result of incorrect treatment of data, as pointed out in a review paper by Laut
(2003). For example, the correction of a few erroneous data points removes much of
the correlation in several of the graphs that have brought attention to the issue of
cosmic rays. Furthermore, there is no proven physical mechanism connecting cosmic
rays to the amount of clouds in the atmosphere (Ramaswamy et al. 2001).
Shaviv and Veizer (2003) took a skeptical stance in arguing that the amount of
cosmic rays hitting the Earth is highly correlated with the Earth’s temperature over
time scales of hundreds of millions of years. From this result, the authors made a leap
9in logic and asserted that the current centuries-long increase in CO2 concentrations
due to human activities will have only a small warming effect.6 Also, Shaviv and
Veizer used questionable methods to obtain a high correlation between cosmic ray
flux and temperature (Rahmstorf et al. 2004). Furthermore, Royer et al. (2004)
found that the non-standard temperature history used by Shaviv and Veizer contained
major errors. Royer et al. conclude that there is no reason to revise the conventional
view that CO2 has had a dominant influence on climate variations over the past
545 million years.
MYTH #8: The global warming observed for the past century at Earth’s surface has been
caused by urbanization (urban heat island effect) and other changes in land surfaces,
such as deforestation, not greenhouse gases.
FACT: It is true that urbanization increases temperatures locally, and can potentially
affect the determination of the global trend, since some measurement sites are located
in urban areas. Buildings and pavement absorb sunlight, heating up their
surroundings, and dense human settlements release significant amounts of waste
heat. Urban and agricultural areas also replace trees, which cool the Earth’s surface by
providing shade and evaporating water drawn up from the soil. But the claim that the
observed increase in global average temperature is due to these changes in land
surfaces is wrong, since the analyses showing the warming account for and remove
any biases caused by urbanization (for example Hansen et al. 1999; Jones et al. 2001).
In any case, it has been shown that urbanization has had an insignificant effect on
global and even regional temperature trends (Peterson 2003). In addition,
temperatures have risen significantly over oceans as well as over land, providing
further evidence that changes in land surfaces are not the primary cause of the
observed warming.7
6
One major flaw in the analysis of Shaviv and Veizer is that the averaging of the data over very
long intervals of 50 million years removes information on shorter-term fluctuations in CO2 and
temperature, such as the high correlation between CO2 and temperature over the past 400,000
years. Thus, it is no wonder that they calculated a weak response of temperature to changes in
CO2.
7
The warming has been less over oceans than over land, but the size of the land-ocean contrast
agrees quite well with what models predict will occur with increasing greenhouse gases (for
example, Karoly et al. 2003).
10PART III
Can we have any confidence in predictions of future
climate change?
MYTH #9: Models have trouble predicting the weather a few days in advance. What
makes us think we can predict the climate many years in advance?
FACT: Climate prediction is different from weather prediction. For example, although
it is notoriously difficult to predict if it will rain on any particular day at a specific
location, scientists can predict with near certainty that on average, at high latitudes
of the Northern Hemisphere, it will be colder in December than in July. Climate
models are now sophisticated enough to be able to recreate past global mean climates,
including climate change over the last 100 years, with reasonable accuracy. Finally,
climate assessments usually report results from a range of models that represent the
boundaries of scientific projections. (For example, they report the least that global
average temperature is likely to change, and the most). All this adds to our confi-
dence that projections of future climate over broad regions are increasingly reliable.
MYTH #10: Climate models have many flaws and cannot even simulate past climate
changes properly, making them useless in predicting global warming.
FACT: Computer models are an integral part of climate science, as well as many
other fields of science, such as astrophysics and biomedicine. Climate models consist
of mathematical representations of physical, chemical and biological processes. The
first models to simulate the effects of increasing GHGs on climate were developed
in the 1960s (e.g. Manabe and Wetherald 1967), and climate models have improved
steadily ever since. They include more and more processes, rely on fewer approxi-
mations or parameterizations (simplifications), and achieve better spatial resolution
(in other words, models compute the climate from place to place in greater and
greater detail, like using “zoomed in” maps rather than less detailed ones) (IPCC
2001). State-of-the-art statistical techniques are used in evaluating model results.
Recent models have demonstrated the ability to reproduce the climate changes
observed over the past century (see Figure 2) as well as over other periods. Thus,
scientists are increasingly confident in the models’ ability to project many of the key
features of future climate over broad regions. Modeling studies are regularly pub-
lished in peer-reviewed scientific journals and subject to intensive examination.
Assessments such as those conducted by the Intergovernmental Panel on Climate
Change (IPCC) recognize that “no single model can be considered ‘best’ and it is
important to utilize results from a range of coupled models.” The models represented
in the IPCC Third Assessment Report were developed by separate research groups in
the United States, the United Kingdom, Germany, Japan, France, Canada, Australia,
China and Switzerland. The 1.4 to 5.8°C (2.5–10.4°F) range for projected warming
over the next century reflects the results from the various models, taking into
consideration a wide range of scenarios for future emissions.
MYTH #11: Ian Castles and David Henderson, as well as Bjorn Lomborg, claim
that the growth of emissions in the scenarios chosen for the 2001 IPCC assessment is
unrealistically high. For example, the growth of CO2 emissions in the 1990s fell below
the IPCC projections. Also, most of the scenarios involve significant increases in
11methane (CH4) over the next century, whereas recent observations indicate that CH4
has stopped increasing. Lomborg claims that solar and other renewable sources of energy
will dominate the market within decades with minimal policy intervention, and that
therefore all but the lowest-emission IPCC scenarios are unlikely.
FACT: It is unrealistic to write off scenarios designed for 100-year analysis based on
comparison with 10 years of data. Short-term fluctuations in economic activity are
bound to happen. The economic downturn in transition economies during the past
decade and the recession in Asia in the late 1990s slowed the growth of CO2 and
CH4 emissions (for example, Streets et al. 2001; Wang et al. 2004).8 (Of course,
GHG emissions do not always vary in lock-step with economic activity—if an
economy improves its energy efficiency and increases the use of renewable energy,
GHG emissions can fall as the economy grows. The IPCC scenarios do assume
various levels of increases in energy efficiency and renewables over time.)
Furthermore, model analyses indicate that the rate of chemical removal of CH4 from
the atmosphere has increased over the past decade, further slowing the increase in
CH4 concentrations. But this trend may be temporary.9
Castles and Henderson argue that the use of market exchange rates (MER) rather
than purchasing power parities (PPP) leads to an overestimate of GDP and emissions
for developing countries in the IPCC projections. But Nakicenovic et al. (2003) reply
that both PPP and MER were used in the scenarios development, with little
difference in results between the two methods at the end of the 21st century.
Contrary to Lomborg’s claim, a transition from a fossil fuel-based economy to an
economy based on renewable energy will not happen automatically. It would take
political action to significantly restructure energy systems in a way that would
guarantee timely and significant reductions in GHG emissions. Thus, those IPCC
scenarios with higher emissions represent a real possibility.
MYTH #12: Just a few decades ago, scientists warned that a new ice age was
approaching or that pollutant dust would cool the climate. What makes scientists think
they are right this time?
FACT: Climate science has come a long way since those early studies. Advances have
been made in theory, modeling and paleoclimate (climate in the distant past)
analysis. Even when the idea of a globally cooling climate was being considered,
many scientists warned about the consequences of GHG emissions; they just weren’t
sure which effect would win out—warming due to GHGs or cooling due to
particulates that reflect sunlight. Although particulates do have a significant effect on
climate in many regions, we now know that overall, the effect of human-produced
GHGs is dominant.
8
In addition, reports by the government of China of decreases in coal use in the late 1990s may
have been inaccurate, as suggested by the subsequent report of a 28% increase in coal use from
2001 to 2002. That inaccuracy may have contributed to an underestimate of global growth in
CO2 emissions.
9
The increased removal of atmospheric CH4 over the past decade appears to have been driven
largely by depletion of the stratospheric ozone layer, according to some analyses (for example,
Wang et al., 2004). Because the ozone layer is expected to recover within several decades in
response to the Montreal Protocol ban on substances that deplete ozone, the recent increase in
the removal of atmospheric CH4 is probably temporary.
12MYTH #13: The science behind the theory of global warming is too uncertain to draw
conclusions useful to policy making.
FACT: Uncertainties are an inherent part of scientific knowledge. However, some
findings about global warming are certain:
• The basic physics of the greenhouse effect is well understood. That there has been a
dramatic increase in the concentrations of GHGs since pre-industrial times, and
that the increase is caused by human activities, is undisputed (IPCC 2001).
• That the global average surface temperature has increased by about 0.6 ± 0.2°C (1.1
± 0.4°F) in the past century is certain (IPCC 2001).
• It is likely that natural factors alone cannot explain the warming observed over the
past 50 years. Human-produced GHGs are likely to have been the dominant
contributor to this warming (IPCC 2001).
The primary scientific debate is about how much and how fast, rather than
whether, additional warming will occur as a result of human-produced GHG
emissions. This idea is expressed in assessments published recently by the IPCC,
the U.S. National Academy of Sciences, the American Geophysical Union and the
American Meteorological Society.
Uncertainty applies to both ends of the climate spectrum—catastrophic climate
Uncertainty applies surprises are as likely to occur as much smaller-than-expected changes.
to both ends of the In matters other than climate change, policy decisions based on uncertain infor-
climate spectrum. mation are made routinely by governments to insure against undesirable outcomes.
For example, the nations of the world came together to ratify the Montreal Protocol,
which resulted in a ban on chemicals that deplete the ozone layer, in order to protect
against the threat of increased incidence of skin cancer, even while scientists were
learning more about the threat. Countries including the United States banned
imports of meat from other countries in which mad cow disease (bovine spongiform
encephalitis) occurred, even though the vast majority of cattle in the afflicted coun-
tries were healthy. The reason immediate action is warranted in the case of global
warming is that the climate system and economic systems need time to adjust.
Climate changes occur with a delay but continue inexorably: Emissions in the near
future will continue to warm the climate for many decades and to increase sea level
for centuries. Slowing the growth of emissions will take time, given the large number
of emitters across the world and the typically long replacement times for infra-
structure such as power plants. We may have only a narrow window of time, perhaps
a decade or so, to act before the levels of emissions reductions needed to prevent
dangerous and irreversible climatic changes become prohibitively expensive (O’Neill
and Oppenheimer 2002). One of the uses of science is providing society with early
warnings on potentially dangerous occurrences. In most cases, it is not possible to
obtain complete knowledge of a threat before it is too late to stop it. In the case of
global warming, scientists have given society an early warning, loud and clear, on its
possibly dangerous, irreversible and widespread impacts.
13PART IV
How harmful would the predicted warming be?
MYTH #14: The IPCC predicts an increase in global average temperature of only
1.4–5.8°C (2.5–10.4°F) over the next century. This small change, less than the
current daily temperature range for many locations, is hardly a cause for concern.
FACT: Global average temperature generally varies little over time. Projected
warming would be much larger and faster than anything that has occurred over
the past 10,000 years (IPCC 2001). The difference in average temperature
between the last major ice age and the present is only about 5°C (9°F); during
that period, ice a kilometer thick covered much of North America as far south as
New York City. Future warming would be greater at higher latitudes (closer to the
poles) and over continents than for the global average. In several decades, the
climate of Boston, Massachusetts, might resemble that of present-day Raleigh,
North Carolina.
MYTH #15: Global warming and increased CO2 would be beneficial, moderating the
climate in cold regions, reducing cold-related deaths, and increasing plant growth
(“greening the Earth”).
FACT: A small amount of warming may benefit limited areas. But if society does
not make an immediate effort to limit further warming, the beneficial effects
probably would be heavily outweighed by negative effects. Likely effects include
increases in heat waves, flooding rainstorms, droughts, forest fires, and species
extinctions. Coastal flooding due to rising sea levels would affect 13 to 88 million
people across the globe each year (IPCC 2001; McLean et al. 2001). A lower
probability exists that warming could trigger abrupt climate changes with
catastrophic effects, such as a shutdown of the ocean currents that moderate the
climate in Europe and other regions (NAS 2002; Sarmiento et al. 2004), and a rapid
break-up of huge ice sheets in Greenland and Antarctica, leading to a dramatic rise
in sea level (NAS 2002).
Studies have indicated that increases in average temperature would significantly
increase the number of heat-related deaths but might not decrease cold-related
deaths enough to compensate (McGeehin and Mirabelli 2001; Kalkstein and
Greene 1997). Current mortality rates are generally higher in the winter than in
the summer, but changes in mortality rates with global warming are expected to be
smaller for winter. The reason is that cold-related mortality is complex and not as
strongly tied to the severity of the cold as heat-related mortality is tied to the severity
of the heat. For example, hypothermia (a life-threatening drop in body temperature)
occurs in warmer regions of the United States as well as in colder ones, and can
occur at temperatures above freezing (McGeehin and Mirabelli 2001). Also, a
large portion of cold-related deaths involves respiratory illnesses, which are also
influenced by factors other than temperature, such as people’s degree of confinement
indoors. In fact, there does not appear to be a detectable correlation between the
number of influenza cases and monthly temperature in the winter (Kalkstein and
Greene 1997).
Increasing the amount of CO2 in the air can enhance plant growth under certain
conditions; this is referred to as the “CO2 fertilization effect.” But higher CO2
does not necessarily benefit the planet: Experiments have shown that in natural
14ecosystems, the CO2 fertilization effect can diminish after a few years, as the plants
acclimate to the higher CO2 levels (Ainsworth et al. 2003; Temperton et al. 2003).
Furthermore, elevated CO2 may benefit certain types of plants (such as invasive
weeds) but not others, potentially resulting in the elimination of certain species
through competition.
15PART V
What should we do about global warming?
MYTH #16: Society can easily adapt to climate change; after all, human civilization has
survived through climatic changes in the past. We should put our resources into adapting
to, rather than preventing, climate change.
FACT: While humans as a species have survived through past climatic changes,
individual civilizations have collapsed. Many climate and archeological studies
provide firm evidence that the demise of various civilizations, including the Classic
Maya, Mochica and Anasazi in the Americas and the Akkadian in Mesopotamia, was
due at least in part to climatic shifts including prolonged droughts (deMenocal
2001). If global warming is allowed to continue unrestrained, the rate and amount of
warming may exceed anything seen in the last 10,000 years, the period during which
human civilization has existed (IPCC 2001).
A warming in the middle of the range of IPCC projections would have significant
impacts on many sectors of the economy—agriculture, water supply, coastal and
Arctic infrastructure, etc. Even more troubling, there might be increased loss of lives
due to heat waves, storms, floods, famine in developing countries and smog-induced
respiratory diseases (higher temperatures promote the formation of ozone smog). By
the 2080s, the number of people in the world flooded by coastal storm surges in a
typical year could be more than five times higher than today, even if protective
measures are included (McLean et al. 2001). The above impacts would occur even
with moderate, gradual climate change. Obviously, larger or abrupt climate change
Natural ecosystems
would have even more severe consequences.
may not have the Poorer countries may not have the resources to adapt. Adaptation measures
capacity to adapt for sea-level rise alone may cost several percent of GDP for certain developing
to rapid climate countries and small island nations (McLean et al. 2001), and would be infeasible
change. for many of the latter. Climate change would likely exacerbate economic and political
problems. Disasters spawned by global warming could create many refugees,
affecting both developed and developing countries. Increased scarcity of resources
such as water and food could lead to conflicts across borders that might have broad
ripple effects.
Natural ecosystems may not have the capacity to adapt to rapid climate change,
especially when combined with other human activities already affecting them.
MYTH #17: Forests in the Northern Hemisphere are absorbing as much CO2 as is
emitted through the burning of fossil fuels. Therefore, it is developing countries in the
south that are to blame for increasing CO2.
FACT: The absorption of CO2 by forests in the Northern Hemisphere is not large
enough to completely offset fossil fuel emissions from that hemisphere. For example,
one reliable estimate places the U.S. carbon uptake at 0.30 to 0.58 billion metric tons
of carbon per year (Pacala et al. 2001), while U.S. fossil fuel emissions are around
1.5 billion metric tons per year.
The carbon uptake in the Northern Hemisphere is thought to arise largely
from regrowth on previously deforested land. It would be counterproductive to give
northern countries credit for this carbon “sink,” which is simply reabsorption of some
of the CO2 that accumulated in the atmosphere as a result of past deforestation.
16You can also read