The Manufacturing Industry in Turkey

Page created by Chris Tucker
 
CONTINUE READING
The Manufacturing Industry in Turkey
The Manufacturing
                                        Industry in Turkey

                     January 2014

Investment Support and Promotion Agency of Turkey            1
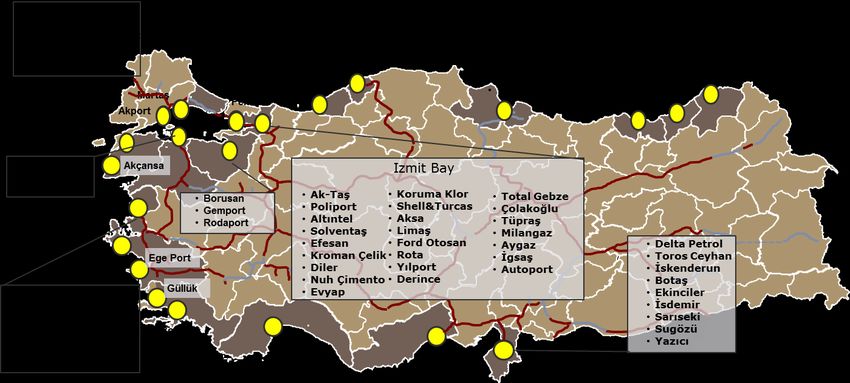
The Manufacturing Industry in Turkey
Disclaimer

Republic of Turkey Prime Ministry Investment Support and Promotion Agency (ISPAT) submits the information
provided by third parties in good faith. ISPAT has no obligation to check and examine this information and takes no
responsibility for any misstatement or false declaration. ISPAT does not guarantee the accuracy, currency,
reliability, correctness or legality of any information provided by third parties. ISPAT accepts no responsibility for
the content of any information, news or article in the document and cannot be considered as approving any opinion
declared by third parties. ISPAT explicitly states that; it is not liable for any loss, negligence, tort or other damages
caused by actions and agreements based on the information provided by third parties.

Deloitte accepts no liability to any party who is shown or gains access to this document. The opinions expressed in
this report are based on Deloitte Consulting’s judgment and analysis of key factors. However, the actual operation
and results of the analyzed sector may differ from those projected herein. Deloitte does not warrant that actual
results will be the same as the projected results. Neither Deloitte nor any individuals signing or associated with this
report shall be required by reason of this report to give further consultation, to provide testimony or appear in
court or other legal proceedings, unless specific arrangements thereof have been made. All opinions and estimates
included in this report constitute our judgment as of this date and are subject to change without notice and may
become outdated.

       Investment Support and Promotion Agency of Turkey                                                                                               2
                                                                                   ©2014 Deloitte Turkey. Member of Deloitte Touche Tohmatsu Limited
The Manufacturing Industry in Turkey
Glossary of Terms

Acronym         Definition                                   Acronym             Definition
ACP            The African, Caribbean and Pacific Group of   ICT                Information and Communications
               States                                                           Technology
ARI            Advanced Research and Innovation              IMF                International Monetary Fund
BMI            Business Monitor International                INSEAD             European Institute of Business
BR             Brazil                                                           Administration
CAGR           Compound Annual Growth Rate                   ISO                Istanbul Chamber of Industry
CBRT           Central Bank of the Republic of Turkey        IT (Country        Italy
CEO            Chief Executive Officer                       Code)
CIS            Commonwealth of Independent States            IT                 Information Technology
CT             Communications Technology                     İTU                Istanbul Technical University
CZ             Czech Republic                                LCV                Light Commercial Vehicle
DE             Germany                                       LED                Light Emitting Diode
EC             European Community                            M&A                Mergers and Acquisition
EFTA           European Free Trade Association               NL                 Netherlands
EIU            Economist Intelligence Unit                   N/A                Not Available
EMI            Emerging Markets Insight                      OECD               Organization for Economic Co-operation
ES             Spain                                                            and Development
EU             European Union                                OIZ                Organized Industrial Zones
EUR            Euro                                          OSTIM              Middle Eastern Industry and Trade
EUROMED        Euro-Mediterranean Partnership                                   Center
FDI            Foreign Direct Investment                     ÖSYM               Turkish Student Evaluation, Selection
FOB            Free On Board                                                    and Placement Center
FR             France                                        P&G                Procter & Gamble
FTA            Free Trade Agreements
                                                             PIP                Project Inventive Premium
GDP            Gross Domestic Product
                                                             PISA               Program for International Student
GE             General Electric
                                                                                Assessment
               Global Manufacturing Competitiveness
                                                             PL                 Poland
GMCI           Index
                                                             PPP                Purchasing Power Parity
IASP           International Association of Science Parks
      Investment Support and Promotion Agency of Turkey                                                                                    3
                                                                       ©2014 Deloitte Turkey. Member of Deloitte Touche Tohmatsu Limited
The Manufacturing Industry in Turkey
Glossary of Terms

Acronym       Definition
PMI          Purchasing Managers’ Index
R&D      Research and Development
RU       Russian Federation
RUSF     Resource Utilization Support Fund
SAN-TEZ  Industrial Thesis Program
SME      Small-Medium Enterprises
SSI      Social Security Institution
TCDD     Turkish State Railways
TDZ      Technology Development Zones
         Union of Chambers and Commodity
TOBB     Exchanges of Turkey
         The Scientific and Technological Research
TÜBITAK Council of Turkey
TÜLOMSAŞ Turkish Locomotive & Engine Industries
Turkstat Turkish Statistical Institute
UAE      United Arab Emirates
UK       United Kingdom
         United Nations Industrial Development
UNIDO    Organization
UNSD     United Nations Static Division
USA      United States of America
USD      United States Dollar
VAT      Value Added Tax
VTS      Vocational Training School
WEO      World Economic Outlook

      Investment Support and Promotion Agency of Turkey                                                                       4
                                                          ©2014 Deloitte Turkey. Member of Deloitte Touche Tohmatsu Limited
The Manufacturing Industry in Turkey
Table of Contents

Executive Summary                                 6         iii. Competitiveness of the
                                                                                                               36-48
                                                            Industry
     A. Overview of the Industry in Turkey        7-25
                                                            iv. Government Incentives                          49-50
       i. A Brief Macroeconomic Outlook of
                                                  8-10    A. Analysis of the Manufacturing
       Turkey
                                                                                                               51-84
                                                          Industry’s Sub-Sectors
       ii. A Glance at the Manufacturing
                                                  11-15     i. Overview of the Manufacturing
       Industry in Turkey                                                                                      52
                                                             Industry in Turkey
       iii. A General Overview of Foreign
       Trade in the       Manufacturing           16-20     ii. Pharmaceutical Manufacturing                   53-56
       Sector
                                                            iii. Food and Beverage
                                                                                                               57-61
        vi. Overview of Disposable Income                    Manufacturing
       in Turkey and Neighboring                  21-22
                                                            iv. Automotive Manufacturing                       62-66
       Countries
                                                            v. Machinery and Equipment
       v. FDI in Turkey                           23-25                                                        67-71
                                                            Manufacturing
     B. The Competitiveness of Turkey’s                     vi. Chemical Manufacturing
                                                  26-50                                                        72-75
     Manufacturing Sector
                                                            vii. Textile Manufacturing                         76-80
       i. Turkey’s 2023 Targets                   27-29
                                                            viii. Durable Consumer Goods
       ii. Availability of Factors of                                                                          81-84
                                                  30-35     Manufacturing
          Production and Costs

   Investment Support and Promotion Agency of Turkey
                                                            ©2014 Deloitte Turkey. Member of Deloitte Touche Tohmatsu Limited
                                                                                                                                5
Executive Summary

• Turkey has shown robust macroeconomic growth in                  • Students graduating from manufacturing-related
  recent years thanks to the government’s growth                     departments in universities numbered over 32,000
  program and is expected to show continuous                         in 2012, while there were more than 35,000
  growth. The Economist Intelligence Unit (EUI)                      graduates from vocational training schools
  expects an annual average growth rate in real GDP                  during the same period.
  to be around 5% until 2017. Moreover, OECD
                                                                   • According to the Ministry of Economy, Turkey has
  forecasts a real GDP growth of 3.8% in 2014 and
                                                                     Free Trade Agreements with 19 countries and
  4.1% in 2015.
                                                                     has started negotiations with another 13
• The manufacturing industry is one of the main                      countries. There are also 19 free trade zones in
  drivers of the Turkish economy, accounting for                     Turkey which enable corporate, income and
  24.2% of total GDP. According to Turkstat,                         customs tax, VAT and RUSF exemptions, along
  Turkey’s   manufacturing    industry  has   been                   with many other opportunities.
  increasing at a CAGR of 12% since 2003,
                                                                   • The Turkish investment incentive program provides
  exceeding the growth levels of the gross domestic
                                                                     varying tax reductions between 15-65%
  product and reached TL 220 billion in 2012.
                                                                     depending on investment region and scale and
• According to the World Bank, Turkey’s per capita                   social security support for 2 to 12 years
  household final consumption expenditure reached                    depending on region.
  USD 5,900 in 2011. Turkey’s increasing level of
                                                                   • Total R&D expenditures exceeded TL 11 billion in
  disposable income and the high disposable income
                                                                     2011, according to Turkstat.
  levels of its export partners – mostly EU countries,
  which exceeded USD 15 billion – make Turkey an                   • Turkey’s 2023 goals include reaching certain
  attractive investment destination.                                 benchmarks for exports in various sub-sectors,
                                                                     including:    machinery    (USD   100  billion),
• Turkey’s has a young and extremely large
                                                                     chemicals (USD 50 billion), textiles (USD 20
  workforce – 7.5 million people between the ages of
                                                                     billion), automotive industry (USD 75 billion),
  24 and 34 – with competitive wage rates of USD
                                                                     and electronics (USD 45 billion).
  572* per month as of October 2013.
    * Converted using 31 October EUR/USD exchange rate of 1.3672

    Investment Support and Promotion Agency of Turkey
                                                                            ©2014 Deloitte Turkey. Member of Deloitte Touche Tohmatsu Limited
                                                                                                                                                6
A. Overview of the Industry in
   Turkey
i.     A Brief Macroeconomic Outlook of Turkey

ii.    A Glance at the Manufacturing Industry in Turkey

iii. A General Overview of Foreign Trade in the Manufacturing Sector

iv. Overview of Disposable Income in Turkey and Neighboring Countries

v.     Overview of Logistics in Turkey

vi. FDI in Turkey

      Investment Support and Promotion Agency of Turkey   ©2014 Deloitte Turkey. Member of Deloitte Touche Tohmatsu Limited
                                                                                                                              7
Turkey’s fast-growing economy is expected to attract
more investment in the future

• Turkey      has  undergone    profound   economic       Figure 1: GDP Growth Rate (Constant Prices)
  transformation over the last decade and its
  economic foundation is quite solid. It is the 16th
                                                          9%
  largest economy in the world, in purchasing power
  parity terms and the 6th largest economy in Europe
  with a current GDP of approximately USD 786             4%                                                                 EIU*
  billion in 2012.
• Having boomed as fast as 9.3% and 8.8% in real          -1%
  terms in 2010 and 2011 respectively, EIU projects
  that Turkey is expected to grow by 3.5% in 2013,        -6%
  4.9% in 2014, 5.1% in 2015, 5.0% in 2016 and
  4.9% in 2017. OECD also projects a positive
  outlook for the Turkish economy with a 3.8%
                                                           Source: Turkstat, EIU
  growth rate in 2014 and 4.1% growth rate in 2015.        f: forecast

• Monetary policy played a vital role in reining in        Figure 2: Inflation, 2004-2012
  inflation over recent years. The rate of inflation in
                                                          15%
  Turkey has stayed under 10% since 2004 and
  year-end inflation was capped as 6.2% in 2012.          12%
  EIU forecasts that the average inflation rate will
  further ease to 4% by 2018.                              9%

                                                           6%

                                                           3%

                                                           0%
                                                             2004 2005 2006 2007 2008 2009 2010 2011 2012
                                                          Source: Turkstat

    Investment Support and Promotion Agency of Turkey
                                                                             ©2014 Deloitte Turkey. Member of Deloitte Touche Tohmatsu Limited
                                                                                                                                                 8
Capitalizing on its economic policies, the investment
 environment in Turkey has become more welcoming to
 foreign investors
 Figure 3: The Central Bank of the Republic of
                                                                  • The overnight lending rates have steadily decreased
 Turkey O/N Interest Rates
                                                                    over the years and were around 7.5% in September
 60%                                                                2013, which is a 500 basis point decrease from 2002.
                                                                  • Fitch Ratings announced Turkey’s investment grade
 50%
                                                                    rating as BBB in November 2012 and Standard &
 40%                                                                Poor’s announced a rating of BB+ in March 2013.
                                                                    These events signal further upgrades and are
 30%                                                                expected to boost the inflow of institutional funding.
 20%                                                              • Moody's raised Turkish government bond ratings to
                                                                    Baa3 and revised its outlook to stable from positive in
 10%                                                                May 2013.
  0%

                                                               Table 1: Turkey’s Credit Ratings

                     Borrowing        Lending                               Rating    Outlook                   Rating            Outlook
Source: CBRT                                                                (Local     (Local                  (Foreign           (Foreign
                                                                           Currency) Currency)                Currency)           Currency
                                                          Standard
                                                                                BBB            Stable              BB+              Stable
                                                          & Poor’s
                                                          Fitch                 BBB            Stable             BBB-              Stable

                                                          Moody’s              Baa3            Stable              Ba1             Positive

                                                          JCR                  BBB-            Stable             BBB-              Stable

                                                          Source: Moody’s (May 2013), S&P (March 2013), Fitch (December 2013), JCR (May2013)

      Investment Support and Promotion Agency of Turkey
                                                                               ©2014 Deloitte Turkey. Member of Deloitte Touche Tohmatsu Limited
                                                                                                                                                   9
Overall, Turkey is 69th in Doing Business 2014 Report

• Foreign Direct Investment Law in Turkey – which            • According to Doing Business 2014 report by the
  complies with international standards- came into             World Bank, Turkey is ranked 69th among 189
  force in 2003. The objective of this Law is to               countries on the ease of doing business.
  regulate the principles to encourage foreign direct
                                                             • Turkey has a higher ranking compared to BRIC
  investments; to protect the rights of foreign
                                                               countries. The averages of Eastern & Central Asia
  investors; to define investment and investor in line
                                                               and Middle East & North Africa are ranked 71st and
  with international standards; to establish a
                                                               107th respectively, below the rank of Turkey.
  notification-based system for foreign direct
  investments rather than screening and approval;            Figure 4: Ease of Doing Business Analysis
  and to increase foreign direct investments through         Ranking, 2014
  established policies.
                                                                                      Turkey               69
• With this law, unless stipulated by international
  agreements and other special laws:                         Regional Average (Eastern
                                                                                                           71
                                                              Europe & Central Asia)
 1. Foreign investors are        free   to   make direct
    investments in Turkey,                                                          Romania                73

 2. Foreign investors shall be subject to equal                       Russian Federation                    92
    treatment with domestic investors.
• As a result, the number of expats has increased                                      China                 96
  significantly. According to the Ministry of Labor and
                                                              Regional Average (Middle
  Social Security, number of work permits given to                                                              107
                                                                East & North Africa)
  foreigners increased by 86% in 2012 reaching
  32,272. Since 2003 a total of 125,697 permits                                         Brazil                  116
  were provided to foreigners.
                                                                                         India                    134
• It is also crucial to note that the availability of free
  transfer of funds in Turkey adds positively to its
                                                                                                 0              50        100          150
  investment friendly environment.
                                                             Source: Doing Business 2014, The World Bank

    Investment Support and Promotion Agency of Turkey
                                                                            ©2014 Deloitte Turkey. Member of Deloitte Touche Tohmatsu Limited
                                                                                                                                                10
The impact of manufacturing within Turkey’s economy
   is rapidly increasing as the economy continues to grow

Figure 5: The Size of the Manufacturing Industry
                                                                                 • Strong growth in manufacturing industry was
in Turkey, (in 1998 Constant Prices)
                                                                                   accompanied by strong growth in the overall
         40                                                           24,5%        economy. The growth in manufacturing in the last
                                       CAGR
                                        6%                                         2 years was 10% and 2%, respectively.
                                                                      24,0%
                                                                                • Turkey achieved a respectable manufacturing
 TL Billion

                                                                                  output growth rate of 4% in the first quarter of
                                                                      23,5%
                                                                                  2013, where industrialized countries suffered
         20
                                                                                  significantly. According to UNIDO, manufacturing
                                                                      23,0%
                                                                                  output dropped by 2.9% in the Eurozone during
                                                                                  the same period. Manufacturing output fell by
                                                                      22,5%
                                                                                  2.6% in the Czech Republic and 3.1% in Russia,
                                                                                  while it increased slightly in Brazil with 1.4% and in
              0                                                       22,0%
                                                                                  India with 2.5%.
                                                                               Figure 6: Growth Rates of GDP
                               Size of Manufacturing Industry                    14,5%
                                                                                 12,0%
                               Sectorial share of GDP                             9,5%
Source: Turkstat
                                                                                  7,0%
   • The manufacturing industry has a significant share                           4,5%
     in Turkey’s economy with a 24.4% share and a
                                                                                  2,0%
     total of more than TL 29 billion, in constant
                                                                                 -0,5%
     prices, in 2012. The industry has been one of the
                                                                                 -3,0%
     main drivers of the Turkish economy.
                                                                                 -5,5%
   • After the 2009 global economic recession, the                               -8,0%
     industry recovered quickly and exceeded pre-crisis                                          2007     2008       2009       2010       2011        2012
     levels with a CAGR of 8% from 2009 to 2012.
                                                                                                            Manufacturing              GDP
                                                                              Source: Turkstat

                  Investment Support and Promotion Agency of Turkey
                                                                                                 ©2014 Deloitte Turkey. Member of Deloitte Touche Tohmatsu Limited
                                                                                                                                                                     11
Strong growth has been accompanied by an increase in
 production and exports in turn

Figure 7: The Industrial Production Index                               Figure 8: Total Manufacturing Exports, 2007-2012
(2010=100), 2005 - 2012 (Gross Indices)

  115                                                                                 150
                                                                  113
  110                                                       111

                                                                        USD Billion
  105                                                                                 100
  100                         100                    100
                                     98
   95                 94                                                               50
   90
            87                               87
   85                                                                                   0
   80                                                                                       2007      2008       2009       2010       2011       2012
   75
                                                                                                                   Export        Import
    2005           2006    2007   2008    2009    2010   2011   2012
Source: Turkstat                                                        Source: Turkstat

 • The manufacturing industry has grown since the                              • Strengthened production within the manufacturing
   economic crisis in 2009, as seen in the graph                                 industry is manifested by an increasing number of
   above.                                                                        exports. Exports grew by a CAGR of 7% from
                                                                                 2007 to 2012 and 13% from the previous year to
 • Turkey’s geographic proximity to Europe, Asia,
                                                                                 more than USD 143 billion. An analysis of
   the Commonwealth of Independent States
                                                                                 Turkey’s manufacturing export data in 2012
   (CIS), Middle Eastern and North African
                                                                                 reveals that the manufacture of basic metals had
   countries make it a trade hub and an attractive
                                                                                 the highest share in total manufacturing exports
   base for production for manufacturing companies.
                                                                                 with 20%, followed by textiles and apparel with
                                                                                 18%.
                                                                               • Turkey’s imports grew a CAGR 5.6% from 2007 to
                                                                                 2012 to more than USD 176 billion.
        Investment Support and Promotion Agency of Turkey
                                                                                             ©2014 Deloitte Turkey. Member of Deloitte Touche Tohmatsu Limited
                                                                                                                                                                 12
Turkey’s manufacturing industry as a whole is
          outpacing such countries as Russia, the Ukraine and
          Romania…
Figure 9: Competitive Industrial Performance
                                    2.500                                                     The industrialization intensity
                                                                                              index measures the share of the
Manufacturing Export

                                    2.000
                                                                    Romania
                                                                                              manufacturing industry’s value
                       per Capita

                                    1.500
                                                            Russia
                                                                          Turkey              added to the GDP. According to
                                    1.000                            Ukraine                  UNIDO, Turkey scored 0.5 in
                                                           Brazil
                                      500
                                                                               India
                                                                                              industrial intensity. Moreover,
                                        0                                                     Turkey’s share in total exports
                                            0        0,2            0,4          0,6    0,8

                                                       Industrialization Intensity Index
                                                                                              for the manufacturing sector
Source: UNIDO
Note: The size of the bubble represents the share in world manufacturing exports.
                                                                                              was 0.9% in 2010 and
(2010)
                                                                                              manufacturing export per
                                                                                              capita was more than USD
                                                                                              1,200.
                                    Investment Support and Promotion Agency of Turkey
                                                                                                     ©2014 Deloitte Turkey. Member of Deloitte Touche Tohmatsu Limited
                                                                                                                                                                         13
…and is expected to continue to grow in the future

 Figure 10: Global Manufacturing Competitiveness                       • The Global Manufacturing Competitiveness
 Index, 2013                                                             Index (GMCI) shows the rankings in terms of
10                                                                       current and future manufacturing competitiveness.
                                                                         The ranking is done through a survey of CEOs
      7.98          DE
                                     7.89          BR                    taken by Deloitte.
                                     7.82           DE                 • According to expectations, Turkey will move up
      7.13          BR
                                                                         from 20th position in 2013 to 16th position within
                                                                         the next five years. The country’s manufacturing
                                                                         competitiveness ranking is bound to improve
                                     5.99           TR                   because of the government’s recent initiative to
      5.87          PL                                                   boost employment levels and its ability to leverage
      5.81          UK                                                   potential in alternative energy generation as well
                                                                         as within R&D and production.
      5.71          CZ
                                     5.69           PL                 • The factors in Turkey’s favor for improving
      5.61          TR
                                     5.59           UK                   manufacturing competitiveness in the future are:
      5.27          NL                                                     – low corporate tax rates,
                                     5.23          CZ
                                                                           – low labor costs and
                                     5.04          RU
      4.64          FR                                                     – a high growth rate for per capita personal
                                                                           disposable income.
      4.35          RU
                                                                       • Turkey’s strategic central location, extensive trade
      3.75          IT                                                   relationships, an abundance of available labor, and
      3.66          ES               3.58           ES                   policies that enable the increasing of manufacturing
3                                                   IT
                                                                         competitiveness could further elevate Turkey’s
                                     3.45
                                                                         positioning.
                 2013                  in the next five years
                                                                          Investment Tip: CEOs believe that Turkey
 Source: Deloitte Global Manufacturing Competitiveness Index, INSEAD
                                                                           will become a major global player in the
                                                                                           manufacturing industry.
         Investment Support and Promotion Agency of Turkey
                                                                                 ©2014 Deloitte Turkey. Member of Deloitte Touche Tohmatsu Limited
                                                                                                                                                     14
Gross profit margins in the manufacturing industry
 remained stable in the recent years

Figure 11: Gross Profit Margins in Manufacturing                                                           • The overall profit margins in
20%                                                                                                          the industry remained stable in
                                                                                                             the last five years.
15%
                                                                                                           • While      the    pharmaceutical
                                                                                                             industry suffered a sharp fall, it
10%                                                                                                          still remains the most profitable
                  15,41%                    14,91%                 14,09%                 14,48%             sector among its peers with a
  5%                                                                                                         profit margin of 26% in 2011.
                                                                                                             The      profit   margins      for
                                                                                                             machinery and chemicals were
  0%                                                                                                         as high as 20%, while the
                    2008                     2009                      2010                2011              consumer              electronics,
Source: CBRT, Deloitte Analysis
                                                                                                             automotive        and       textile
Figure 12: Profit Margins in Manufacturing Sub-Sectors                                                       industries enjoyed increases in
40%                                                                                                          their profit margins finishing
             2008       2009      2010     2011
                                                                                                             with 19.5%, 11% and 15%
                                                                                                             growth respectively in 2011.
30%

20%

10%

 0%
            Food                         Chemicals               Automotive               Textile

                          Beverage                   Pharmaceuticals          Machinery
        Source: CBRT, Deloitte Analys
        Investment Support and Promotion Agency of Turkey
                                                                                             ©2014 Deloitte Turkey. Member of Deloitte Touche Tohmatsu Limited
                                                                                                                                                                 15
Another advantage of Turkey is ease of trade. The trade
  volume for the manufacturing industry surpassed USD
  319 billion in 2012
Figure 13: Total Manufacturing Exports by                                                                 Figure 14: Total Manufacturing Imports by
Country, 2012                                                                                             Country, 2012
                                                                                           200

        Other                                                                                                                                          Other
                                                                                           150                                                         41%
        49%
                                      Germany

                                                                             USD Billion
                                          9%                                                                                                                                      China
                                              Iraq                                                                                                                                12%
                                              7%                                           100
                                            Iran                                                                                              UK
                                                                                                                                                                             Germany
                                            7%                                                                                                3%                               12%
                                                                                                                                              South
                                              UK                                            50                                                Korea
USA                                                                                                                                                                       Italy
                                              6%                                                                                               3%    Spain
4%Russia                                            UAE                                                                                         India 3%                   8%
                  Italy France                                                                                                                                         Russia
      4%           4%     4%                        6%                                                                                           3%                     5% USA
                                                                                                                                                       France
                                                                                             0                                                           5%                   5%
                                                                                                         2012
                                                                                                     Export   Import
Source: Turkstat (ISIC Rev 3 Codes 15, 16,17,18,19, 20, 21, 22, 23, 24, 25, 26, 27, 28, 29,30, 31, 32, 33, 34, 35, 36 ), Deloitte Analysis,

  • Turkey uses its geographic advantage in manufacturing, exporting to a diverse range of countries from Europe
    to the Middle East. Germany is Turkey’s leading export partner constituting 9% of total exports followed by Iraq
    and Iran with a 7% share each.
  • The top two countries Turkey imports from are China and Germany with a little more than 12% each, followed
    by Italy with 8% and Russia with 5%.

         Investment Support and Promotion Agency of Turkey
                                                                                                                              ©2014 Deloitte Turkey. Member of Deloitte Touche Tohmatsu Limited
                                                                                                                                                                                                  16
Turkey is a regional hub and will expand its trade
volume because of its advantageous geographical
positioning
• Turkey is situated between Europe and Asia, allowing the country to create a link between three continents with
  over 1.5 billion people and a GDP of USD 25 trillion.
• As major airway hubs in the region, Istanbul and Ankara airports provide a practical route of travel with a
  maximum 4-hour direct flight to the capital cities in Europe, Western & Central Asia, the Middle East and Africa.
• Turkey’s geographical location and logistics capabilities, its unique positioning at the intersection of trade routes
  and its rapidly progressing investment climate are the major factors contributing to Turkey’s strategic and
  regional importance.
Figure 15: Turkey’s Geographical Positioning                     Table 2: Turkey’s Total Foreign Trade Volume
                                                                 by Region

                                                                                                                   Trade Volume
                                                                                 Regions
                                                                                                                   (USD billion)
                                                                  Free Zones in Turkey                                     3.34
                                                                  Europe (EU)                                            146.65
                                                                  Europe (Non-EU)                                         51.78
                                                                  North America                                           21.75
                                                                  Central & South America                                  8.11
                                                                  Middle & Near East                                      63.86
                                                                  Africa                                                  19.28
                                                                  Asia & Pacific                                          61.53
                                                                  Other                                                   12.71
                                                                  Total                                                  389.01

                                                Investment Tip: Acceleration in Turkish foreign trade with
                                                   neighboring as well as distant countries underlines the
                                                            importance of Turkey as a major trade route.
                                                                                                         Source: Turkstat, Deloitte Analysis

     Investment Support and Promotion Agency of Turkey
                                                                          ©2014 Deloitte Turkey. Member of Deloitte Touche Tohmatsu Limited
                                                                                                                                               17
Moreover, trade volume is likely to continue expanding
because of Turkey’s trade relationships with the
European Union and its partners
• To accelerate growth in exports, Turkey              Table 3: Trade between EU 28 Countries and
  derives trade benefits from the following            Turkey
  partnerships:                                                                                                       Export
• The European Community (EC) - Turkey                                                                                Import
                                                                                    The EU 28
  Customs Union:                                                                    CAGR: -1.4%
                                                                                    CAGR: 3.3%
     – The      EC-Turkey     Customs    Union                       100,0

                                                            USD Billion
       facilitates the free movement of goods,
       which eliminates customs duties and
       quantitative restrictions on industrial                            50,0
       products and processed agricultural
       products between the two parties.                                   0,0
     – The free movement of goods does not                                       2008 2009 2010 2011 2012
       apply to agricultural products and coal
       & steel products, which are subject
       only to preferential treatment.
• Euro-Mediterranean                 Partnership
  (EUROMED):
     – Turkey is a member of EUROMED,
                                                                                                           Source: Turkstat, Deloitte Analysis
       which promotes economic integration
       and democratic reform across 16
       neighboring nations of the EU in North
       Africa and the Middle East.

   Investment Support and Promotion Agency of Turkey
                                                                           ©2014 Deloitte Turkey. Member of Deloitte Touche Tohmatsu Limited
                                                                                                                                                 18
Turkey has taken crucial steps to increase Free Trade
Agreements all around the world
                                                      • Turkey negotiates agreements with countries that participate in
                                                        EU free trade agreements.
                                                      • FTAs support the development of Turkey’s trading activities
                                                        with neighboring countries and creates a level playing field for
                                                        Turkish exporters.
                                                      • Turkey does not have to sign FTAs with the same requirements
                                                        as the EU and is free to tailor its own agreements with third
                                                        party countries.
                                                      • As of 2012, Turkey has FTAs with 19* countries. These
                                                        countries include: the European Free Trade Association (EFTA),
                                                        Macedonia, Bosnia-Herzegovina, Albania, Israel, Palestine,
 Selected Countries in Negotiations with                Morocco, Tunisia, Egypt, Georgia, Serbia, Montenegro, Chile,
 Turkey for FTAs                                        Jordan, South Korea and Mauritius. The top countries that
                                                        Turkey exports to are Egypt, with a total amount of USD 3.7
                                                        billion, followed by the ETFA countries with USD 2.6 billion of
                                                        exports, followed by Israel with USD 2.3 billion, and Morrocco
                                                        with USD 1 billion.
                                                      • Also it is important to note that there are a total of 13
                                                        countries/country blocks that Turkey has started FTA
                                                        negotiations. These countries include the following: the
 Selected Countries Falling Under Turkey’s
 FTA Negotiation Initiative
                                                        Ukraine, Colombia, Ecuador, Malaysia, Moldova, the Democratic
                                                        Republic of the Congo, Ghana, Cameroon, the Seychelles, the
                                                        Gulf Cooperation Council, Libya and the Faroe Islands
                                                      • Additionally, Turkey has launched initiatives to start
                                                        negotiations with the USA, Canada, Japan, Thailand, India,
                                                        Indonesia, Vietnam, Peru, the Central American countries,
                                                        other ACP countries, Algeria, Mexico, Singapore and South
                                                        Africa.
                                                                                                                Source: Ministry of Economy
                                                                           * Including EFTA: Iceland, Liechtenstein, Norway and Switzerland

  Investment Support and Promotion Agency of Turkey
                                                                            ©2014 Deloitte Turkey. Member of Deloitte Touche Tohmatsu Limited
                                                                                                                                                19
The industry will also benefit from Turkey’s growing
            disposable income as well as that of its export partner

                                                                                                         Household Final                   8-year CAGR of
Figure 16: Turkey’s Attractiveness in the Local Market and
                                                                                                         Consumption                      Household Final
Export Markets                                                                                           Expenditure per                     Consumption
                            90.000                                                                       Capita*                              Expenditure
                                                                                                       Azerbaijan, 839**
Cumulative per Capita USD

                            80.000                                                                                                        Azerbaijan: 7%
                                                                                                       Ukraine, 1,679
                            70.000                                                                                                         Ukraine: 11%
                                                                                                       Germany, 20,850
                            60.000                                                                     Romania, 3,280                      Romania: 1%
                                                                                                       Czech Republic, 6,949              Czech Republic:
                            50.000
                                                                                                       Poland, 6,298                            2%
                            40.000                                                                                                          Poland: 4%
                                                                                                       UAE, 13,700
                            30.000                                                                     Russia, 4,019                         UAE: -8%
                                                                                                       Turkey, 5,857
                            20.000
                                                                                                                                            Russia: 8%
                            10.000                                                                     France, 19,985
                                                                                                                                           Turkey: 4%
                                0
                                2004       2005      2006      2007      2008     2009   2010   2011                                        France: 1%
            Source: World Bank, Deloitte Analysis
            * Constant 2005 USD
            ** 2010 data

        • Turkey’s vibrant domestic consumer base make it an attractive market for the manufacturing industry.
        • Moreover, Turkey’s largest export market, the EU, already has significant spending power and has established a
          middle-class consumer base that demands high-quality goods. However, the EU is not the only significant trade
          partner, other trade partners such as Azerbaijan, Russia and the Ukraine have also managed to increase their
          household final consumption expenditure per capita from 2003 to 2011, thus opening the door for Turkish
          exports.

                              Investment Support and Promotion Agency of Turkey
                                                                                                ©2014 Deloitte Turkey. Member of Deloitte Touche Tohmatsu Limited
                                                                                                                                                                    20
Its heavy investment on infrastructure will create
effective links spanning Europe to Asia and Russia to
Africa
• According      to    the    Global    Manufacturing    Table 4: Targeted Transport Areas for 2023
  Competitiveness Index, physical infrastructure is
  vital for decreasing costs and increasing efficiency         Domestic
  as well as improving productivity. Therefore,                Passenger                          2010                        2023
  Turkey aims to ramp up not only traditional                  Transport
  infrastructure (e.g. roads, ports and bridges), but
  also to increase advanced technology investments        Highway                               89.59%                        72%
  (e.g. information and communications technology)        Railway                                2.22%                        10%
  in order to remain globally competitive.
                                                          Airway                                 7.82%                        14%
• Some of the major infrastructure projects include:
                                                          Seaway                                 0.37%                        4%
      • The 3rd Bosphorus Bridge (Yavuz Sultan
        Selim Bridge) Project
      • The new airport project, which will be
        constructed on the European side of                  Domestic
        Istanbul                                                                                  2010                        2023
                                                          Freight Carriage
      • The Marmaray Project, which will connect
                                                          Highway                               80.63%                        60%
        the Asian side of Istanbul to the European
        side via an underground railway tunnel            Railway                                4.76%                        15%
      • Increasing the length of high-speed railway       Airway                                 0.44%                        1%
        from 888 km to 10,000 km (with a CAGR of
                                                          Seaway                                 2.66%                        10%
        25%)
                                                          Pipeline                              11.51%                        14%
      • According to the Ministry of Transport,
        Maritime      Affairs and   Communications’
        Strategy Plan, the Ministry’s goal is to grow
        the      information   and    communication      Source: Ministry of Transport, Maritime Affairs and Communications
        technology sector to a size of USD 160
        billion.
    Investment Support and Promotion Agency of Turkey
                                                                          ©2014 Deloitte Turkey. Member of Deloitte Touche Tohmatsu Limited
                                                                                                                                              21
Turkey has extensive infrastructure as ports are
connected to railways

Figure 17: Ports and Railways in Turkey

                                                                            Railroads
                                                               Ports             Improved
                                                                                 Plans for Improvement
                                                          Source: Ministry of Transport, Maritime Affairs and Communications

    Investment Support and Promotion Agency of Turkey
                                                        ©2014 Deloitte Turkey. Member of Deloitte Touche Tohmatsu Limited
                                                                                                                               22
Foreign investors noting the number of opportunities
  have already invested in Turkey’s manufacturing
  industry
Figure 18: FDI in Manufacturing                                        Figure 19: Types of FDI in Manufacturing
                 4,5                                                                                          Branch
                                                                                                                1%
                                                                                              Subsidiary
                                                                                                 7%
   USD Billion

                 3,0

                                                                                     New
                 1,5                                                             Investments
                                                                                     92%

                 0,0
                        2008      2009      2010      2011      2012
Source: Ministry of Economy

 • The manufacturing industry has garnered great interest from foreign investors over recent years with FDI in
   2012 surpassing USD 4.3 billion.
 • 319 foreign investors made investments in Turkey. According to the Ministry of Economy, 36 of these
   investments were above USD 500,000; 30 of them were between USD 200,000-500,000 and 253 of them
   were less than USD 200,000.

                 Investment Support and Promotion Agency of Turkey
                                                                                ©2014 Deloitte Turkey. Member of Deloitte Touche Tohmatsu Limited
                                                                                                                                                    23
There have been numerous M&A deals in 2012…

Table 5: M&As in the Manufacturing Sector in 2012
                                                                                                                                        Deal Value
           Acquirer                             Origin             Target                 Sector                        Stake
                                                                                                                                       (USD million)
                                                                                          Paper & Paper
Dunapack                                         Austria           Dentaş Ambalaj                                       79.3%                   110
                                                                                          Products
                                                                                          Rubber and Plastic
Nitto Denko                                      Japan             Bento Bantçılık                                      100%                    100
                                                                                          Products
                                                                                          Paper & Paper
International Paper                                USA             Olmuksa                                              43.7%                    56
                                                                                          Products
                                                                                          Medical, Precision
                                                                                          and Optical
Essilor International                            France            Işbir Optik                                           70%                     45
                                                                                          Instruments,
                                                                                          Watches

Universe Capital Partners                          USA             Transtürk Holding      Textile & Apparel               N/A                    27

                                                                                          Electrical Machinery
Gemalto                                          France            Plastikkart                                          14.3%                     7
                                                                                          and Apparatus
                                                                                          Rubber and Plastic
Eaton Corporation                                  USA             Polimer Kauçuk                                       100%                    N/A
                                                                                          Products

Asda Stores                                         UK             Gaat                   Textile & Apparel             100%                    N/A

                                                                                          Electrical Machinery
Johnson Controls                                   USA             Karat Güç Sistemleri                                  49%                    N/A
                                                                                          and Apparatus
                                                                                          Electrical Machinery
Imtech                                       Netherlands           AE Arma Elektropanç                                   80%                    N/A
                                                                                          and Apparatus

     Source: Deloitte Annual Turkish M&A Review, Deloitte Analysis
     Note: Turkstat USTS codes were used in sector specific classification.

      Investment Support and Promotion Agency of Turkey
                                                                                               ©2014 Deloitte Turkey. Member of Deloitte Touche Tohmatsu Limited
                                                                                                                                                                   24
… with considerable FDI in manufacturing industry

Table 6: M&As in the Manufacturing Sector in 2012

                                                                                                                                      Deal Value
            Acquirer                              Origin            Target               Sector                     Stake
                                                                                                                                     (USD million)
                                                                                         Manufacture of
ADM                                            Hong Kong            Cevher Jant                                     46,2%                    N/A
                                                                                         Basic Metals
                                                                                         Paper and Paper
Silgan                                              USA             Öntaş Teneke                                     100%                    N/A
                                                                                         Products
                                                                                         Electrical
Atlas Copco                                      Sweden             Ekomak               Machinery and               100%                    N/A
                                                                                         Apparatus
                                                                                         Textile & Wearing
Universe Capital Partners                           USA             Idaş                                              N/A                    N/A
                                                                                         Apparel
                                                                                         Electrical
Systemair                                        Sweden             HSK                  Machinery and                70%                    N/A
                                                                                         Apparatus
                                                                                         Electrical
Assa Abloy                                       Sweden             Sekotek Elektronik   Machinery and               100%                    N/A
                                                                                         Apparatus
                                                                                         Medical, Precision
                                                                                         and Optical
Essilor International                             France            Ipek Optik                                        70%                    N/A
                                                                                         Instruments,
                                                                                         Watches
                                                                                         Medical, Precision
                                                                                         and Optical
Essilor International                             France            Opak Optik                                        51%                    N/A
                                                                                         Instruments,
                                                                                         Watches
      Source: Deloitte Annual Turkish M&A Review, Deloitte Analysis
      Note: Turkstat USTS codes were used in sector specific classification.

      Investment Support and Promotion Agency of Turkey
                                                                                             ©2014 Deloitte Turkey. Member of Deloitte Touche Tohmatsu Limited
                                                                                                                                                                 25
B. The Competitiveness of Turkey’s
   Manufacturing Industry
i.    Turkey’s 2023 Targets

ii.   Availability of Factors of Production and Costs

iii. Competitiveness of the Industry

iv. Government Incentives

      Investment Support and Promotion Agency of Turkey   ©2014 Deloitte Turkey. Member of Deloitte Touche Tohmatsu Limited
                                                                                                                              26
Turkey has ambitious 2023 targets in each sub-sector
of manufacturing
Table 7: Turkey’s 2023 Targets
Manufacturing                  Industry Goals                                 Export Goals
Industry
Machinery and                 • Create      custom-designed, • Turkey’s 2023 export goals for machinery is USD 100 billion,
Equipment                       high-quality, affordable and   securing a 2.63% share of the global machinery market. The sector
Manufacturing                   environmentally       friendly aims to provide 18.34% of Turkey’s total exports. The sub-sector’s
                                products                       quantitative export targets for 2023 can be summarized as follows:
                              • Create joint R&D                centers             • power generating machinery and equipment totaling
                                while    increasing                R&D                USD 31 billion
                                spending
                                                                                    • special machinery and equipment                         for     specific
                              • Become    the     preferred                           industries totaling USD 24 billion
                                machine manufacturer in the
                                                                                    • metal processing machines totaling USD 13 billion
                                world
                                                                                    • industrial machinery equipment and parts totaling USD
                                                                                      33 billion

Chemicals                     • Develop new      and special • Turkey’s 2023 export goal for chemical manufacturing is USD 50
Manufacturing                   products with    high value-   billion, securing a 0.79% share of the global chemical market. The
                                added features                 sector aims cover 9.17% of Turkey’s total exports. The sub-sector’s
                                                               quantitative export targets for the industry can be summarized as
                              • Establish new brands
                                                               follows:
                                                                                    • organic and inorganic chemicals totaling USD 5.9
                                                                                      billion
                                                                                    • mineral fuels and mineral oils totaling USD 11.7 billion
                                                                                    • paints and raw materials totaling USD 2.5 billion
                                                                                    • soaps-detergents-cosmetics totaling USD 3.3 billion
                                                                                    • plastic and rubber products totaling USD 23.3 billion
   Source: Turkish Exporters’ Assembly, Source: Ministry of Science, Industry and
   Technology                                                                       • pharmaceuticals totaling USD 3.3 billion
     Investment Support and Promotion Agency of Turkey
                                                                                                 ©2014 Deloitte Turkey. Member of Deloitte Touche Tohmatsu Limited
                                                                                                                                                                     27
And offers a transparent investment environment

Manufacturing          Industry Goals                            Export Goals
Industry
Electricity and        • Changing Turkey’s status in the • Turkey’s 2023 export goal for electronics is USD 45 billion,
Electronics              sector from implementing existing securing a 0.64% share of the global market. The sector aims
Manufacturing            technologies to producing new     to provide 8.25% of Turkey’s total exports. The sub-sector’s
                         technologies                      quantitative targets can be summarized as follows:
                       • Promoting      R&D         activities            • electricity and energy totaling USD 14.9 billion
                         concerning   medical    electronics,
                                                                          • electronic devices and components totaling USD
                         LED, wind and solar energy
                                                                            14.9 billion
                       • Increasing investments to improve
                                                                          • appliances and other devices totaling USD 10.6
                         environmentally            friendly
                                                                            billion
                         technologies
                                                                          • information and communication                            technologies
                                                                            totaling USD 0.5 billion
                                                                          • other instruments and apparatuses totaling USD
                                                                            4.1 billion
Furniture              • Produce    original,   high     quality • Turkey’s 2023 export goal for wood and wood products is
Manufacturing            designs                                   USD 16 billion, securing a 1.6% share of the global market.
                                                                   The sector aims to represent 2.93% of Turkey’s total exports.
                                                                   Turkey aims for furniture export to bring in revenue of USD 6
                                                                   billion by 2023.

                                                                  Source: Turkish Exporters’ Assembly, Source: Ministry of Science, Industry and Technology

     Investment Support and Promotion Agency of Turkey
                                                                                      ©2014 Deloitte Turkey. Member of Deloitte Touche Tohmatsu Limited
                                                                                                                                                              28
It will remain an attractive candidate for investment

Manufacturing      Industry Goals                        Export Goals
Industry
Textile           • Boosting     productivity  with • Turkey’s 2023 export goal for textiles is USD 20 billion, securing a
Manufacturing       modernization and restructuring   3.6% share of the global textile market. The sector aims to cover
                    of production capacity            3.67% of Turkey’s total exports by 2023, with the following targets:
                  • Focusing on high value-added              • fiber and yarn totaling USD 2.5 billion
                    specialty   fiber  and   yarn
                                                              • woven fabric totaling USD 5 billion,
                    production through the use of
                    new technologies                          • knitted fabrics totaling USD 3.5 billion,
                  • Focusing on technological textiles        • technical textiles and                   non-woven           surface        fabrics
                    and multifunctional products with           totaling USD 4 billion,
                    the R&D orks
                                                              • textiles for the home totaling USD 4 billion
                                                              • other textiles totaling USD 1 billion.
Automotive        • Finding alternative uses for steel • Turkey’s 2023 export goal for land vehicles is USD 75 billion,
Manufacturing       so as to customize and enhance       securing a 2.4% share of the global market. The sector aims to be
                    its use.                             13.76% of Turkey’s total exports, with the following targets:
                  • Accelerating the transition from          • passenger vehicles totaling USD 31.3 billion
                    low value-added products to high
                                                              • motor vehicles for transportation of goods totaling
                    value-added products
                                                                USD 22.5 billion
                  • Improving the infrastructure for
                                                              • motor vehicles for the transportation of 10+ people
                    the local supplies
                                                                totaling USD 7.5 billion
                  • Improvingthe export potential of
                                                              • spare-parts-chassis-body totaling USD 12 billion,
                    all products
                                                              • motorcycle-bicycle-seat for invalids USD 1.67 billion,
                                                              • trailers and semi-trailers totaling USD 1.5 billion.
                                                              Source: Turkish Exporters’ Assembly, Source: Ministry of Science, Industry and Technology

    Investment Support and Promotion Agency of Turkey
                                                                                  ©2014 Deloitte Turkey. Member of Deloitte Touche Tohmatsu Limited
                                                                                                                                                          29
Turkey has stronger numbers than most peer country
  averages according to the 2013 Global Manufacturing
  Competitiveness Index
Table 8: Key Statistics of Turkey
  Supplemental Data Analysis: Key Statistics                                                                                    Turkey                      Peer Average
  Manufacturing GDP CAGR (2005–2010)                                                                                                3.8%                                   2.9%

  Manufacturing GDP/Percentage of Total GDP (2010)                                                                                 17.8%                                  18.3%

  Labor Costs (USD/hour) (2011)                                                                                                        3.2                                   21.9

  Manufacturing Exports/Percentage of Total Exports (2011)                                                                         77.3%                                  59.9%

  Manufacturing Jobs Created per Hundred Persons (2001–2010)                                                                           1.1                                   -0.8

  Highest Corporate Tax Rate (2012)                                                                                                20.0%                                  26.2%

  Researchers per Million Population (INSEAD 2012)                                                                               1,592.8                                2,980.0

  Per Capita Personal Disposable Income (USD) (2011)                                                                                7,797                                15,886

  Per Capita Personal Disposable Income CAGR (2001–2011)                                                                           14.1%                                   8.5%
Source: 2013 Global Manufacturing Competitiveness Index, Deloitte Analysis
Note: Peer countries include China, Germany, the USA, India, South Korea, Taiwan, Canada, Brazil, Singapore, Japan, Thailand, Mexico, Malaysia, Poland, the UK, Australia, Indonesia,
Vietnam, Czech Republic, Turkey, Sweden, Switzerland, the Netherlands, South Africa, France, Argentina, Belgium, Russia, Romania, the UAE, Colombia, Italy, Spain, Saudi Arabia,
Portugal, Egypt, Greece, and Ireland.

 • Turkey’s manufacturing GDP achieved a 3.8% CAGR for the period of 2005-10 compared to the peer
   countries’ average of 2.9%. In 2011, the country’s manufacturing sector share in total exports was 77.3%
   compared to the peer countries’ average of 59.9%. This strong performance is an indicator of strong growth
   and developing potential.
 • Given the manufacturing industries’ contribution to Turkey’s GDP is slightly below the peer countries’ average
   and per capita personal disposable income is well below the peer average, Turkey still has significant room for
   manufacturing growth.

         Investment Support and Promotion Agency of Turkey
                                                                                                               ©2014 Deloitte Turkey. Member of Deloitte Touche Tohmatsu Limited
                                                                                                                                                                                        30
A positive outlook on the human resources side - young
                 and cost-effective labor

     Figure 20: Employed Population, 2012                                                    • Turkey’s workforce is one of the youngest and
                                                                                               largest in Europe, with the necessary with the
                      8                                                         35%            necessary education, skills, knowledge, expertise
                                                     30%                        30%            and performance.
Million People

                      6                                    27%                  25%          • More than 65% of the population is aged
                                                                                20%            between 24 and 54, which is a huge economic
                      4                                          18%
                                           15%                                  15%            advantage for Turkey.
                      2                                                         10%
                                                                       8%                    • According to the Central Bank of Turkey, the
                                                                                5%             manufacturing industry generated 11% more
                                                                             3%
                      0                                                         0%             employment opportunities between 2009 and
                                      15-24   24-34    35-44 45-54 55-64  65+                  2012, employing more than 4.5 million people in
                                           Number of People         Employment Rate            2012.
       Source: Euromonitor                                                                   • Moreover, Turkey has one of the lowest minimum
       Figure 21: Number of Employees in                                                       wage rates in Europe with USD 572* per month in
       Manufacturing, 2009-2012                                                                October 2013.
                                     4,6
                 Million Employees

                                     4,4

                                                                                            Investment Tip: Many executives are aware
                                     4,2                                                     of the impact they can have because of the
                                                                                   4,5
                                                           4,4         4,4                       availability and cost of Turkey’s highly-
                                     4,0                                                                                skilled workforce.
                                              4,0
                                     3,8
                                                                                         Source: Eurostat
                                              2009         2010       2011        2012   *Converted using 31 October EUR/USD exchange rate of 1.3672.
       Source: CBRT

                                     Investment Support and Promotion Agency of Turkey
                                                                                                            ©2014 Deloitte Turkey. Member of Deloitte Touche Tohmatsu Limited
                                                                                                                                                                                31
Turkey provides a superior, skilled workforce dedicated
 to improving the manufacturing industry…

 Figure 22: 2011-2012 Manufacturing Related Graduates in              • There were a total of more than 68,000
 Turkey                                                                 students that graduated from vocational
                                                                        training schools and universities in the
                                                   3.601     68.249
70.000                               28.800                             2011-2012 academic year. These students
60.000                                                                  are trained and educated in Turkey’s
50.000                                                                  premium universities specifically training for
                   35.848                                               manufacturing and manufacturing-related
40.000
30.000                                                                  industries. They then become a part of
20.000                                                                  Turkey’s growing manufacturing industry.
10.000                                                                • Turkey is continuing to put emphasis on
     0                                                                  education to improve the quality on its
                    VTS*          Undergraduate   Graduate    Total     workforce. There are many departments
Source: ÖSYM, Deloitte Analysis                                         that are specifically designed to teach both
* Vocational Training Schools                                           theoretical    and     applied     work      in
                                                                        manufacturing. The departments related to
                                                                        the manufacturing industry include: textile
                                                                        manufacturing,            electric-electronics,
                                                                        chemical    engineering,       manufacturing
                                                                        engineering, petroleum studies, industrial
                                                                        studies, mechatronics and the like.

        Investment Support and Promotion Agency of Turkey
                                                                        ©2014 Deloitte Turkey. Member of Deloitte Touche Tohmatsu Limited
                                                                                                                                            32
…and easy access to talent

Figure 23: Snapshot of Key Factors for Talent               • The quantitative metrics indicated in Figure 24
                                                              provides a picture of the talent and capabilities of
                                                              Turkey. In this regard, Turkey has been developing
               Program for International           445        in key performance areas such as number of
               Student Assessment (PISA)                      researchers and within the Innovation Index.
               Math Scores out of 1,000                       Turkey ranked 68 out of 142 countries in the
               (2009)                                         Innovation Index, scoring high on knowledge and
               Program for International           454        technology.
               Student Assessment (PISA)                    • PISA scores are given in three broad catogories
               Science Scores out of 1,000                    that include reading, math and science. Out of 66
               (2009)                                         countries, Turkey placed 44th in math and science
               Program for International           464        and 42nd in reading.
               Student Assessment (PISA)                    • The country is making the following efforts to
               Reading Scores out of 1,000                    enhance the skills of its labor force:
               (2009)                                           – The Ministry of Education launched projects
               Patents Granted (Turkish            4,543          within the framework of EU programs to meet
               Patent Institute 2012)                             the needs of high-tech industries and improve
                                                                  the number of qualified high-tech workers.
               Innovation Index Score              36/100       – The Ministry of Science, Industry, and
               (INSEAD 2013)                                      Technology launched a program with the
               Researchers in R&D per Million      884            Union of Chambers and Commodity Exchanges
               People (2010)                                      of Turkey (TOBB) to provide skilled laborers to
                                                                  meet manufacturing sector needs.
Source: PISA, Turkish Patent Institute, INSEAD

        Investment Support and Promotion Agency of Turkey
                                                                      ©2014 Deloitte Turkey. Member of Deloitte Touche Tohmatsu Limited
                                                                                                                                          33
Productivity in Turkey increased approximately 10%
 from 2005 to 2012 surpassing total OECD productivity

 Figure 24: Productivity Growth in Total Economy (2005=100)
   125

                                                                                                                 Turkey
                                                                                                                 OECD Total

   100

    75
     2003         2004       2005       2006        2007   2008   2009        2010           2011           2012

Source: OECD

 • OECD measures labor productivity as GDP per hour worked. Turkey’s productivity has been increasing since
   2005 and reached 110.2 in 2012, indicating a productivity increase of 10% from 2005, while total OECD
   productivity only increased 6% during the same period.

       Investment Support and Promotion Agency of Turkey
                                                                         ©2014 Deloitte Turkey. Member of Deloitte Touche Tohmatsu Limited
                                                                                                                                             34
A transparent relationship between employers and
 employees was enacted with Law No. 6356

     Employment and Severance Payment                       Figure 25: Days not Worked due to Strikes and
                                                            Lockouts, 2003-2008
• Termination of employment is governed by labor
                                                                             4,4
  law. According to Article 18 of the law, termination of
                                                                             4,0
  the employment contract of an employee having at
                                                                             3,6
  least 6 months’ service with an employer in a
                                                                             3,2
  workplace operating with 30 or more employees

                                                              Million Days
  should be based on a valid reason relating to                              2,8
  efficiency or behavior of the employee, or the                             2,4
  requirements of the enterprise, workplace or the                           2,0
  work.                                                                      1,6
                                                                             1,2
• Calculation of the severance paid is based on the                          0,8
  employee’s latest salary. However, the maximum                             0,4
  limit of severance pay for the second half of 2012                         0,0
  was TL 3,033.98. In the second half of 2013, the                                   2003       2004        2005       2006       2007        2008
  ceiling for severance pay was increased to TL
  3,254.44.                                                                     Turkey          UK          Germany             Italy        Spain
                                                            Source: ILO

 • As indicated in the Union Law, individuals are free       • In Turkey, the workdays missed were a mere
   to join a trade union, but they cannot be forced to         142,000 in 2008, while in developed countries
   join one.                                                   such as UK there were more than 750,000 days
                                                               missed and Italy surpassed 720,000 days.
 • According to Law No. 6356, Article 41 that governs
   Trade     Unions    and    Collective   Bargaining        • Both the employer and the employee can terminate
   Agreements, labor unions have the right to sign             the employment contract. Moreover, the employer
   collective bargaining agreements with employers             may terminate the employment contract of the
   provided that more than 40% of the total number             employee by paying, in advance, the salary of the
   of employees of that employer are members of the            employee that corresponds to the period of notice.
   labor union.                                                               Source: Ministry of Finance, Official Gazette No. 28460, HSBC Country Guides

     Investment Support and Promotion Agency of Turkey
                                                                                     ©2014 Deloitte Turkey. Member of Deloitte Touche Tohmatsu Limited
                                                                                                                                                             35
Another factor in manufacturing, the cost of energy, is
among the lowest for Turkey

• Lowering electricity prices is vital to relieve the     Figure 26: Electricity Prices for Industry in
  burden of the high cost of energy for the               USD/MWh by Country, 2011
  manufacturing industries of many different
  countries. International investors have to be wary
  of a country’s industrial electricity prices since it   Slovak Republic                                                           178,5
  may be one of the factors deciding the future
  profitability of their investments.
• The figure reveals that Turkey’s averge electricity     Czech Republic                                                      159,9
  prices in 2011 are well below OECD-member
  European countries.
• Turkey continues to have lower energy prices than         OECD Europe                                                     150,0
  the Slovak Republic and the Czech Republic.

                                                                     Turkey                                             138,6

                                                                     Poland                                         121,8

                                                                                 0             50             100      150           200
                                                                                                                           USD/MWh
                                                          Source: IEA Statistics of Energy Prices and Taxes

    Investment Support and Promotion Agency of Turkey
                                                                         ©2014 Deloitte Turkey. Member of Deloitte Touche Tohmatsu Limited
                                                                                                                                             36
The manufacturing industry has been receiving a boost
    from growing R&D grants.

       Figure 27: Gross Expenditures on R&D, 2012                             • Total R&D expenditures increased a stunning 16%
                                                                                from 2007 to 2011 exceeding TL 11 billion in
R&D as % of GDP

                  2,0%
                                                                                2011.
                                                                              • Higher education received more than 45% of the
                  1,5%
                                                                                expenditures for R&D, while business enterprises
                                                                                and the government received 43% and 11%,
                  1,0%          Ukraine                                         respectively.
                                                                    Turkey
                                              Poland
                                                                              • 51% of the total R&D expenditures consist of labor
                                 Malaysia                                       costs, followed by machinery and equipment
                  0,5%
                                                                                expenditures with 12%.
                                                    Mexico

                  0,0%                                                       Figure 28: Gross Domestic Expenditure on R&D by
                         0             5                 10             15   Sector, 2007-2011
                                                      Gross Expenditure on
                                                                                             12
                                                      R&D (USD Billion)                                                    CAGR
 Note: Bubble size represents countries’ GDP in terms of PPP USD Billion.
                                                                                                                           16%                            1,3
 Source: 2013 R&D Global Funding Forecast Report
                                                                                              9                                              1,1
            • According to R&D Magazine, which is a highly                                                                     1,0

                                                                                TL Billion
                                                                                                                                                          4,8
              respected authority on R&D funding, Turkey is                                                      0,8
                                                                                              6                                              3,9
              above its emerging market peers such as India,                                        0,6                        3,2
              Mexico, Malaysia, Poland and the Ukraine in terms                                     2,5          3,0
              of R&D spending as a percentage of the GDP.                                     3
                                                                                                                                             4,3          5,1
            • Although, the R&D spending is percentage wise                                                      3,0           3,8
                                                                                                    2,9
              below European countries with 0.90% in 2012,                                    0
              the spending has been increasing.                                                    2007         2008          2009         2010          2011
            • Moreover, R&D Magazine expects Turkey’s R&D’s                                  Higher education       Business enterprise            Government
              percentage of the GDP to increase to 0.95% in                  Source: Turkstat
              2013.
                    Investment Support and Promotion Agency of Turkey
                                                                                                   ©2014 Deloitte Turkey. Member of Deloitte Touche Tohmatsu Limited
                                                                                                                                                                       37
TÜBITAK, Turkey’s scientific and technological research
 council, has many R&D programs…

Table 9: TÜBITAK Support Programmes
 Support Program                            Explanation
TÜBITAK Industrial R&D Project              • Any company with share capital that is located in Turkey can benefit
Support Program                               from the program.
                                            • TÜBITAK supports the project for a maximum of 36 months.
                                            • The amount of support given to R&D-related projects is a minimum of
                                              40% of the budget up to the maximum of 60% of the budget.
                                            • A TL 7,500 incentive is given to the owner of the company
TÜBITAK Projects Markets Support            • This program supports entities that come together to share information
Program                                       and to work cooperatively on projects.
                                            • At least one university must be a part of the group along with one of the
                                              following entities: a chamber of industry, a board of trade and/or an
                                              exporters’ association.
                                            • If the organization is locally based, the grant given is TL 25,000. If it is
                                              an international organization, the grant amount is TL 30,000.
TÜBITAK Industry - University               • This program supports the transfer of know-how and technology from
Cooperation Program                           universities to SMEs and large corporations in order to create a product
                                              or a process.
                                            • The program grants 5% of the project budget in the form of Project
                                              Inventive Premium (PIP). The PIP can be up to TL 1 million
                                            • TÜBITAK supports the project for a maximum of 24 months
                                            • If the company is an SME, 75% of the project budget is given as a grant
                                              from TÜBITAK. If it is a large corporation, TÜBITAK grants up to 60% of
                                              the project budget.

    Investment Support and Promotion Agency of Turkey
                                                                           ©2014 Deloitte Turkey. Member of Deloitte Touche Tohmatsu Limited
                                                                                                                                               38
… supporting cooperation between industry and
academia

Support Program                             Explanation
• TÜBITAK SME R&D Initiative Program • Only, SMEs that are located in Turkey can apply for this program.
                                            • TÜBITAK supports the project for a maximum of 18 months.
                                            • TL 500,000 is the upper limit of the project budget – for support of the
                                              project.
                                            • 75% of the total budget is given for R&D-related projects.
TÜBITAK International R&D Project           • The program supports corporations located in Turkey that take part in
Support Program                               international partnership support programs (i.e. EUREKA, EUROSTARS
                                              and EU Framework Program).
                                            • The duration for support begins at the project’s starting date and ends
                                              when the project is completed.
                                            • There is a grant of 60% provided for the project’s budget for large
                                              corporations that conduct R&D and 75% grant for SMEs that conduct
                                              R&D.
TÜBITAK Technology R&D and Support • The program supports corporations                       that     invest      in    fundamental
Program for Primary Fields           technology R&D specified by TÜBITAK.
                                            • There are no fixed time periods unless explicitly specified in the
                                              announcement.
                                            • There is 60% grant for the project’s budget for large corporations that
                                              conduct R&D and a 75% grant for SMEs that conduct R&D.
                                            • A 10% grant is given for general expenses and more than 20% grant is
                                              given for international service procurements.

    Investment Support and Promotion Agency of Turkey
                                                                          ©2014 Deloitte Turkey. Member of Deloitte Touche Tohmatsu Limited
                                                                                                                                              39
The total grants awarded surpassed TL 300 million as a
      result of TÜBITAK’s specially tailored R&D program
Figure 29: TÜBITAK R&D Grants for the Private                                                                          SAN-TEZ
Sector, 2007-2012
                                                                                             • SAN-TEZ program supports R&D and innovation
             1.500                                                        500
                                                                                               partnerships  between industry players and
                                                                                               universities.
             1.200                                                        400                • The    program    enables   the    participants  to
                                                                                               commercialize their research findings by increasing
Number of Projects

                                                                                               the number of academic masters and doctorate

                                                                                TL Million
                     900                                                  300
                                                                                               theses.
                                                                                             • The program grant is given as cash to participants.
                     600                                                  200                  75% of the project budget is met by the
                                                                                               Ministry of Science, Industry and Technology,
                     300                                                  100                  while the rest is given by firm(s) in partnership with
                                                                                               the university.
                                                                                             • The total duration for support is 36 months. If the
                       0                                                  0
                                                                                               stakeholders allow, the duration of the grant can be
                          2007 2008 2009        2010 2011 2012
                       Large Corparations       SMEs    Amount of Grant                        extended up to 6 months.
Source: TÜBITAK                                                                              • The program support can include expenditures made
          • TÜBITAK increased its project support from 732 to                                  for hardware, consumables, service procurement,
            1,350 projects, which is an increase of 84% from                                   travel and personnel. However, the hardware
            2007 to 2012.                                                                      expenditures cannot surpass 65% of the project
                                                                                               budget and service procurement cannot exceed
          • The total amount granted, in 2012, was more than
                                                                                               20% of the project budget.
            TL 300 million. More than TL 175 million of
            these grants were given to SMEs, while an excess
            of TL 120 million were given to large corporations.
          • 28% of the projects supported by TÜBITAK were
            machinery and manufacturing projects, followed by
            IT with 16% and electrics and electronics by 13%.

                      Investment Support and Promotion Agency of Turkey
                                                                                                       ©2014 Deloitte Turkey. Member of Deloitte Touche Tohmatsu Limited
                                                                                                                                                                           40
As investment in R&D sped up, the number of registered
national patents and trademarks skyrocketed

Figure 30: Number of Patents and Trademark                              Figure 31: Intellectual Property Rights Index,
Registrations in Turkey, 2007-2012                                      2013
1.200                                                          60.000       Turkey

1.000                                                          50.000         China

                                                                              India
   800                                                         40.000
                                                                            Greece
   600                                                         30.000
                                                                         Romania
   400                                                         20.000
                                                                              Egypt
   200                                                         10.000        Russia
      0                                                        0           Ukraine
             2007      2008        2009   2010   2011   2012
                                                                            Algeria
                        National Patent Registration
                                                                                        0          1          2           3        4        5         6
                        National Trade Mark Registration
                                                                        Source: International Intellectual Property Rights Index
Source: Turkish Patent Institute
                                                                        Note: Index is rated from 1- 8

  • As investments in R&D sped up, the number of                         • Turkey scored an overall intellectual property rights
    national patents skyrocketed in 2012 exceeding                         score of 5.5 in 2013, increasing its score by 0.2
    1,000 registrations, which is a threefold increase                     from 2012. Turkey has achieved a significant
    from 2007.                                                             position among top emerging markets on the
                                                                           Intellectual Property Rights Index and even
  • Moreover, national trademark registration is on the
                                                                           surpassed some Eastern European countries like
    rise with a CAGR 5% growth from 2007 to 2012,
                                                                           Greece and Romania.
    surpassing 52,000 registrations.

          Investment Support and Promotion Agency of Turkey
                                                                                         ©2014 Deloitte Turkey. Member of Deloitte Touche Tohmatsu Limited
                                                                                                                                                             41
You can also read