The Many Measures of Fundedness for the Financial Industry - Lessons from SimCity - RIIA Fall Conference Charlotte, North Carolina Oct 2014
←
→
Page content transcription
If your browser does not render page correctly, please read the page content below
www.pwc.com

The Many Measures of
Fundedness for the
Financial Industry –
Lessons from SimCity

RIIA Fall Conference
Charlotte, North Carolina

Oct 2014
Agenda

 •    Recap from Spring Conference (Mar 2o14)

 •    Leveraging RIM for assessing Definitions of Fundedness

      ─ Retirement Readiness Definitions

      ─ Evolving Readiness Measures - Fundedness through Behavioral Simulation

      ─ RIM Insights – Comparison of Measures of Fundedness

      ─ Potential Implications

 •    Upcoming Papers

PwC                                                                              2
Static HHBS - RIIA and SBI Collaboration

SBI’s MacroMonitor survey and RIIA’s methodology
provides cross-silo view of consumers’ balance sheet (BS),
income & expense (IE) statement
                                                            MacroMonitor
                                                                   Data

                                           Comprehensive projectable survey of
                                           US households’ financial needs,
                                           demographics, products, services,
                                           channels, and attitudes with nearly
                                           4,000 variables.

                  Sample Household
                     Balance Sheet
                    (HHBS) and IE
                      Statement

PwC                                                                         3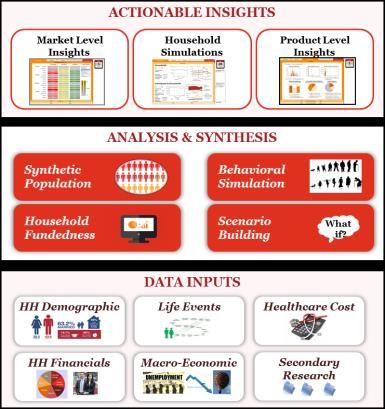
Beyond Predictive Analytics

Using ‘big data’ techniques PwC has fused ‘broad & shallow’
datasets with ‘narrow & deep’ datasets …

                 Narrow &                          Broad &                              Synthetic
               Deep Datasets                     Shallow Data                          Population

                                     +                                   =

      Surveys e.g., SBI’s                     Market Data e.g., US               HHBS/IE Data for Synthetic US
      MacroMonitor Data                       Census                             Population
      • 4,000-5,000 households                • 320 Million households           • Millions of househilds
      • 100’s of variables                    • 10’s of variables                • 100’s or 1000’s of variables

           Deterministic                                                               Stochastic
           Non-Parametric                                                              Parametric

           •     Nearest neighbor algorithm                                  •    Conditional mean matching
           •     Hot-deck Imputation                                         •    Markov Chain Monte Carlo
                                                                             •    Bayesian Data Augmentation

PwC                                                                                                               4
Holistic Planning for US Population

…to create a synthetic US population and their HHBS and IE
statement

                                 Synthetic US Population

              Economics       Consumer Financial Behavior   Environmental
               Factors                                         Factors

PwC                                                                         5
PwC’s Retirement Income Model

PwC’s RIM combines power of data, advanced analytics and
behavioral economics principles to generate actionable insights
                            Retirement Income Model (RIM)
                                      ACTIONABLE INSIGHTS
                       Market Level          Household           Product Level
                        Insights            Simulations            Insights

                                      ANALYSIS & SYNTHESIS

                     Synthetic                        Behavioral        Once upon a
                                                                         time Once
                                                                        upon a time

                     Population                       Simulation         Once upon

                     Household                        Scenario           What
                     Fundedness                       Building            if?

                                          DATA INPUTS
                     HH Demographic         Life Events     Healthcare Cost

                      HH Financials      Macro-Economic          Secondary
                                                                  Research

PwC                                                                                   6
RIM Highlights

… and create forward looking HHBS accounting for real world
relationships and consumer behavior for holistic planning

                                Behavioral
                                Economics
                                Framework

                 Synthetic US
                 Population                  Cradle to
                 /Household                  Grave
                                             Simulations

                                              Scenario
                 Holistic                     Based
                 Household                    Planning
                 View

PwC                                                           7
Summarized RIM Insights from Spring Conference

 In previous conferences, we have shown how RIM can uncover key
 insights around HH fundedness and underlying financials, across
 segments and scenarios
                                                        Population and fundedness in 2020
                                                                                    Fundedness
  # 1 Availability of data                              Wealth      Population         OF        C         UF
  and ability to compute                                Marginal            42%            2%         2%         97%
   “fundedness” plays a                                 Mass Market          41%          13%        18%         70%
 critical role in fiduciary                             Affluent             12%          54%        30%         16%
      responsibilities                                  Wealthy               4%         86%          9%          4%

                                    #2 Only older,
                                                                                    Fundedness
                                     Affluent and
                                                        Life Stage   Population        OF        C         UF
                                  Wealthy segments
                                                        Starters              21%          3%         3%      95%
                                   are unlikely to be
                                                        Builders              15%         14%        15%      71%
                                  “underfunded” for
                                                        Preretired            37%         18%        16%      66%
                                   their retirement
                                                        Retired              28%         26%         12%      62%

 # 3 Scenarios (such as
recessions or increased
savings behaviors) can
                                                              #5 Savings rate is
  have a big impact on
                                                            important across life
       fundedness
                                                           stages – up to a certain
                              #4 Older segments are                                        #6 Decreased health,
                                                               level of wealth
                                   much better                                            if it leads to increased
                              positioned to weather                                        health “events,” has
                               negative economic                                          serious ramifications
                                    situations                                                 for fundedness

 PwC                                                                                                         8
Agenda

 •    Recap from Spring Conference (Mar 2o14)

 •    Leveraging RIM for assessing Definitions of Fundedness

      ─ Retirement Readiness Definitions

      ─ Evolving Readiness Measures - Fundedness through Behavioral Simulation

      ─ RIM Insights – Comparison of Measures of Fundedness
      ─ Potential Implications

 •    Upcoming Papers

PwC                                                                              9
Retirement Planning – Measuring Retirement Readiness

Planning for retirement involves different perspectives and
complexities, leading to multiple definitions of fundedness

PwC                                                           10
Measuring Retirement Readiness – Various Definitions

   Today, companies and advisors have a range of metrics to
   approximate retirement “fitness”, or fundedness

  Potential Retirement Fundedness Definitions
   C/FC                                     expected Consumption            Ratio for spending as a fraction
   (Insurance         eC / eFC                                               of acquired financial assets
   Company)                               expected Financial Capital

   A/L                                          expected Assets
   (Wealth             eA / eL                                               Classical measure of leverage
   Manager)                                   expected Liablities

   Salary                                                                    Popular rule-of-thumb – also
   Replacement                           expected Retirement Income
   Ratio -80%
                      eRI / eFS                                                  known as the “80%
                                             expected Final Salary                replacement rule”
   (Ret. Provider)

   Retirement                         expected Net Retirement Savings          Default definition used by
   Fundedness        eRS / eRE                                                        PwC’s RIM
   (Holistic View)                     expected Retirement Expenses

The challenge faced is two-fold: 1) how to reliably calculate the expected values, and 2) how to link numbers to
                                            assessments of “fitness”?

   PwC                                                                                                      11
Retirement Planning – Evolution
Over the years, the industry developed a few rules of thumb for
simplicity and convenience owing to limited data availability.
However, with ‘big data’ this situation is changing fast…
Informed and
customized
retirement
planning
Internal and
External Data –
anonymous
and synthetic
Internal and data from
External Data – multiple
limited to external
identifiable sources
external data
(example – credit
Internal Data scores)
Only – limited
information
Generic Rules
of Thumb in
Retirement
Planning
PwC 12Retirement Readiness – Shortcomings of Traditional Measures
Commonly used rules of thumb are applicable to a few segments
with limited assets but should be used with full understanding of
notable shortcomings
Lack of Holistic Household View Challenging task of projecting the
Unknowns
Unaccounted varying Retirement Retirement Funding – Incomplete view
Consumption Needs of all Assets
PwC 13Definitions of Fundedness – RF or eRS/eRE
RIM uses specific instantiation of the RIIA recognized A/L definition
to measure retirement readiness with a holistic approach
Retirement Fundedness (RF) Definition
145% - OverFunded
Expected Retirement Expenses
Retirement Expenses Net Retirement Savings
Expense during Total Liquid Outstanding Total Social
Retirement Assets Liabilities Security Income
= Retirement Expense Coefficient = Current balances of = Current Balance = Expected Social
1 * (Final Salary) * (Retirement
Liquid assets2 + of all debt Security Income of the
Period Remaining Until (Total value of added Household3 *
Expected Lifetime) IRA and 401K (Retirement Period
contribution till Remaining Until
retirement) Expected Lifetime)
1. Retirement Expense coefficient is analytical computation based on historical consumption data from Consumer Expenditure Survey
2. Include - CDs, Mutual Funds, Accumulation Annuities, Savings Accounts, IRA and 401K Accounts
3. Social Security Benefit is estimated based on research from Boston College http://crr.bc.edu/wp-content/uploads/2011/11/IB_11-13-508.pdf
PwC 14Definitions of Fundedness – 80% Rule of Salary Replacement or eRI/eFS
“80% Rule” of Retirement is a commonly used rule of thumb for
retirement readiness and is based on measures of income
Fundedness Definition (Assumed)
Salary Expected Retirement Income < 70 % - UnderFunded
Replacement
70% - 90% - Constrained
Ratio -80% Expected Final Salary
> 90% - OverFunded
Final Salary Retirement Income
Final Salary Before Social Security Annuitized Value of
Retirement Income Retirement Savings
This is often calculated as the average Expected Social Security Expected Savings during retirement includes
of last 5 years of income before Earnings as a %3 of the linearly projected balances from
retirement. The values for the future Final Salary retirement accounts like 401K and IRAs and
are projected using linear path and additional contributions till the age of
standard assumptions. retirement.
Assumptions made -
1 Annual salary increase (2% is the most commonly used wage growth rate)
2 Commonly used rate of return of 4% in all current models per research
3 Average life span
PwC 15Definitions of Fundedness – eC/eFC
Another measure of fundedness could be measured based on
financial assets and consumption
Fundedness Definition
Expected Consumption > 7.0 % - UnderFunded
C/FC
3.5% - 7.0% - Constrained
Expected Financial Capital
< 3.5% - OverFunded
Financial Capital Retirement Consumption
Financial Capital of HHs (at retirement) Expected Annual Expenses in Retirement
Financial Capital include all assets/savings in form of Estimated value of all discretionary expenses, fixed
cash, annuities, IRA, DC. expenses.
1 Assumed retirement age of 65
2 Asset ownership at Retirement from US Census
http://www.census.gov/compendia/statab/cats/banking_finance_insurance/household_financial_assets_and_liabilities.html
3 Assumed inflation rate of 1.2% in all current models per research
4 Retirement expenses and trends - CES
PwC 16RIM Insights #1 - Comparison of Methods of Calculating Fundedness
Comparing the 80% Rule, C/FC and RIM’s RF for representative
sample of US Households leads to different outcomes
Comparing Fundedness (Median) of Wealth and Life Stage Segments based on various
definitions
Source : PwC Analysis on synthetic population generated using data from US Census, SBI Macro Monitor, etc
PwC 17RIM Insights #1 – Implications of Definitions on Affluent Builders
Assessing the definitions with respect to specific segments, help
assess the underlying causes and implications
* Expenses, Assets and Retirement Income indicated here are median values for the segment
RF accounts for Asset/Liabilities, Income/Expense and Social /Human capital, leading to HHBS computation
aligned with real world relationships and estimates
Source : PwC Analysis on synthetic population generated using data from US Census, SBI Macro Monitor, etc
PwC 18RIM Insights #2 – 80% Rule and RF Comparison
Rules of thumb like the 80% rule fails to account for a 360 degree
view of household finances like the varying consumption patterns
and additional assets
80% Rule
• Employed members of relatively affluent
households may make an informed
decision to voluntarily exit the workforce
prematurely, but are unnecessarily
penalized
80% rule
• Retirement preparedness based on high levels of
current income, without any regard to household
consumption patterns
• Grossly overestimates the retirement
preparedness of affluent starters spending beyond
their means.
Source : PwC Analysis on synthetic population generated using data from US Census, SBI Macro Monitor, etc
PwC 19RIM Insights #3 - Role of Liabilities
In developing the RF definition, we started with liquid assets and
expense, and studied the impact of financial liabilities
RIIA Wealth Net Impact on RF* RIIA Life Stage Net Impact on RF*
Segment Segment
Wealthy -0.20% Builders -18.25%
Affluent -3.16% Preretired -25.70%
Mass Market -34.35% Retired -7.45%
*The values indicates the average Δ effect as % of ratio of Assets/Expenses
Outstanding debt bring down the fundedness of all segments by varying degrees, with significant impact for the
pre-retiree segment
PwC Source : PwC Analysis on synthetic population generated using data from US Census, SBI Macro Monitor, etc 20Demo from the RIM
Illustrative Example
• Ron and Ellen Smith are a couple in their early 60s who have spent their lives in central Pennsylvania.
• Ron is nearing retirement at a chocolate manufacturing company and expects to earn $60K just before retiring. Ellen exited
the workforce almost 30 years ago, when the first of their two children were born, and has been a homemaker since.
• Using the 80% Rule, the Smiths should expect to cover their retirement expenses with approx. $48K / year
Projected Expenses - Ron & Ellen Smith
Retirement Plans 70
Expenditure - $ (Thousands)
60
50
40
30
20
Luxury Travel
Higher Education Long Term Care
10
0
1 2 3 4 5 6 7 8 9 10 11 12 13 14 15 16 17 18 19 20
Years in Retirement
Using 80% Rule Using Fundedness
• However, they plan to travel overseas after retirement, and Ellen wants to experience first class air travel and
stay at select luxury boutique hotels.
• In addition, their son Justin unexpectedly decides to abandon his dream of becoming an actor and go back to
college (having exhausted all other credit lines, his parents are the only available source of funding).
• Finally, Ellen’s arthritis makes mobility very difficult in their later years, which requires her to depend on long-term
care during the latter part of their retirement.
• As a result of planned and unplanned expenses, expenses may vary significantly during retirement.
Depending on an unanchored measure such as the 80% rule to measure retirement readiness is therefore
fraught with risks.
PwC 21Wrap-up – Potential Implications
In addition, there are profound implications and applications for
consumers, distributors and manufacturers
RIM Insights
Consumers Distributors Manufacturers
Tim & Jane Walker Mark Rodriguez Capital City Life
(a Household) (Financial Planner) (Ret. Provider Firm)
• Utilize RIM insights to • Leverage the RIM to plan • Leverage the RIM to better
continuously monitor retirement for clients and understand how the market
fundedness with best suited construct portfolios based on is evolving and plan new
approach and take remedial appropriate definitions and products/features targeted
action, if necessary. readiness measures. at appropriate segments.
• Test and execute retirement • RIM can combine the data of • RIM provides retirement
plans based on individual your clients with rich providers with a holistic
situation under multiple external data for planning approach against income
scenarios. with a holistic view. based measures.
PwC 22RIM – Publications and Reports
We continue to release additional insights to the market in our
publications and white papers
RIMSM Insights Report RMI Papers
“Using Behavioral Simulation to “Are Safe Withdrawal Rates Really
Drive Insights around Retirement Safe?” (Nov 2014) – Retirees struggle
preparation and strategies: The to answer the question of whether they
Retirement Income ModelSM should be withdrawing, 5.0%, 4.0%, or
Insights Report”(Nov 2014) 3.5% of their savings every year. Which
• Fitness Maps – Calculation and retirees should be more conservative?
comparison of different fundedness Under what scenarios should they revisit
metrics, based on simulations “safe withdrawal” assumptions?
• Opportunity Maps – Projection of
segment distribution, fundedness, “A Wider Look at the 80% Rule”
and financial positions (released Oct 2014)– The 80% rule
states that people should aim to replace
• Glide Path Analysis – Perspectives
80% of their preretirement gross income
on the impact of different “glide
when they retire. However this widely
paths” on fundedness of segments
used rule of thumb may not be right for
very participant today or stay right for
participants.
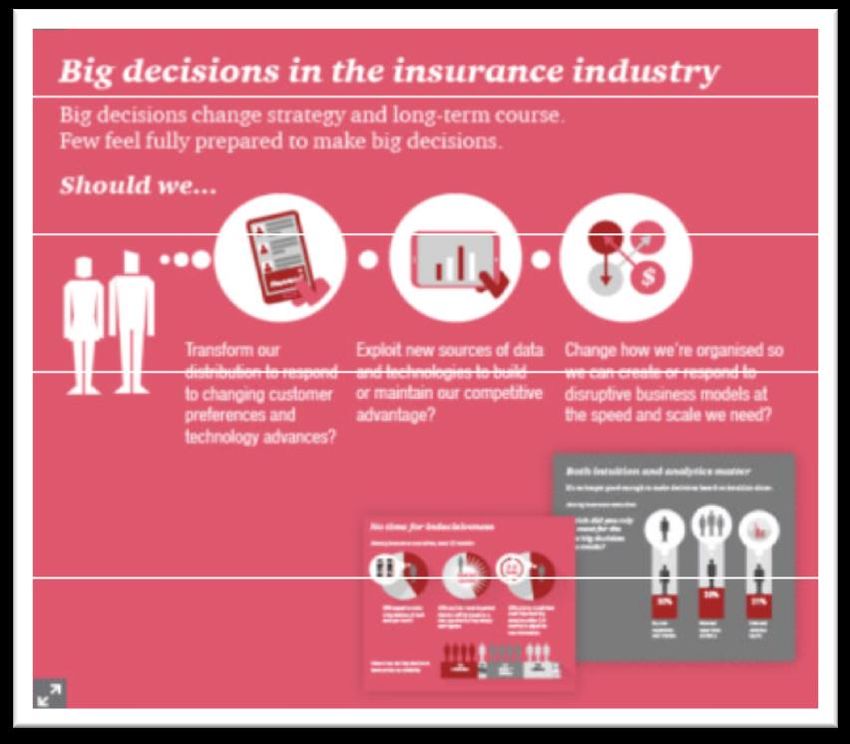
PwC 23Art & Science
Gut & Gigabytes – The Art and Science of Decision Making
• PwC-EIU Global Survey of Big Decisions
• Over 1,100+ Senior Executives across 14 sectors
• Source: www.pwc.com/bigdecisions
Source: PwC Big Decisions Survey 2014
PwC 24For Additional Information Contact:
Anand Rao
PwC
617-633-8354
anand.rao@us.pwc.com
For more information, please consult the following two articles in the
Retirement Management Journal (Summer 2013 Issue) –
Current HHBS – “Head Office Article: The RIIA Balance Sheet”
Future HHBS – “Projecting the RIIA Household Balance Sheet into the Future”
PwCOur team:
Jamie Yoder Paul Blase
David Gates Ankita Sanghvi
Pia Ramchandani Spencer Alee
Mark Paich Pallav Ray
Joe Chau Karan Bagadiya
PwCAcknowledgements:
Francois Gadenne
RIIA
Elvin Turner
RIIA – Market Insight Program
Larry Cohen
Strategic Business Insights
PwCYou can also read