The Meat We Do Not Eat. A Survey of Meat Waste in German Hospitality and Food Service Businesses
←
→
Page content transcription
If your browser does not render page correctly, please read the page content below
sustainability

Article
The Meat We Do Not Eat. A Survey of Meat Waste in German
Hospitality and Food Service Businesses
Annika Johanna Thies *, Felicitas Schneider                     and Josef Efken

                                          Institute of Market Analysis, Johann Heinrich von Thuenen Institute, 38116 Braunschweig, Germany;
                                          felicitas.schneider@thuenen.de (F.S.); josef.efken@thuenen.de (J.E.)
                                          * Correspondence: annika.thies@thuenen.de

                                          Abstract: Food waste is a global challenge. Detailed information on quantities and drivers is needed
                                          to provide tailored recommendations for prevention measures. Current studies on meat waste in
                                          the Hospitality and Food Service business (HaFS) sector are rare, often based on small sample sizes,
                                          and seldom use comparable reference units. The present study reports meat and meat product waste
                                          in the German HaFS business sector based on structured telephone interviews. Purchased fresh
                                          meat and meat product quantities, as well as waste during storage, due to preparation and leftovers,
                                          are captured for four different market segments. Waste ratios referring to weekly meat purchases
                                          are analysed and compared between these segments, as well as on the business-type level. In this
                                          context, the authors distinguish total and avoidable meat waste. Absolute meat waste volumes
                                are extrapolated on a weighted base for the entire German HaFS sector. Factors influencing meat

                                          waste are identified through regression analysis in order to derive possible food waste prevention
Citation: Thies, A.J.; Schneider, F.;     measures. The results are discussed to provide recommendations for future national monitoring,
Efken, J. The Meat We Do Not Eat. A       policy instruments and research.
Survey of Meat Waste in German
Hospitality and Food Service              Keywords: meat waste; meat product waste; waste ratios; out-of-home market; food waste; away
Businesses. Sustainability 2021, 13,
                                          from home (AFH); leftover; plate waste; serving waste
5059. https://doi.org/10.3390/
su13095059

Academic Editors:
                                          1. Introduction
Danuta Kołożyn-Krajewska,
Beata Bilska and                                The limits of planetary resources, combined with a growing world population and
Marzena Tomaszewska                       a correspondingly increasing demand for food, make more sustainable production and
                                          consumption behaviours imperative. The reduction, or even prevention, in food that is
Received: 31 March 2021                   wasted along the entire value chain plays a decisive role in this respect [1,2].
Accepted: 28 April 2021                         This relevance is accounted for in the United Nations Sustainable Development Goal
Published: 30 April 2021                  12.3, which calls for halving the amount of food waste by 2030 and reducing food losses
                                          along the entire food supply chain [3].
Publisher’s Note: MDPI stays neutral            Following the recommended target–measure–act approach by the World Resource
with regard to jurisdictional claims in   Institute and other leading scientific organisations [2,4], detailed information regarding the
published maps and institutional affil-   emergence of food waste is a fundamental requirement to implement prevention measures
iations.                                  and assess their efficiency in a second step. In this context, a comprehensive database
                                          would allow for a comparison between product groups, value chains, regions and countries
                                          in order to identify influencing factors [5] and derive efficient preventive actions [6,7].
                                          Although the UN member states already committed themselves to SDG 12.3, the European
Copyright: © 2021 by the authors.         Commission released regulatory instruments for application by the member states in
Licensee MDPI, Basel, Switzerland.        order to further support the achievement of these objectives. As a first step, the European
This article is an open access article    Waste Framework Directive was revised by implementing a common definition of food
distributed under the terms and           waste within the European context (Directive (EU) 2018/851). In a second step, reporting
conditions of the Creative Commons        of annual food waste quantities to the European statistic office, according to a defined
Attribution (CC BY) license (https://
                                          common methodology with minimum quality requirements, was made compulsory in 2020
creativecommons.org/licenses/by/
                                          to achieve a uniform measurement of food waste and generate a comparable database [8,9].
4.0/).

Sustainability 2021, 13, 5059. https://doi.org/10.3390/su13095059                                     https://www.mdpi.com/journal/sustainability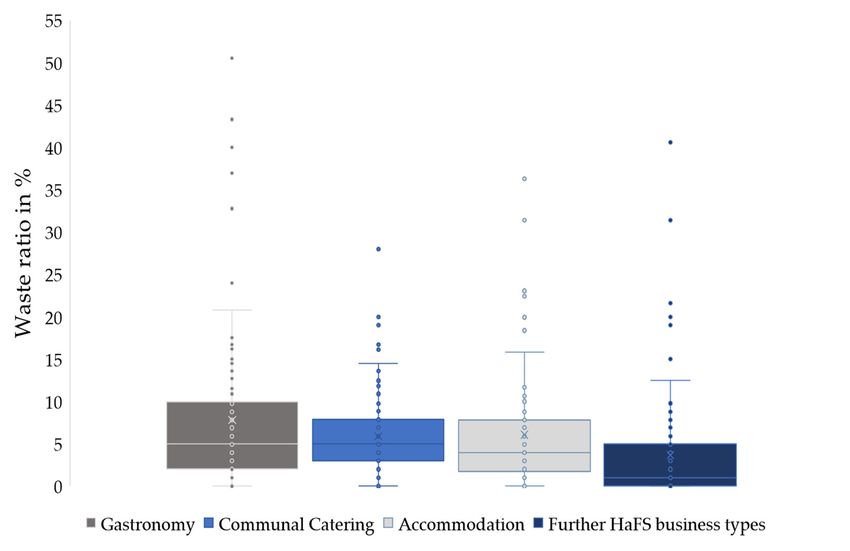
Sustainability 2021, 13, 5059                                                                                            2 of 20

                                These specifications also initiated the establishment or adaption of national food waste
                                monitoring systems in European Community countries [10–14].
                                      The aim of associated policy instruments is mainly to reduce the overall amount of
                                food waste. However, with regard to the sustainability of food systems, distinguishing
                                between different product groups is of great relevance [15] as climate effects associated
                                with production vary in terms of resource intensity [16]. This means that food products
                                with lower waste quantities measured in mass might be identified as hot spots, considering
                                alternative indicators such as the global warming potential (GWP), carbon footprint, blue
                                water footprint, land use, biodiversity and ecosystem services [17–21].
                                      The production of animal proteins and especially meat is associated with higher neg-
                                ative external effects on the environment in comparison to plant-based food [22,23]. In
                                addition, there are growing social concerns regarding animal welfare, which is reflected,
                                among other issues, in an increasing number of vegan and vegetarian consumers mostly in
                                Western industrialised countries [24,25]. Researchers at various national or institutional
                                levels conclude that a reduction in meat consumption could have a positive effect on envi-
                                ronmental sustainability [16,26,27]. Issues to be considered in this context are land, energy
                                and water use [22,28]; the contribution of greenhouse gas (GHG) emissions; biodiversity
                                loss; and deforestation [26,29]. Beretta and Hellweg conclude in their work on selected
                                hospitality sector case studies that a reduction of two (mass) percent of meat and fish
                                waste in a business canteen, accompanied by a shift to a higher share of fish dishes on
                                offer, could result in the largest environmental benefit of all considered food categories [15].
                                This underlines the importance of a solid understanding of the magnitude and influencing
                                factors on meat waste along the value chain, which then enables target-oriented measures
                                to lower the environmental footprint and social impact of food systems.
                                      Previous scientific research has focused on the detection and prevention of food waste
                                at the consumer level, especially in industrialised countries [5], as waste volumes appeared
                                to be particularly high compared to other stages of the value chain [30]. However, food
                                is not exclusively prepared and consumed at home. In addition, within the Hospitality
                                and Food Service (HaFS) sector, professional food handling meets individual consumer
                                attitudes, expectations and behaviour. Therefore, food waste accounting and the imple-
                                mentation of prevention measures are especially challenging tasks as two interconnected
                                stakeholder groups with contrasting inherent aims, knowledge and preferences have to
                                be considered and addressed within one stage of the value chain. In addition, each of
                                the various food service business types faces different internal and external framework
                                conditions. The acquisition of information on food waste in the HaFS sector should be
                                prioritised on the research and political agenda. Since the share of meat and meat products
                                purchased by German private households in comparison to meat consumed according to
                                the official meat balance sheets decreased by 7% between 2008 and 2018, it can be assumed
                                that consumption outofhome was gaining importance until the outbreak of the COVID-19
                                pandemic in March 2020 [31,32]. It remains to be seen how the sector will develop after
                                the lockdown measures are lifted, in connection with the lasting changes in the living and
                                working habits of society.
                                      Available studies on meat waste in the HaFS sector (see Section 2) are often based
                                on small sample sizes and show results in relation to portion sizes, which are hardly
                                comparable. This study therefore reports meat and meat product waste for the German
                                HaFS sector based on structured telephone interviews with HaFS businesses. Purchased
                                fresh meat and meat product quantities, as well as waste during storage, due to preparation
                                and leftovers, are captured, considering four different market segments: Gastronomy,
                                Communal Catering, Accommodation and further HaFS business. Waste ratios referring to
                                weekly meat purchases are analysed and compared between the four different segments
                                and on a business-type level. In this context, the authors distinguish between total and
                                avoidable waste ratios. Absolute waste volumes are extrapolated on a weighted basis
                                for one year and the total number of HaFS businesses within the four segments. Factors
                                influencing waste ratios are identified through regression analysis in order to derive
Sustainability 2021, 13, 5059 3 of 20
possible prevention and reduction measures. In addition, the methodological approach
is discussed to provide implications for future national monitoring, policy instruments
and research.
2. Meat Waste in International Out-of-Home Food Consumption Literature and
Data Gaps
The literature references on fresh meat and meat product waste within the out-of-
home food consumption sector are generally scarce. A few studies mention meat waste
as part of higher aggregated product groups or as part of mixed dishes [33]. However,
they do not specifically indicate waste ratios or absolute waste volumes for meat. Other
authors provide selected data for specific waste types, such as plate waste [34–37], but do
not consider the total quantity purchased.
Table 1 summarises literature references and accompanying information. Among
them, only few studies target meat waste in German out-of-home food consumption.
Noleppa and Cartsburg [38] give an overview of existing data. In total, meat waste at the
consumption level (sum of out-of-home and household levels) is calculated as 16% related
to the amount available for consumption, of which 8.3% is classified as unavoidable and
7.7% as avoidable meat waste. Xue et al. [39] analysed the German meat supply chain
considering use and disposal paths of meat waste and the use of by-products. At the
consumption level (sum of out-of-home and household levels), the authors summed up
meat waste at roughly 24%.
Table 1. Selected national and international data related to meat waste in the HaFS sector.
Total Avoidable Unavoidable
Reference Level Unit Meat Meat Meat
Waste Waste Waste
Percentage of
Noleppa and Cartsburg Ooh and production
16.0 7.7 8.3
[38], Germany Hh available for
consumption stage
Dry matter percentage
Xue et al. [39], of meat
Ooh ca. 8 - -
Germany products available for
ooh
Meat and fish
6
WRAP [40], UK Ooh waste in percentage of
(including fish)
total FW ooh
Meat and fish waste Hotels: 3.7
Schranzhofer et al.
Ooh in mass percent of Gastronomy: 13.8 - -
[41], Austria
total FW ooh Canteens: 2.8
Meat and fish waste Hotels: 8.9
Schranzhofer et al.
Ooh in mass percent of - Gastronomy: 24.7 -
[41], Austria
avoidable FW ooh Canteens: 3.8
MW quota (avoidable
Own calculation acc. Hotels: 1.4
meat and fish waste
Schranzhofer et al. Ooh - Gastronomy: 4.7 -
related to food mass
[41], Austria Canteens: 1.0
output to consumers)
Pork: 10.3
Percentage of input to Pork: 13.8
Beretta et al. [17], Poultry: 13.1
Ooh Swiss - Poultry: 25.0 Beef,
Switzerland Beef, horse,
HaFS sector horse, veal: 13.8
veal: 19.4
Papargyropoulou et al. Percentage of input to
Ooh 2.1–2.6 - -
[42], Malaysia establishments
In the international literature, the Waste & Resource Action Programme (WRAP) [40]
compiled results of several studies in the United Kingdom and found that higher-pricedSustainability 2021, 13, 5059 4 of 20
food accounts for a relatively low share of avoidable out-of-home food waste (FW). In sum,
6% of the total avoidable FW was composed of meat and fish.
Schranzhofer et al. [41] analysed FW in the Austrian out-of-home sector, performing a
detailed sorting analysis for three different business types: 10 hotels, 8 gastronomy busi-
nesses and 11 canteens. For the present paper, unpublished raw data from Schranzhofer et al.
was used to recalculate the meat and fish waste quota, which is the amount of avoidable
meat and fish waste related to the food output to clients. Waste ratios vary from 1.0% for
canteens to up to 4.7% for gastronomy (Table 1). Beretta et al. [17] conducted a mass flow
analysis (MFA) based on various waste sorting analyses from Austrian and Swiss literature.
The authors provide detailed meat waste figures, considering different meat types and
classifying avoidable or unavoidable waste. Papargyropoulou et al. [42] also used an MFA
based on primary data of three different out-of-home establishments in Malaysia.
Xue et al. [5] found that available data on food waste is often unrepresentative, is
outdated or does not consider different framework conditions. The results of different
studies are therefore often not comparable. These issues also emerge when examining
the meat product group. Reference parameters (e.g., based on meat input to level or
composition of total FW), observation levels (partly including household level), product
types (partly fish included), targeted waste streams (partly avoidable meat waste only),
origins of data (primary or secondary data) and physical units (dry matter versus fresh
matter) differ among the various literature references (Table 1). Furthermore, there is a lack
of representativeness as only small-scale pilot studies were used for upscaling.
Thus, the present paper represents a unique primary and representative data source re-
garding meat waste for the considered segments and associated HaFS businesses, covering
all arising points from storage to plate leftovers.
3. Hypothesis, Definitions, Data and Methodological Approach
3.1. Hypothesis
Against the background of a comprehensive literature review, various hypotheses
were developed, which were addressed in the course of analysis of the collected data.
Operating conditions of segments and the individual businesses differ greatly from
one another. The procurement of meat (quantity, type and degree of processing) as well as
the storage and processing in a restaurant is not comparable with a company that hardly
processes the meat itself (such as a bakery selling sandwiches to go). This is why an
assessment is needed at the business level to make corresponding statements regarding the
absolute quantities of meat waste for the entire German HaFS sector.
Hypothesis 1 (H1). Segments in the HaFS sector report different meat waste quantities due to
different framework conditions. Even within the same segments, meat waste varies due to individual
characteristics (e.g., size, number and type of meat on offer, suppliers).
Furthermore, the authors assume that the contribution of different arising points
varies between segments. For example, it is known from the literature that in the catering
industry, mainly plate waste occurs. The volume of waste occurring in the course of
processing or handling might be low for the majority of businesses, as purchased meat
products are likely to be pre-cut or prefabricated. Accordingly, it can be assumed that for
different segments, individual arising points have to be identified to derive targeted meat
waste prevention measures.
Hypothesis 2 (H2). The relevance of different arising points of meat waste varies between HaFS
segments. Identifying those arising points helps to derive specific reduction measures.
The authors also assume that internal factors referring to the overall awareness of
food waste prevention within each HaFS business affect the level of meat waste. Businesses
that have already raised staff awareness on food waste prevention are probably already
implementing various prevention measures and, therefore, report lower meat waste. TheseSustainability 2021, 13, 5059 5 of 20
businesses might also have higher shares of meat leftovers taken home by guests and are
more likely to be cooperating with social institutions (food pantries).
Hypothesis 3 (H3). Businesses that are aware of the food waste issue in general and those that
have already implemented prevention measures have lower meat waste ratios compared to businesses
that have hardly dealt with the topic.
3.2. Definition and Data
The products considered in the data collection were fresh meat and meat products
(e.g., filets, schnitzel or sliced cold meat), which are purchased and further processed into
ready-to-eat dishes within the HaFS sector. All food-grade meat products leaving the food
supply chain were defined as meat waste. In addition to the total amount in wet mass,
the share of unavoidable meat waste was requested. The classification and definition of
unavoidable waste were outlined to the participants at the beginning of the consultation.
As the results have also been used for a mass flow analysis of the entire German meat
supply chain, weekly meat purchases in kilograms as well as the share of wasted meat
were captured. A reference period of one week was chosen in order to obtain realistic
assessments based on the respondents’ memory.
A total of 400 companies located in all 16 federal states of Germany were interviewed
on the basis of computer-assisted telephone interviews (CATI) by a specialised market
research institute (Business Target Group (BTG)) between October and December 2019.
The surveyed businesses were divided into four different segments according to their
operating and customer structures: Gastronomy, Communal Catering, Accommodation
and further HaFS business. In each segment, a total of 100 companies were interviewed
and selected based on random sampling. The number of the individual business types was
representative within each segment, based on the total number of HaFS businesses and
further available subdivision criteria (such as seating capacity). Due to missing values, the
dataset used for the analysis was further reduced to a total of 379 respondents. Accordingly,
the final sample structure is shown in Table 2.
The questionnaire comprised a total of 15 open and closed questions, which were
related to general operation information, meat purchases (meat types and meat-sourcing
locations) and estimated meat waste ratios differentiated according to arising points. In ad-
dition, participating businesses had to answer several statements regarding their attitudes
towards the prevention of food waste in general within a four-point Likert scale. To identify
business characteristics that are related to the indicated waste ratios (see Hypotheses 3),
the information gathered in this way has been used.
Targeted respondents within each HaFS business were selected according to their
ability to assess weekly purchased and wasted meat quantities. The comprehensibility of
the questions was ensured through multiple feedback rounds with the market research
institute as well as a pretest.
For purposes of comparability, representatives of further HaFS business types were
asked to refer to ready-to-eat or takeaway products. The information with regard to meat
waste in butcheries therefore refers to waste accruing after early stages of processing, such
as trimming or cutting.
The authors distinguished between waste arising during storage, preparation and
leftovers (Figure 1). Storage waste occurs during storage on-site, e.g., due to exceeded
shelf life. Preparation waste that arises during trimming and cooking processes was
categorised as unavoidable waste (inedible components such as bones and tendons) and
further waste resulting from cutting of edible material. Leftovers (total of overproduction,
remaining from buffet and plate) were also classified as waste and summarised within
the questionnaire to not exceed the maximum number of questions at the given financial
budget. In contrast, meat taken home in doggy bags by customers was not considered as
meat waste in the present study.Sustainability 2021, 13, 5059 6 of 20
Table 2. Sample structure.
n
Segment and Associated Businesses
(Sample n = 379)
Gastronomy
Bistro 4
Café 13
Pub 16
Home delivery 6
Quick-Service Restaurants (QSRs) 4
Slow food 39
Snack 11
Communal Catering
Retirement home 10
Disabled facility 1
Business catering 8
University 1
Children and youth facility 39
Hospital 2
School 34
Further care facilities 1
Preventive care and rehabilitation facility 2
Accommodation
Inn 16
Hotel 35
Hotel Garni 19
Youth hostel 4
Guesthouse 20
Further HaFS business types
Bakery 49
Butcher 22
Filling station 20
Caterer 3
Figure 1. Model for meat waste flows within each assessed HaFS business.
Information on meat waste was given as a share individually related to the meat
quantity purchased, processed and cooked, according to Figure 1. Total waste quantities
were calculated by adding absolute meat waste quantities at each stage (storage waste,Sustainability 2021, 13, 5059 7 of 20
processing waste and leftovers). For reasons of comparability and further analysis, meat
waste ratios were determined referring to the purchased meat quantity of each HaFS
business. In case a respondent could not estimate single streams, he or she could indicate
total waste ratios without distinguishing between different steps.
3.3. Data Analysis
An initial plausibility check of the responses was carried out based on the expertise of
the market research institute. The data analysis was carried out in three subsequent steps,
using Stata 16.1 for deductive and inductive statistics:
In the first step, waste ratios were compared between the different segments and on
the business-type level using various descriptive statistical parameters and explorative
analysis (boxplots). Outliers and zero values were not removed, as the indication of zero
waste ratios seemed realistic for businesses purchasing ready-to-eat products with only
minor processing (such as bakeries or filling stations).
A Kruskal–Wallis H test followed by a post hoc analysis (pairwise comparison)
was conducted to test for statistically significant differences in waste ratios between seg-
ments [43]. Weighted meat waste for the total German HaFS sector was calculated consid-
ering the total number of businesses types for each segment according to the professional
business database of the BTG Group.
In the second step, the authors identified driving factors on the level of meat waste
ratios. Since the values of the waste ratios (dependent variable) were between 0 and 1, a
fractional logistic model was conducted [44]. Average marginal effects were calculated to
enable a better interpretation of the estimated coefficients. Goodness of fit was assessed
based on the Wald test and McFadden’s pseudo-R2 measure [45].
Additionally, in the third step, qualitative statements of 116 respondents given within
an additional open question were analysed by qualitative content analysis according
to Mayring et al. [46]. Categories defined in the course of the analysis were formed
inductively [46].
4. Results
4.1. Descriptive Statistics and Meat Waste Ratios
Information on summary statistics and further characterisation of the participating
businesses is presented in Table 3. The interviewees within the HaFS sector were primarily
involved as the owner, manager, tenant and/or kitchen manager of a business. The
companies with staff reported to have 14 employees, on average.
Participants reported a mean meat purchase of 66 kg per week, whereby the purchased
volumes varied noticeably against the backdrop of the standard deviation. Wholesale and
butchers were the most frequently mentioned sourcing locations for meat, whereas direct
purchases from slaughterhouses or farms were little used. Offered meat types and products
were mainly sliced cold meat, poultry, beef and pork. Specialised restaurants offering game
or high-priced lamb, however, were rather less prevalent. The variable reflecting the offer
of small portions was derived from the open question on further comments.
To address Hypothesis 1 (H1), the distribution of the waste ratios in the four different
segments was examined descriptively using boxplots (Figure 2). Waste ratios at the business
level were investigated using various descriptive statistical indicators (Table 4).Sustainability 2021, 13, 5059 8 of 20
Table 3. Summary statistics and characterisation of surveyed businesses.
n
Variables Mean SD
(Sample n = 379)
Total meat purchase in kg per week 379 66.35 140.83
Number of employees 269 14.97 28.64
Position of the respondent within the company (dummy)
Owner, management, tenant 208 0.54 0.50
Operational management 26 0.06 0.25
Kitchen management 88 0.23 0.42
Chef 17 0.04 0.21
Purchasing management 2 0.01 0.07
Meat-sourcing location (dummy)
Butcher 173 0.46 0.50
Farm 21 0.05 0.23
Slaughterhouse 16 0.04 0.20
Wholesale 238 0.63 0.50
Sustainability 2021, 13, x FOR PEER REVIEW 9 of 22
Retail 64 0.17 0.37
Purchased meat types (dummy)
Poultry 253 0.67 0.47
However, the fourth segment
Beef deviates visually in this regard. 246A Kruskal–Wallis
0.65 H test
0.50
Pork 246 0.65 0.50
showed that there was a statistically significant difference in meat waste ratios between
the four segments: χ2(3)Lamb
= 39.370 and p = 0.0001. A post hoc 65 test (Dunn’s
0.17 pairwise
0.40
Game 77 0.20 0.40
comparison with Bonferroni adjustment) confirmed that the260
Sliced cold meat
fourth segment
0.69
of further
0.46
business types has significantly
Other different meat waste ratios compared
26 to the
0.07 remaining
0.25
three segments. No statistically verifiable difference could be found between waste ratios
Offer of small portions (dummy) 4 0.01 0.10
of Gastronomy, Communal Catering and Accommodation.
Distributionof
Figure2.2.Distribution
Figure oftotal
totalmeat
meatwaste
wasteratios
ratiosfor
forthe
thefour
fourassessed
assessedsegments.
segments.
Table 4 shows various statistical parameters regarding the total and avoidable meat
waste ratios for the four different segments and associated business types. The highest
mean total and avoidable waste ratios were found for the Gastronomy segment, including
the highest maximum waste ratios. Within this segment, bistros and cafés indicated the
highest waste ratios. Communal Catering and Accommodation segments showed
comparable mean waste ratios. Within the Communal Catering segment, retirement
homes and preventive care and rehabilitation facilities stated the maximum waste ratios.
Youth hostels showed the highest waste values within the Accommodation segment. The
lowest total and avoidable meat waste rates were calculated for further businesses,Sustainability 2021, 13, 5059 9 of 20
Table 4. Meat waste ratios for segments and subsegments in percentage of weekly purchased meat and meat product
quantity in kilograms.
Segments n Mean Median Min. Max. SD
Total Avoidable Total Avoidable Total Avoidable Total Avoidable Total Avoidable
Waste Waste Waste Waste Waste Waste Waste Waste Waste Waste
Gastronomy 93 7.8 5.8 5.0 4.9 0.0 0.0 50.5 34.3 9.7 5.7
Bistro 4 13.4 4.6 8.3 2.0 0.0 0.0 37.0 14.5 17.0 6.7
Café 13 10.1 7.1 5.0 5.0 0.0 0.0 43.3 34.3 14.5 9.4
Pub 16 4.0 4.0 4.0 4.0 0.0 0.0 9.8 9.8 2.8 2.8
Home delivery 6 4.0 2.3 2.0 2.0 0.0 0.0 15.0 5.0 5.7 2.3
Quick-service
4 4.2 4.2 4.0 4.0 1.0 1.0 7.9 7.8 3.2 3.2
restaurant
Slow food 39 9.0 6.5 5.0 5.0 0.0 0.0 50.5 25.0 9.9 5.5
Snack 11 8.0 7.1 6.9 6.9 1.0 2.0 24.0 14.5 7.0 5.1
Communal
98 5.9 5.6 5.0 5.0 0.0 0.0 28.0 28.0 4.9 4.7
Cateringx
Retirement home 10 12.2 11.5 12.5 12.3 1.0 1.0 19.0 19.0 5.1 5.4
Disabled facility 1 2.0 2.0 2.0 2.0 2.0 2.0 2.0 2.0
Business catering 8 6.5 5.9 5.5 5.5 0.0 0.0 13.6 12.6 5.0 4.2
University 1 5.0 5.0 5.0 5.0 5.0 5.0 5.0 5.0
Kindergarten 39 4.1 4.0 3.0 3.0 0.0 0.0 20.0 20.0 3.6 3.6
Hospital 2 8.4 8.4 8.4 8.4 6.0 6.0 10.9 10.9 3.5 3.5
School 34 5.6 5.5 5.0 4.9 0.0 0.0 29.0 28.0 4.8 4.8
Further facilities 1 10.9 10.9 10.9 10.9 10.9 10.9 10.9 10.9
Preventive care
and rehabilitation 2 9.7 7.8 9.7 7.8 6.9 6.9 12.5 8.6 4.0 1.2
facility
Accommodation 94 6.1 4.8 4.0 3.0 0.0 0.0 36.3 20.0 6.9 4.6
Inn 16 5.6 4.1 3.0 3.0 1.0 1.0 31.4 10.0 7.3 3.3
Hotel 35 8.0 6.4 4.9 4.9 0.0 0.0 36.3 20.0 8.5 5.9
Hotel Garni 19 4.0 3.9 3.0 3.0 0.0 0.0 11.8 11.8 3.6 3.5
Youth hostel 4 8.7 6.4 7.5 7.5 0.0 0.0 19.9 19.9 8.5 4.9
Guesthouse 20 4.5 3.3 3.5 2.5 0.0 0.0 11.8 10.0 4.1 3.3
Further HaFS
94 3.7 2.5 1.0 1.0 0.0 0.0 40.6 19.0 6.6 3.7
business types
Bakery 49 1.6 1.6 0.0 0.0 0.0 0.0 10.0 10.0 2.5 2.5
Butcher 22 7.2 2.2 2.0 2.0 0.0 0.0 40.6 10.6 11.2 2.6
Filling station 20 4.7 4.7 1.5 1.5 0.0 0.0 19.0 19.0 5.7 5.7
Catering 3 5.0 5.0 5.0 5.0 0.0 0.0 10.0 10.0 5.0 5.0
Figure 2 illustrates the distribution of total meat waste ratios related to purchased
weekly meat quantities. Due to a relatively large interquartile range, the broadest distribu-
tion was found for the Gastronomy segment, followed by Accommodation, Communal
Catering and further HaFS business types. Medians of the first three segments were in a
similar range, meaning that 4% to 5% of the weekly purchased meat is wasted. However,
the fourth segment deviates visually in this regard. A Kruskal–Wallis H test showed
that there was a statistically significant difference in meat waste ratios between the four
segments: χ2(3) = 39.370 and p = 0.0001. A post hoc test (Dunn’s pairwise comparison
with Bonferroni adjustment) confirmed that the fourth segment of further business types
has significantly different meat waste ratios compared to the remaining three segments.
No statistically verifiable difference could be found between waste ratios of Gastronomy,
Communal Catering and Accommodation.
Table 4 shows various statistical parameters regarding the total and avoidable meat
waste ratios for the four different segments and associated business types. The highest
mean total and avoidable waste ratios were found for the Gastronomy segment, including
the highest maximum waste ratios. Within this segment, bistros and cafés indicated
the highest waste ratios. Communal Catering and Accommodation segments showed
comparable mean waste ratios. Within the Communal Catering segment, retirement homes
and preventive care and rehabilitation facilities stated the maximum waste ratios. Youth
hostels showed the highest waste values within the Accommodation segment. The lowest
total and avoidable meat waste rates were calculated for further businesses, including the
lowest avoidable waste ratio. Within this segment, the lowest meat waste ratio was foundSustainability 2021, 13, 5059 10 of 20
for bakeries, which was not surprising due to the high convenience degree of the meat (e.g.,
already sliced cold meat to be used in fresh sandwiches).
To test Hypothesis 2 (H2) and verify the relevance of different arising points, the
composition of the waste ratios was analysed (Figure 3). According to Figure 1, waste
during preparation can be categorised as avoidable or unavoidable. Therefore, Figure 3
shows the percentage shares of storage waste, processing waste (unavoidable), processing
waste (avoidable) and leftovers for the segments. The respective shares of the waste types
varied between the four segments. However, leftovers made up the greatest waste amount
for Gastronomy and Accommodation, with the highest share occurring for Communal
Catering. Waste arising during processing (unavoidable and avoidable) as well as storage
waste was highest for the Gastronomy segment. Storage waste, avoidable processing waste
and unavoidable processing waste had the lowest percentage rate within the Communal
Catering segment. Relative figures are given in Figure 3 to support comparisons with
other studies and regions, and absolute values are provided within the annex for national
focused use (Figure A1 Appendix A).
Figure 3. Arising points of meat waste within HaFS segments in percentage.
According to the meat waste definition applied in this paper, the share of uneaten
meat that is taken home for later consumption by consumers (doggy bags) is not included
(Figure 1).
4.2. Extrapolated National HaFS Meat Waste Amounts
Table 5 shows the average meat purchases and waste amounts extrapolated in tons
per year and weighted according to the contribution of each segment to the total HaFS
sector. The extrapolation was based on the representative composition of the segments using
the average purchase and waste quantity and considering the total number of businesses
in Germany.Sustainability 2021, 13, 5059 11 of 20
Table 5. Absolute German HaFS annual meat waste in tons.
Communal Further
Segments Gastronomy Accommodation
Catering HaFS Business Types
Number of establishments, n (Germany) 85,300 88,500 36,800 73,200
Total purchase quantity per year in tons 250,600 402,800 136,600 238,500
Total meat waste per year in tons 23,000 26,500 13,500 22,800
Contribution to total German HaFS meat waste in % 27% 31% 16% 27%
The highest meat waste quantities arose in Communal Catering (26,500 t), contributing
to the total waste volume by 36%. Meat waste in the Gastronomy segment amounted to
23,000 t, followed by further HaFS businesses (22,800 t). The lowest meat waste amount,
however, was found for the segment of Accommodation, in addition to the lowest number
of establishments.
The annual meat waste amounts to 85,800 tons. However, this extrapolation is limited
to the segments under consideration. The recreational sector, correctional facilities and
prisons could not be covered on the basis of the sample. In addition, vegetarian and
vegan restaurants were excluded from the sample due to the focus on meat but considered
regarding the extrapolation of the total meat waste volume, as there was no information
regarding the absolute number or share of vegetarian and vegan restaurants within the
German HaFS market.
4.3. Regression Results
A fractional logistic regression analysis was carried out to identify influencing factors
related to the indicated waste ratios and to verify Hypothesis 1 (H1). Explanatory variables
cover purchasing intensity, the respondent’s occupation (owner, manager, tenant or kitchen
management), the number of different meat types on offer and the number of shopping
locations. Additionally, attitudinal statements towards the awareness and prevention
of food waste in general were included to examine Hypothesis 3 (H3). The significant
coefficients indicate the (decreased or increased) waste ratio in percentage points when
multiplied by 100.
Results in Table 6 show that the meat purchases variable was highly significant. This
indicates that an increase in the weekly meat purchases by 1 t potentially leads to an
increased meat waste ratio of 6.8 percentage points. An increase in the number of meat
types on offer also significantly increases the estimated waste ratio by 0.8 percentage points.
HaFS businesses offering small portions indicated significantly lower meat waste ratios
compared to the ones that did not explicitly pointed out the offer of small servings.
Food service businesses reporting that are sceptical with giving edible surplus food to
social institutions for redistribution indicated significantly higher waste ratios compared to
the base category (fully agree). Other variables were not statistically significant.
4.4. Results of Qualitative Statements of Respondents
Based on the qualitative content analysis, three different categories as well as four sub-
categories were established (Table 7). Within the first category, nine respondents stated that
they do not donate surplus food to food banks as extensive legal requirements, additional
effort and geographical conditions (long distances) have held them back. However, three
interview partners stated that they regularly hand over edible surpluses to a food bank.Sustainability 2021, 13, 5059 12 of 20
Table 6. Results of regression analysis.
Meat Waste Ratio
Meat purchase per week in tons 0.052 ***
(0.017)
Position of an owner within the business (dummy) 0.010
(0.009)
Position of a chef within the business (dummy) 0.000
(0.009)
Number of offered meat types 0.010 ***
(0.002)
Number of meat-sourcing locations −0.007
(0.006)
Offering small portions (dummy) −0.032 **
(0.011)
Attitudinal statements
The avoidance of food waste plays a particularly important role for meat
and meat products (e.g., for economic or ethical reasons) (base: fully agree)
Rather agree −0.010
(0.015)
Rather do not agree 0.013
(0.020)
Training and further education measures for the prevention of food waste
are offered/carried out on a regular basis (base: fully agree)
Rather agree 0.001
(0.008)
Rather do not agree 0.006
(0.012)
Do not agree 0.024 *
(0.013)
Our company participates in a programme to avoid food waste
(base: fully agree)
Rather agree −0.015
(0.013)
Rather do not agree 0.027
(0.027)
Do not agree 0.002
(0.012)
We regularly measure how much food waste we have (base: fully agree)
Rather agree 0.007
(0.013)
Rather do not agree −0.013
(0.011)
Do not agree −0.013
(0.011)
We give what is still edible to social institutions (food banks, etc.)
(base: fully agree)
Rather agree 0.045 **
(0.018)
Rather do not agree 0.051 **
(0.020)
Do not agree 0.032 ***
(0.007)
Notes: Coefficients indicate average marginal effects of multinomial logit regression. Standard errors are reported
in parentheses. Test statistic: Wald test: χ2 (df = 20) = 102.31; McFadden’s pseudo-R2 = 0.027. *** p < 0.01,
** p < 0.05, and * p < 0.1.Sustainability 2021, 13, 5059 13 of 20
Table 7. Results of qualitative content analysis.
Category Code Category Name Frequency
C1 Delivery to food banks 11
C2 Measures implemented to reduce food waste 50
C 2.1 Handing out surpluses for further consumption 30
C 2.2 Further internal processing of surpluses 8
C 2.3 Targeted purchase, pre-cuts, etc. 6
C 2.4 Portion sizes, legal storage time, etc. 6
C3 Explanation of stated waste levels 5
Within the second category, different measures already implemented to reduce food
waste were summarised. Participants described that they give away edible surpluses
to employees and customers (children and parents in schools), consume surplus meals
themselves or give away meat as pet food. In addition, they further process meat internally
into sauces, stocks, soups, pizzas and minced meat. Targeted shopping (including at the
butcher’s), sourcing of pre-cut products and serving of small portions (also in buffet form)
were also described as targeted measures. Regarding the explanation of stated waste rates,
the participants linked waste levels to portion sizes, limited storage time due to food safety
regulations (under four hours for displayed sandwiches) and seasonality. One participant
emphasised that awareness raising among staff is challenging due to language barriers.
5. Discussion and Conclusions
Against the backdrop of planetary boundaries, food systems must be redesigned
to be more sustainable. This is particularly necessary for foods with resource-intensive
production, such as meat. In this context, political decision makers and scientists often
call for a shift in production and consumer diets [22]. However, consumers influence
resource demand not only by the meat eaten but also by wasted meat [18]. This is why
this paper analyses meat waste ratios, evaluates the German status quo on absolute meat
waste quantities and identifies possible future pathways to reduce meat waste in the HaFS
market. The following discussion first classifies the calculated total meat waste with regard
to quantity, possible environmental effects and the methodological approach. Subsequently,
the relevance of different arising points and potential various reduction measures are
assessed, also to provide recommendations for future research and towards policy-makers.
5.1. Classification of the Results against the Background of Environmental Effects
The found medians of meat waste ratios varied among the segments between 1%
(further businesses) to 5% (Gastronomy, Communal Catering). The total meat waste
quantity amounted to 85,800 tons per year, considering four segments and based on a
weighted extrapolation. In 2018, waste out of home, therefore, accounted for 2% of the
total meat consumption in Germany. Related to meat waste quantities covered by UN
food waste segments (food retail, HaFS sector and private households), the avoidable meat
waste of German HaFS businesses accounted for 36% (own calculation, based on values
taken from [47]).
The actual relevance of meat waste becomes apparent against the background of esti-
mated potential savings in connection with environmental benefits. Although a complete
avoidance of wasted meat would certainly be desirable, it nevertheless seems unlikely due
to the increasing marginal costs of necessary measures linked to it. SDG 12.3 aims for the
ambitious target of a 50% reduction in the total food wasted by 2030. Reducing meat waste
by 50% and thus shifting the overall target to a single product group would contribute
to saving approximately 840 kt in CO2 equivalents, an energy expenditure amounting to
17,600 TJ and the avoidance of the use of a land area amounting to more than 1200 km2
(own calculation based on per kilogram values taken from [48]). Thus, about 1.3% of the
total CO2 equivalents of German agriculture in 2018 [49], 0.8% of the total energy use of
German private households in 2018 [50] or 0.7% of the total used agricultural area in Ger-Sustainability 2021, 13, 5059 14 of 20
many in 2017 [51] could potentially be economised. An analysis of the distribution of meat
waste within the segments showed both particularly high (bistro, retirement home, youth
hostel, butcher) and particularly low (home delivery, kindergarten, hotel garni, bakery)
waste ratios (Table 4). Accordingly, some of the participating businesses already reported
having relatively good meat waste prevention management. Accepting mean waste ratios
of the lower quartile (bottom 25%) of each of the four segments as a feasible benchmark
would lead to even greater savings than the realisation of the UN goal: approximately 1300
kt in CO2 equivalents, an energy expenditure amounting to 27,000 TJ and the avoidance of
the use of a land area amounting to more than 1800 km2 .
These absolute results show that reducing meat waste in HaFS alone might not
solve issues such as food gaps or climate change. However, it should be an essential
part of a bundle of different measures contributing to addressing these challenges. On
a strategic and policy level, there are conflicts of objectives that should be mentioned.
Pradhan et al. [52] argue that achieving SDG 12 might lead to trade-offs as an improvement
of responsible production and consumption (SDG 12) and might, for example, result in
reduced availability of food and income and, thus, have negative effects on SDG 2 (hunger),
SDG 3 (health and wellbeing) or SDG 10 (reduced inequalities). Reducing meat waste
means increasing the quantity of food while resource consumption remains the same.
Searchinger et al. [2] rank the reduction in food waste among most promising measures
to close the food gap, the land gap and the GHG mitigation gap. Similar results were
presented by Gerten et al. [1], who assessed a bundle of measures necessary to feed 10
billion people within four terrestrial planetary boundaries (biosphere integrity, land system
change, freshwater use, nitrogen flows). They concluded that reducing food waste is part
of four key prerequisites to reach that goal. This is particularly true for meat waste due to
the high demand for land and resources.
As stated in Section 2, a comparison of the results of this study with the published
literature is hardly possible due to the different reference units used. Looking at the results
of Papargyropoulou et al. [42], who focused on food service businesses in Malaysia (see
Table 1), the magnitude of total meat waste ratios fit, although a consistent drawing of
conclusions is not possible due to the different prevailing frameworks in Germany and
Malaysia. In the present study, the segments Gastronomy and Communal Catering con-
tributed most to the overall German meat waste. WRAP [40] identified priority reduction
potential for meat and fish waste, especially in restaurants (classification of Gastronomy),
QSRs, pubs and services (classification of Communal Catering). Therefore, focussing on the
sectors recommended by WRAP and in terms of prevention of absolute waste quantities is
also favourable in Germany.
5.2. Limitations with Regard to the Calculated Total Meat Waste
A limitation of the study related to an underestimation of overall meat waste quan-
tities might be a perception-related bias, as reported in the literature mainly for private
households [53–55]. Literature references regarding the underestimation of food loss and
waste by experts are rare. However, GSARS [56] found underestimated losses for different
commodities regarding harvest and on-farm post-harvest activities by farmers compared
to objective on-site measurements. Depending on the individual activity, the level of un-
derestimation ranged from approx. 20% to 110%. In the present study, respondents were
expected to have a good overview of purchases and waste ratios for economic reasons and
to be able to make realistic estimates due to the manageable size of a kitchen in comparison
to a farm. The participants were also asked to report weekly values in order to allow for a
realistic assessment of the period under consideration. This also meant that seasonal effects
were not considered. In addition, vegetarian and vegan restaurants were excluded from
the sample due to the focus on meat and meat products. However, they were considered
regarding the extrapolation for the total meat waste volume, as there was no information
regarding the absolute number or share of vegetarian and vegan restaurants within the
German HaFS market. This might have led to a slight overestimation of total meat wasteSustainability 2021, 13, 5059 15 of 20
quantities. In contrast, prisons, correctional facilities and the recreational sector could
not be covered on the basis of the sample. In addition, meat that was taken home for
consumption was out of the scope of consideration.
5.3. Reduction Potential, Practical Implementations and Further Research
In addition to total waste quantities, the authors differentiated between various
arising points. In accordance with expectations, leftovers accounted for the largest share
of the reported meat waste in the Gastronomy, Accommodation and Communal Catering
segments. Leftovers include both overproduction within the kitchen (which was never
served) as well as buffet and plate waste. Thus, prevention measures have to generally
target kitchen staff and managers as well as consumers or guests. A derivation of tailor-
made prevention measures would require a more detailed classification of leftovers, which
was not possible in this study due to financial restrictions. In the present study, the share
of unavoidable processing waste was particularly high within Gastronomy. This was
unexpected, as Kuntscher et al. [57] conclude that the convenience degree of meat and meat
products is relatively high within Communal Catering. Thus, inedible parts have already
been removed and most meat products come portioned and pre-processed (e.g., battered).
The authors assumed that the purchasing approach between Gastronomy and Communal
Catering is comparable, even with a slightly lower convenience degree of purchased meat
in Gastronomy. In addition, the overall share of processing waste was expected to be lower
than the results indicated, which is why there is need for further investigations. In a case
study targeting fish suppliers and their HaFS clients, Kuntscher et al. [57] found benefits
related to total unavoidable fish waste if only the filets were sourced instead of the entire
fish. Fish waste, considered as inedible on the level of HaFS, was then recycled and used
for other food products or food ingredients (e.g., fish soup) at the supply level. Further
research on meat waste prevention could evaluate the scale and thus the potential of early
professional finish of inedible meat fractions (e.g., bones, cartilage).
The share of storage waste was already relatively low for all segments surveyed. A
further reduction could possibly be achieved by extending the shelf life of prepared dishes
using new preparation and storing methods, especially within businesses offering a wide
range of meat types. Głuchowski et al. [58] concluded that the sous-vide method lowered
cooking losses and extended the shelf life of analysed chicken breasts in comparison to
conventional boiling and steaming. Other research investigates the effect of functional ice,
which includes food-grade ingredient solutions within the water matrix and potentially
contributes to an improvement of meat shelf life and quality, especially with poultry (e.g.,
Kataria et al. [59]).
Within further business types, leftovers as well as unavoidable processing meat waste
caused the highest waste volumes. The latter seems reasonable as this segment also includes
butchers, working with a low level of convenience products compared to other business
types. It has to be highlighted again that the interviewed butchers were asked to only
consider unavoidable meat processing waste directly linked to offered food products to go.
A number of already established reduction measures could also be derived from the
results of this study. Cooperation with redistribution organisations in order to provide
edible meat overproduction to people in need is a promising action. The present results
showed that increased meat waste ratios tend to be expected due to a lack of cooperation
with food banks. As adequate cooling and rapid distribution are required to ensure the best
meat safety and quality, food banks must be given as much advance notice as possible of
expected surpluses. However, the redistribution of surpluses for social purposes is often
experienced as complicated or bears the risk of unlawful practices for donors due to legal
hygiene requirements, as indicated by the participating businesses. Policy-makers should
therefore develop clear guidelines on donation to lower redistribution barriers. To minimise
the effort and ensure efficient information flow, matching of offer and demand can be
supported by different mobile applications (Food Cowboy (USA), Food for All (USA), Food
Rescue Heroes (USA), Food Rescue US (USA), Goodr (USA) or No Food Waste (India)).Sustainability 2021, 13, 5059 16 of 20
In addition to meat purchases, the number of meat types offered was related to waste
ratios according to the regression results. Accordingly, it seems especially challenging for
businesses with a wide range of products and a large number of customers to accurately
assess the eating behaviour of the guests. The offering small portions variable was derived
from an open-ended question. As participants were not explicitly asked whether they offer
smaller portions, the effectiveness of this measure should be brought more into focus in
future surveys.
Further relevant actions, which, however, could not be fully confirmed based on this
study, are the measurement of meat waste and communication and education measures.
The engagement with the topic while collecting and weighing food waste supports a posi-
tive adaption process within involved staff (e.g., [60]). United Against Waste Germany [60]
stresses the importance of communication and motivation not only among the kitchen and
service staff but also in cooperation with clients and management. The authors’ experience
shows that comprehensive inclusion of staff and clients within the HaFS is helpful to realise
the full untapped potential.
Further operational conditions could certainly also have an influence on the level of
meat waste but could not be considered here due to the restricted length of the question-
naire. Variables with a potential influence on waste ratios are both portion sizes (offering
above average portions) and the meat price (the supply of expensive cuts) as owners and
managers (should) consider economic aspects. Against this background, a discounted
sale of surplus portions directly to customers could be a promising strategy, especially
for premium meat cuts. Those activities have recently been supported by mobile app
providers such as Too Good to Go (active in multiple European countries), OptiMiam
(France), Karma (Sweden), Surplus (Indonesia), Food for All (USA), goMkt (USA) or ResQ
(Finland, Sweden, Germany, Poland), offering a digital marketplace for selling last-minute
discounted surpluses from restaurants, cafés and other sources.
The effectiveness of a measure and the associated reduction of food waste depend on
the accuracy of implementations for each business [60]. Results of this study showed that
the use of doggy bags is a measure that can only be implemented effectively for certain
business types. The response behaviour of the participants regarding leftovers that are
taken home for further consumption varied between the segments. While all participants
from the Gastronomy segment answered the corresponding question (100%), only 48%
of the respondents assigned to the Community Catering segment provided information
in this regard. This could lead to the conclusion that the use of doggy bags could be
fostered in the Communal Catering segment, however, presumably to a limited degree,
due to different framework conditions (e.g., different consumption situations in canteens,
schools and hospitals) compared to the Gastronomy segment. In addition, 71% of the
participating Gastronomy businesses indicated that they offer doggy bags. The authors
expect further potential in this regard, as the share of German customers who are generally
willing to take home plate leftovers increased from 46% in 2015 to 77% in 2017, and 54% of
the respondents who are not using this option at present could be retuned if doggy bags
were actively offered to them by staff. Apparently, German consumers are ashamed to
ask for a doggy bag for fear of being perceived of as miserly [61]. To facilitate a broader
establishment, the German Ministry of Food and Agriculture supported the development of
an environmentally friendly box for leftovers, which is available wholesale at a reasonable
price [62]. Such support at the national or regional policy level is also provided in other
European countries such as Austria, Belgium, Luxembourg, the Netherlands and Scotland.
Irrespective of the reduction action, benchmarks are first needed to evaluate the
effectiveness of implemented interventions. In this context, the present study has made
an important contribution, as it is the first to quantify meat waste in the German HaFS
sector on a representative scale. The results can also serve as a basis for further analysis
regarding the meat value chain, considering the reference unit used. The approach is an
effective way to obtain an overview of waste quantities and could be widened to other
areas of the chain. Data collection within the German HaFS sector could be extended in theSustainability 2021, 13, 5059 17 of 20
near future, e.g., based on a voluntary agreement between HaFS associations, individual
companies and the German government, which is expected to be set into force in the course
of 2021 as result of the German National Food Waste Strategy [63]. The objective of the
agreement is to measure food waste within HaFS businesses on a regular basis by using
comparable methodological approaches and reference units as well as implementing a
consistent reporting of those values.
An agreement regarding the reduction of meat waste at one level of the FSC is certainly
a step in the right direction. In the future, however, policy-makers as well as representatives
of associations and industry should encourage the reduction in meat waste in cooperation
with clients in later supply chain levels. In June 2020, the UK meat industry in cooperation
with other stakeholders, including the HaFS sector, committed itself to developing and
implementing targeted practices along the entire value chain [64]. A practical application
might also be feasible for the German market. The concrete implementation process could
be derived from the results of WRAP [64].
5.4. Concluding Remarks
In conclusion, this study has shown that there is a need for action with regard to the
occurrence of meat waste in the German HaFS sector. Segments with the largest meat waste
quantities are Gastronomy and Communal Catering, whereby the reduction in unavoidable
losses and leftovers should be a particular focus in the future. A future improvement
as targeted by SDG 12.3 seems feasible with a view to the data collected in this study,
as certain businesses already indicated as having low waste ratios and thus a relatively
effective meat waste prevention management. As outlined above, cooperation among
different stakeholder groups as well as between upstream and downstream levels within
the FSC is essential to achieve the lowest-possible meat waste level. Since comparability is
crucial in the course of data collection and subsequent evaluation of measures, the authors
recommend using the reference value used in this study to capture future developments.
Regarding the assessment of occurring waste quantities and communicating prevention
strategies with target groups, environmental effects should be taken into consideration.
As meat is only one food product group connected with comparably high environmental
effects, dairy products should also be considered in this regard and thus could be the focus
of future research.
Author Contributions: Conceptualisation, A.J.T., F.S. and J.E.; methodology, A.J.T.; validation, F.S.
and J.E.; formal analysis, A.J.T.; resources, F.S. and J.E.; data curation, A.J.T. and F.S.; writing—original
draft preparation, A.J.T. and F.S.; writing—review and editing, all; visualisation, A.J.T. All authors
have read and agreed to the published version of the manuscript.
Funding: This research received no external funding.
Institutional Review Board Statement: Not applicable.
Informed Consent Statement: Informed consent was obtained from all subjects involved in the study.
Data Availability Statement: The data presented in this study are available on request from the
corresponding author. The data are not publicly available due to privacy restrictions.
Acknowledgments: The authors would like to thank Sebastian Neuenfeldt for statistical support
and Ronja Herzberg for proofreading.
Conflicts of Interest: The authors declare no conflict of interest.You can also read