The neuromuscular junction is a focal point of mTORC1 signaling in sarcopenia - Nature
←
→
Page content transcription
If your browser does not render page correctly, please read the page content below
ARTICLE
                  https://doi.org/10.1038/s41467-020-18140-1                 OPEN

                  The neuromuscular junction is a focal point of
                  mTORC1 signaling in sarcopenia
                  Daniel J. Ham 1,4, Anastasiya Börsch1,4, Shuo Lin1, Marco Thürkauf1, Martin Weihrauch1, Judith R. Reinhard1,
                  Julien Delezie1, Fabienne Battilana1, Xueyong Wang2, Marco S. Kaiser 1, Maitea Guridi1, Michael Sinnreich3,
                  Mark M. Rich 2, Nitish Mittal1, Lionel A. Tintignac3, Christoph Handschin 1, Mihaela Zavolan 1,4 &
                  Markus A. Rüegg 1,4 ✉
1234567890():,;

                  With human median lifespan extending into the 80s in many developed countries, the
                  societal burden of age-related muscle loss (sarcopenia) is increasing. mTORC1 promotes
                  skeletal muscle hypertrophy, but also drives organismal aging. Here, we address the question
                  of whether mTORC1 activation or suppression is beneficial for skeletal muscle aging. We
                  demonstrate that chronic mTORC1 inhibition with rapamycin is overwhelmingly, but not
                  entirely, positive for aging mouse skeletal muscle, while genetic, muscle fiber-specific acti-
                  vation of mTORC1 is sufficient to induce molecular signatures of sarcopenia. Through inte-
                  gration of comprehensive physiological and extensive gene expression profiling in young and
                  old mice, and following genetic activation or pharmacological inhibition of mTORC1, we
                  establish the phenotypically-backed, mTORC1-focused, multi-muscle gene expression atlas,
                  SarcoAtlas (https://sarcoatlas.scicore.unibas.ch/), as a user-friendly gene discovery tool.
                  We uncover inter-muscle divergence in the primary drivers of sarcopenia and identify the
                  neuromuscular junction as a focal point of mTORC1-driven muscle aging.

                  1 Biozentrum, University of Basel, Basel, Switzerland. 2 Department of Neurology, Neuroscience, Cell Biology, and Physiology, Wright State University, Dayton,

                  OH, USA. 3 Department of Biomedicine, Pharmazentrum, University of Basel, Basel, Switzerland. 4These authors contributed equally: Daniel J. Ham,
                  Anastasiya Börsch, Mihaela Zavolan, Markus A. Rüegg. ✉email: markus-a.ruegg@unibas.ch

                  NATURE COMMUNICATIONS | (2020)11:4510 | https://doi.org/10.1038/s41467-020-18140-1 | www.nature.com/naturecommunications                                    1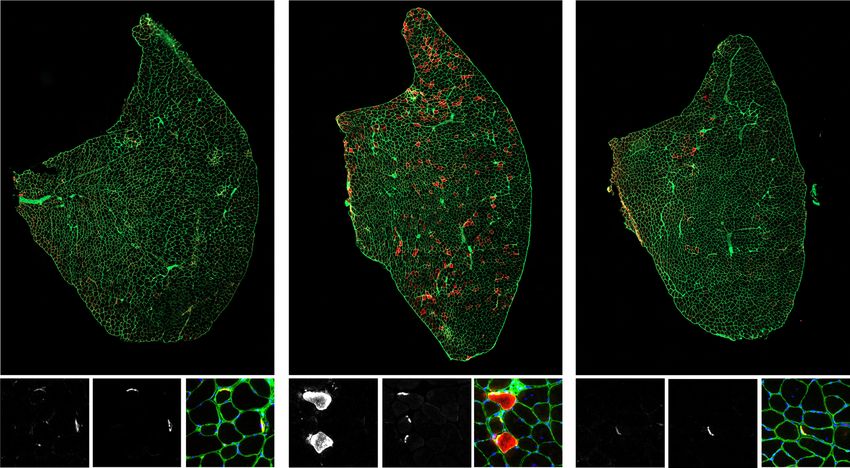
ARTICLE                                                                  NATURE COMMUNICATIONS | https://doi.org/10.1038/s41467-020-18140-1

R
        apid advances in treating life-threatening, age-related dis-          93M diet at 42 mg kg−1 of food, corresponding to a dose of ~4
        eases, such as cancer and cardiovascular disease, have                mg kg−1 day−1, starting at 15 months (termed CON-middle and
        extended human lifespan in many countries, but exposed                RM-middle, respectively) or 20 months (CON-late and RM-late)
other age-related diseases, including sarcopenia, the age-related             of age. This dose of rapamycin extends the lifespan maximally in
loss of muscle mass and strength. Sarcopenia constrains physical              male C57BL/6 mice21. Importantly, we carefully monitored body
activity, degrades the quality of life, and is a major burden on              mass and food intake, and implemented a controlled feeding
society1.                                                                     regime to curb the typical weight gain and obesity resulting from
    Recently, nine processes involved in aging were proposed2,                overeating in sedentary C57BL/6 mice22. Control mice main-
namely cellular senescence, stem cell exhaustion, genomic                     tained their pretrial body mass until around 26 months of age, at
instability, telomere attrition, loss of proteostasis, deregulation of        which point body mass progressively declined (Fig. 1a and Sup-
nutrient sensing, epigenetic alterations, mitochondrial dysfunc-              plementary Fig. S1A). Rapamycin-treated mice, irrespective of the
tion, and altered intracellular communication. Each biological                treatment onset, steadily lost body mass from ~20 months of age,
process fulfils three hallmark criteria: (1) it occurs during normal           and were significantly lighter than control mice from 26 months
aging, (2) intensifying the process accelerates aging, and (3)                onward. Food intake, normalized to body surface area, sig-
dampening the process delays aging. Overactivity of the mam-                  nificantly declined across the trial period in CON-middle mice,
malian (or mechanistic) target of rapamycin complex 1                         but this decline was completely prevented by rapamycin (Fig. 1b
(mTORC1) is central to many of these processes3, and dam-                     and Supplementary Fig. S1A). Bimonthly MRI recordings of body
pening mTORC1 activity by its allosteric inhibitor rapamycin is               composition showed that the accentuated loss of body mass in
one of the most effective interventions to prolong life4. However,            rapamycin-treated mice was the result of lean mass loss, rather
mTORC1 activity is also required for muscle hypertrophy5,6.                   than fat mass loss, which markedly declined in both control and
Therefore, there is concern that suppressing mTORC1 to extend                 rapamycin groups (Fig. 1c, d and Supplementary Fig. S1A).
lifespan could be at the expense of skeletal muscle function,                    To ensure that our intervention period spanned a measurable
thereby extending the “poor-quality” period of life7.                         loss of muscle function in control mice consistent with the
    In previous work, we have shown that mTORC1 activity must                 development of sarcopenia, we performed repeated measures of
be finely balanced in skeletal muscle. Constitutive, muscle-specific            whole-body muscle function throughout the experiment. In
depletion of mTOR or the mTORC1 component raptor induces                      CON-middle and CON-late mice, all-limb grip strength
severe myopathy8,9. Likewise, specific depletion of raptor in                  decreased by ~20% by the age of 30 months, while grip strength
muscle progenitors severely impacts muscle development and is                 remained stable in rapamycin-treated mice (Fig. 1e). Similarly,
prenatally lethal10. On the other hand, constitutive, skeletal                voluntary wheel-running distance decreased ~40% in control
muscle-specific knockout of tuberous sclerosis complex 1 (TSC1),               mice, while rapamycin significantly improved the running
an upstream inhibitor of mTORC1, in mice (TSCmKO) leads to                    distance at the ages of 24 and 28 months (Fig. 1f). Rapamycin
sustained activation of mTORC1 and increased protein synthesis.               significantly improved inverted grid-hang time, which was
However, rather than developing hypertrophic muscles,                         sharply lower in 30-month-old CON-middle mice compared to
TSCmKO mice experience dysregulated proteostasis and develop                  a 10-month-old control group (10mCON, Fig. 1g). Rapamycin
a late-onset myopathy11,12. In rodents, mTORC1 activity is high               also significantly curtailed the age-related reduction in stride
in sarcopenic compared to adult muscle13–17, and the same has                 length (Fig. 1h), without affecting other gait parameters
been seen in human biopsies18. Finally, rapamycin ameliorates                 (Supplementary Fig. S1B–I). Consistent with reductions in food
muscle function in a number of muscular dystrophies19,20. Thus,               intake, 30-month-old mice displayed lower whole-body energy
it remains an open question as to whether activation or inhibition            expenditure, especially in the early morning and early evening
of mTORC1 could counteract sarcopenia.                                        (Fig. 1i–j), coinciding with low-activity levels (Supplementary
    Here, we demonstrate that long-term rapamycin treatment is                Fig. S1J, K). Respiratory exchange ratio (RER, Supplementary
overwhelmingly positive in aging skeletal muscle, preserving                  Fig. S1L, M) was also lower, indicating greater proportional fat
muscle size, function, and neuromuscular junction (NMJ) integ-                utilization in 30- than 10-month-old mice during the low-activity,
rity. Interestingly, responsiveness to rapamycin differs between              early morning period. In contrast, rapamycin-treated mice
muscles, suggesting that the primary drivers of age-related muscle            maintained a youthful energetic profile, with higher energy
loss may differ between muscles. To dissect the key signaling                 expenditure and daytime RER than control mice at 30 months,
nodes associated with mTORC1-driven sarcopenia, we create a                   and an associated increase in VO2 ml kg−1 min−1 (Supplemen-
comprehensive multimuscle gene expression atlas from (1) adult                tary Fig. S1N, O). Importantly, the magnitude of the ubiquitous
(10-months old), (2) geriatric (30-months old), and (3) geriatric,            reductions in skeletal muscle function and whole-body metabo-
rapamycin-treated mice using mRNA-seq. We integrate these                     lism in 30-month-old mice compared to 10- to 20-month-old
data with gene expression profiles of muscle from TSCmKO mice                  mice is consistent with the clinical definition of sarcopenia23.
and synaptic and extra-synaptic regions. We identify the NMJ as               Thus, this extensive, repeated-measures approach conclusively
a focal point of skeletal muscle responses to aging and                       demonstrates a substantial age-related loss of muscle function
mTORC1 signaling, and create SarcoAtlas, a comprehensive,                     across the treatment period, and that rapamycin effectively blunts
publicly available (https://sarcoatlas.scicore.unibas.ch/) resource           these changes. Survival rates in our study were relatively high,
to further our understanding of the molecular mechanisms                      with 59% of control and 68% of rapamycin-treated mice reaching
involved in sarcopenia. We conclude that overactivity of skeletal             30 months of age. This compares favorably with the previously
muscle fiber mTORC1 fulfils the three criteria necessary to be a                reported median lifespan for male C57BL/6 mice of ~29 months24,
hallmark of sarcopenia, and thereby firmly establish the                       and could be related to our specific experimental conditions, such
TSCmKO mouse as a model of accelerated sarcopenia.                            as single caging, the AIN-93M diet, and carefully controlled
                                                                              feeding in control mice to avoid overeating.
                                                                                 As the endpoint results (i.e., at 30 months of age) for RM-
Results                                                                       middle and RM-late mice were very similar (Fig. 1a–f), we pooled
Rapamycin attenuates sarcopenia. To examine the impact of                     the data for all further analyses (30mRM). Consistent with the
long-term rapamycin treatment, male C57BL/6 mice were fed                     age-related loss of whole-body function, mass of all measured
encapsulated rapamycin incorporated into a standardized AIN-                  muscles was significantly lower in 30-month-old mice (30mCON)

2                 NATURE COMMUNICATIONS | (2020)11:4510 | https://doi.org/10.1038/s41467-020-18140-1 | www.nature.com/naturecommunications
NATURE COMMUNICATIONS | https://doi.org/10.1038/s41467-020-18140-1 ARTICLE
a 36 b 0.25 c d
Food intake (g.cm–2.day–1)
34 * 0.24
** 6
** ***** # ** 26
**
Body mass (g)
Lean mass (g)
32
Fat mass (g)
*** 0.23
30 24 4
0.22
28
CON-middle 0.21
22 * ** 2
26 RM-middle ***
CON-late ***
24 RM-late 0.20 20
0 0.00 0 0
16 18 20 22 24 26 28 30 16 18 20 22 24 26 28 30 16 18 20 22 24 26 28 30 16 18 20 22 24 26 28 30
Age (months) Age (months) Age (months) Age (months)
e f g 10mCON
0.095 3000 CON-middle (30 m)
100 RM-middle (30 m)
***
running distance (m)
All-limb grip strength/
# 2500
body mass (N.g–1)
% remaining on grid
0.085 **
Inverted hang test
80
24 h voluntary
2000
0.075 *
60
1500
0.065 1000 40 *** **
CON-middle
RM-middle 500 20
0.055 CON-late
RM-late
0.0 0 0
16 18 20 22 24 26 28 30 19 21 22 24 26 28 30 0 3 6 9 12 15
Age (months) Age (months) Time (min)
h 8mCON i j 10mCON
CON-middle (28 m) 10mCON CON-middle (25 m)
RM-middle (28 m) CON-middle (30 m) RM-middle (25 m)
9 0.0009 0.0010 CON-middle (30 m)
RM-middle (30 m) #
* ** RM-middle (30 m) **
8 *** ***
Energy expenditure
(kcal.BM–0.75.min–1)
Energy expenditure
0.0008 (kcal.BM–0.75.min–1)
Stride length (cm)
* *
7 0.0008 **
6 0.0007 ***
***
#
* * * #
5 ** 0.0006
0.0006 *
4
**
* * ** #
3 0.0005 0.0004
0 0.000 0.0000
Hindlimb Forelimb 0600 1000 1400 1800 2200 0200 0600 Day Night
Time
Fig. 1 Rapamycin slows age-related decrements in whole-body muscle function and metabolism. a Body mass for mouse groups receiving rapamycin (~4
mg kg−1 day−1) or control diet beginning at 15 months (CON-middle and RM-middle) or 20 months (CON-late and RM-late) of age; n = 18 (CON-middle),
17 (RM-middle), 5 (CON-late), and 9 (RM-late) mice. b Mean daily food intake for middle-aged groups; n = 18 (CON-middle) and 17 (RM-middle) mice.
Bimonthly recordings of whole-body lean (c) and fat mass (d); n = 18 (CON-middle), 17 (RM-middle), 6 (CON-late), and 9 (RM-late) mice. e All-limb grip
strength normalized to body mass; n = 19 (CON-middle), 18 (RM-middle), 6 (CON-late), and 9 (RM-late) mice. f Twenty-four hours of voluntary running-
wheel distance; n = 16 (CON-middle), 15 (RM-middle), 6 (CON-late), and 9 (RM-late) mice. Note that improvements by rapamycin were similar,
irrespective of the time of treatment onset. g Kaplan–Meier plot for the inverted grip-hang test performed prior to endpoint measures at 30 months of age
for the middle-aged group; n = 11 (10mCON), 18 (CON-middle), and 18 (RM-middle) mice. h Gait analysis of forelimb- and hindlimb-stride length at
28 months of age for middle-aged groups; n = 8 (8mCON), 9 (CON-middle), and 10 (RM-middle) mice. i Whole-body metabolic analysis of energy
expenditure normalized to body surface area reported every 2 h across one full day (white)/night (black) cycle in the month prior to endpoint measures
and j mean day and night values recorded at 25 and 30 months of age for middle-aged groups; n = 12 (10mCON), 14 (25mCON), 13 (25mRM), 9
(30mCON), and 10 (30mRM) mice. Data are presented as mean ± SEM. For a, b, e, and f, both control groups (CON-late and CON-middle) and both RM
groups (RM-late and RM-middle) were combined for statistical comparisons. Two-way repeated-measure ANOVA with Sidak or Tukey post hoc tests
(a–f, i–j), Mantel–Cox log rank (g), and one-way ANOVA with Fisher’s LSD post hoc tests (h) was used to compare the data. *, **, and *** denote a
significant difference between groups of P < 0.05, P < 0.01, and P < 0.001, respectively. # denotes a trend where 0.05 < P < 0.10. Colored asterisks refer to
the group of comparison.
compared to 10-month-old control mice (10mCON) when muscle-specific responses to rapamycin were also evident in
normalized to body mass (Fig. 2a) and for absolute mass absolute muscle mass, where triceps was significantly heavier and
(Supplementary Fig. S2A). Despite the ubiquitous age-related GAS significantly lighter in 30mRM than 30mCON mice
reductions in limb muscle mass, the effects of rapamycin were (Supplementary Fig. S2A). Long-term rapamycin treatment also
muscle-specific. Rapamycin protected against the age-related loss prevented the age-related increase in heart mass, and attenuated
of relative muscle mass in the tibialis anterior (TA), extensor the increase in mass of nonfunctional tissues, such as the seminal
digitorum longus (EDL), and triceps brachii (TRI) muscles, vesicles, but induced severe testicular degeneration (Supplemen-
partially protected relative mass in the quadriceps (QUAD), tary Fig. S2B), as previously observed7. Scatterplots showed a
plantaris (PLA), and soleus (SOL) muscles, but did not protect strong linear relationship between muscle and body mass in all
relative mass in the gastrocnemius (GAS) muscle (Fig. 2a). The groups. However, for the same body mass, muscle mass was lower
NATURE COMMUNICATIONS | (2020)11:4510 | https://doi.org/10.1038/s41467-020-18140-1 | www.nature.com/naturecommunications 3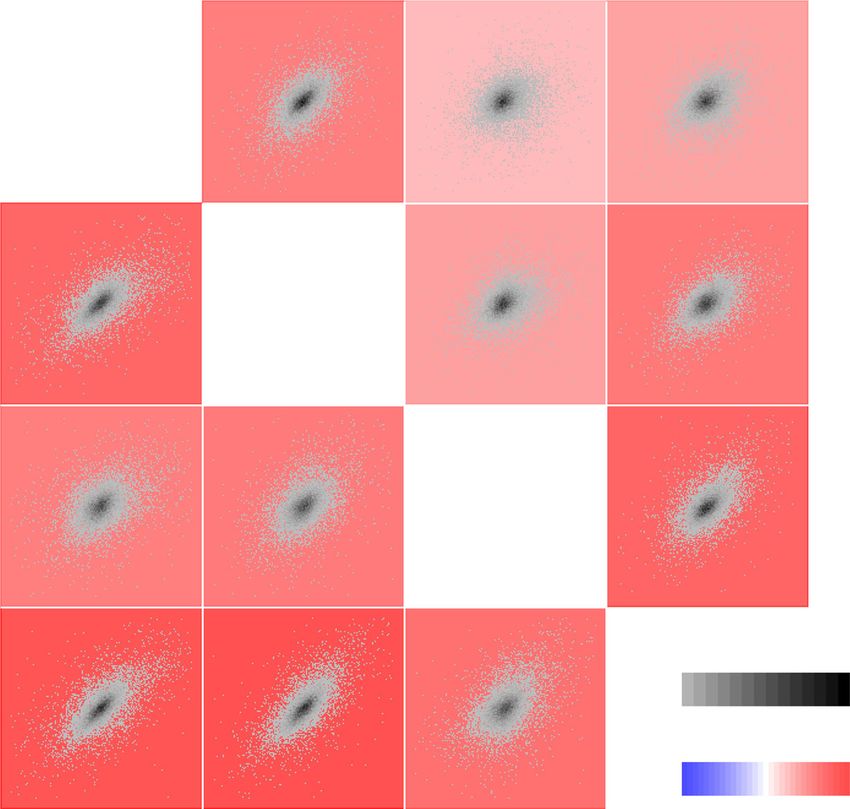
ARTICLE NATURE COMMUNICATIONS | https://doi.org/10.1038/s41467-020-18140-1
a 10mCON 30mCON 30mRM c d e
1.50 *** 20
Skeletal muscle mass/Body mass
Protected Partially-protected Not
*** *** *** 450 ** 10mCON
* protected 450 *** *** *** **
** 30mCON *** ***
** **
EDL: peak tetanic force /
(normalised to 10mCON)
*
**
EDL: tetanic force (mN)
** * 30mRM
1.25 ******
body mass (mN.g–1)
*** *** 350 P=0.05
15
*** *** ****** 350
EDL: Force (mN)
*** ***
* 250
1.00 ***
250 10
150
0.75
80 150
70 ** 5
0.50
60
** * 50
** 30m ** RM
0 0 0
TA EDL TRI QUAD PLA SOL GAS # # 300 12 ***
SOL: peak tetanic force /
b 250 ** * **
SOL: tetanic force (mN)
SOL: tetanic force (mN)
body mass (mN.g–1)
175 250 *
TRI GAS
200 * 9
**
150 ** **
Muscle mass (mg)
* * * 200
125 150 *#
150 6
100 100 100
75 3
10mCON 50
*
50
50 30mCON
30mRM
0 0 0 0
0 20 24 28 32 0 20 24 28 32 36 0 50 100 150 200 250 0 10 20 30 40
30 ON
m N
M
30 CO
R
Body mass (g) Body mass (g) Stimulation frequency (Hz) Number of contractions
C
m
m
10
f * 10mCON v 30mCON
30mRM v 30mCON
g
**
*** 30mRM v 10mCON 10mCON 30mCON 30mRM
20
%Type IIA fibers
10mCON
30mCON
15 30mRM
10
5
0
20 *10mCON v 30mCON
** 30mRM v 30mCON
%Type IIX fibers
15
10
5
0 500 µm
10mCON v 30mCON
15 ***
*** 10mCON v 30mRM
%Type IIB fibers
10
5
100 µm
0
0 20 40 60 Type I; Type IIA; Type IIB; Type IIX (no staining); Laminin
TA: min fiber feret (µm)
h i 400
j 10mCON
10mCON 30mCON **
**
(Total fibers in groups of 4+)
IIA 30mCON
*
30mRM
%centro-nucleated fibers
***
** 15
30mRM
300
IIA fiber grouping
Fiber type
IIX
10
200
IIB
100 5 ***
**
P=0.06
Total
0 0
0 500 1000 1500 2000 2500 3000 3500 IIA IIX IIB
30 N
M
30 ON
O
R
TA: fiber number
C
C
m
TA: fiber type
m
m
10
in 30mCON compared to 10mCON mice (Fig. 2b and As rapamycin-induced changes in non-skeletal muscle tissue
Supplementary Fig. S2C–F). In 30mRM mice, this relationship (e.g., cardiac) and behavioral alterations could also affect muscle
was shifted toward higher muscle mass in muscles protected by performance in mice, we next tested muscle function directly in
rapamycin (e.g., TA and TRI), but not in those that were not the fast EDL muscle and slow SOL muscle. In line with the age-
protected by rapamycin (e.g., GAS, Fig. 2b and Supplementary related loss of muscle mass and strength, tetanic force was
Fig. S2C–F). significantly lower in 30mCON mice compared to 10mCON
4 NATURE COMMUNICATIONS | (2020)11:4510 | https://doi.org/10.1038/s41467-020-18140-1 | www.nature.com/naturecommunications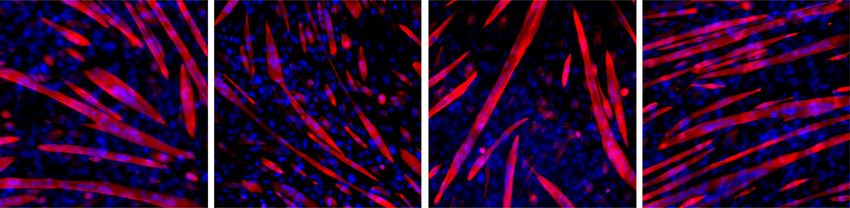
NATURE COMMUNICATIONS | https://doi.org/10.1038/s41467-020-18140-1                                                                             ARTICLE

Fig. 2 Rapamycin attenuates the age-related loss of muscle size and function. a Muscle mass for quadriceps (QUAD), gastrocnemius (GAS), tibialis anterior
(TA), plantaris (PLA), extensor digitorum longus (EDL), soleus (SOL), and triceps brachii (TRI) was averaged across both limbs, normalized to body mass and
then to 10-month-old control mice. b Scatterplot and linear regression of the relationship between body and muscle mass of a forelimb (TRI) and the non-
rapamycin-responsive hindlimb (GAS) muscle. Isolated muscle function parameters, including (c) force-frequency curve, d fatigue response to multiple
stimulations, and (e) peak force normalized to body mass for EDL (top panel) and SOL muscle (bottom panel). f Fiber-type-specific cross-sectional area
analyzed on whole cross sections from TA muscle, stained with antibodies against type I (yellow), type IIA (green), and type IIB (red) fibers as well as
laminin (blue), while fibers without staining were classified as IIX. g Representative images with magnification of IIA (green fiber, left bottom)-rich and IIB
(red fiber, right bottom)-rich regions. White arrows indicate grouping (four or more neighboring fibers) of IIA fibers in rapamycin-treated mice. h Mean
total and fiber-type-specific fiber number from whole TA cross sections. i Counts of IIA fibers in groups of four or more neighboring fibers, per cross
section, and j the percentage of fibers with centralized nuclei. For f, between-group statistical comparisons were performed on the mean fiber minimum
Feret. Group numbers for 10mCON are n = 17 (a, b), 10 (c, e: EDL), 11 (c, e: SOL), 8 (d: EDL), 9 (d: SOL), 11 (f–i), and 9 (j) mice, for 30mCON n = 20 (a, b),
19 (c–e: EDL), 15 (c–e: SOL), 13 (f–i), and 10 (j) mice, and for 30mRM n = 23 (a, b), 22 (c–e: EDL), 18 (c, e: SOL), 17 (d: SOL), 14 (f–i), and 10 (j) mice. Data
are presented as mean ± SEM. One-way (a and e–j) or two-way repeated- measure (c, d) ANOVAs with Fisher’s LSD or Tukey’s (when ANOVA was not
significant) post hoc tests were used to compare between data. *, **, and *** denote a significant difference between groups of P < 0.05, P < 0.01, and P <
0.001, respectively. Colored asterisks refer to the group of comparison.

above a stimulation frequency of 100 Hz in EDL (Fig. 2c, upper)                   (Supplementary Fig. S4A, C, E). Increased IIA fiber size was also
and 50 Hz in SOL (Fig. 2c, lower). Likewise, peak tetanic force                   observed in 30mRM compared to 30mCON in EDL and TRI, but
was significantly lower in both the EDL (Supplementary Fig. S2G)                   not SOL (Supplementary Fig. S4B, D, F).
and SOL (Supplementary Fig. S2M) in 30mCON compared to                               Fiber-type grouping is interpreted as compensatory reinnerva-
10mCON. Rapamycin treatment significantly improved both                            tion of denervated fibers by neighboring axons29,30. Motor
EDL and SOL peak tetanic force, compared to 30mCON. The                           neurons that innervate type IIA muscle fibers are more efficient at
rapamycin-induced improvement in peak tetanic force was at                        reinnervating denervated fibers than those innervating IIB
least partially the result of improved muscle quality. Specific                    fibers26. In 10mCON mice, IIA fibers were well dispersed within
force, representing peak force normalized to muscle cross-                        TA cross sections (Fig. 2g). While the number of “grouped” IIA
sectional area, was unaltered by age, but significantly higher in                  fibers (defined as four or more neighboring IIA fibers) did not
30mRM than both 10mCON and 30mCON in EDL and SOL                                  increase in 30mCON compared to 10mCON mice, rapamycin
(Supplementary Fig. S2H, N). In contrast, rapamycin reduced                       promoted a more than twofold increase in IIA fiber grouping
peak twitch force in EDL muscle without significantly altering                     (white arrows in Fig. 2g; quantification Fig. 2i). In addition,
other twitch properties (Supplementary Figs. S2I-K and S2O-Q).                    muscle degeneration/regeneration, as evidenced by the presence
Fatigue resistance was higher in 30mCON and 30mRM than                            of centralized nuclei, strongly increased in the TA of 30mCON
10mCON mice in the EDL (Fig. 2d, upper and Supplementary                          compared to 10mCON (Fig. 2j and Supplementary Fig. S5A).
Fig. S2L), but not SOL (Fig. 2d, lower and S2R). Importantly, in                  Interestingly, this age-related increase in centro-nucleated fibers
line with whole-body grip-strength measurements, when normal-                     was both fiber- and muscle-type specific. In the TA, the number
ized to body mass, the age-related loss of EDL and SOL peak                       of centro-nucleated fibers was significantly higher in both IIX and
tetanic force was completely prevented by rapamycin (Fig. 2e).                    IIB fibers, but not IIA fibers, with the proportion of centro-
   Muscle fiber loss and type II fiber atrophy are prominent                        nucleated IIB fibers approximately fivefold higher than IIX fibers.
contributors to sarcopenia25–27. Indeed, we observed a strong                     Age-related increases in centro-nucleated fibers were less
reduction in minimum fiber Feret’s diameter of IIB and mild                        pronounced in the EDL (Supplementary Fig. S5B), with trends
reductions in IIA and IIX fibers (Fig. 2f, g), and a trend for                     observed in both IIA and IIB fibers, and nonexistent in the SOL
reduced total fiber number (Fig. 2h) in TA muscle from 30mCON                      (Supplementary Fig. S5C). Rapamycin did not alter the
compared to 10mCON mice. While IIB fiber atrophy was also a                        prevalence of centro-nucleated fibers in the TA, but higher
prominent feature in the TA muscle of 30mRM mice, a                               numbers of centro-nucleated IIB fibers were observed in the EDL
concurrent increase in size and number of IIA fibers was                           compared to 10mCON. Together, these results indicate that
observed, such that minimum fiber Feret’s diameter and fiber                        rapamycin improves muscle size by increasing the size and
number was significantly higher than in both 30mCON and                            number of IIA muscle fibers, but does not reduce muscle
10mCON mice (Fig. 2f, h). Interestingly, higher IIA but not IIX                   degeneration/regeneration.
or IIB fiber number strongly correlated with a larger fiber size in
TA muscle from 30mCON and 30mRM (Supplementary                                    Muscle fiber mTORC1 drives muscle wasting. It is still debated
Fig. S3A–C), indicating that IIB/X-to-IIA fiber conversion could                   whether mTORC1 activity in skeletal muscle at high age is too
explain IIA fiber enlargement in 30mRM. Analysis of a small                        high or too low16,31. However, recent evidence indicates that
subgroup of 21-month-old mice treated with control (21mCON)                       mTORC1 activity, as measured by the phosphorylation status of
or rapamycin (21mRM) diets for 6 months showed that the                           its downstream targets S6 kinase or S6, increases in old skeletal
enlargement of IIA and IIX fibers occurs in rapamycin-treated                      muscle13–18. So far, our data clearly demonstrate that systemic
mice prior to measurable changes in muscle mass or fiber size                      rapamycin administration attenuates the age-related loss of
(Supplementary Fig. S3D–H). IIA and IIX fiber size was                             muscle mass and function. However, while mass in some muscles
significantly larger in TA muscle from 21mRM than both                             (e.g., TA) is preserved by rapamycin treatment, this is not the case
21mCON and 10mCON mice (Supplementary Fig. S3F–H).                                in others (e.g., GAS). To test whether age- and rapamycin-
Interestingly, a fast-to-slow fiber-type shift is also observed                    mediated changes in mTORC1 signaling were also muscle spe-
upon muscle-specific ablation of raptor in adult mice28,                           cific, we next examined the phosphorylation of mTORC1 targets
suggesting a direct effect of mTORC1 inhibition on the fiber-                      in both the TA and GAS using western blot analysis (Fig. 3a). We
type composition of muscle. Similar, although less pronounced,                    measured the phosphorylation status of S6 (S240/244) and 4EBP1
fast-to-slow fiber-type shifts were also seen in 30mRM, but not                    (T37/46), which are both involved in protein synthesis regulation,
30mCON, compared to 10mCON in the EDL, TRI, and SOL                               as well as PKB/AKT (T308), which is dampened by inhibitory

NATURE COMMUNICATIONS | (2020)11:4510 | https://doi.org/10.1038/s41467-020-18140-1 | www.nature.com/naturecommunications                                       5
ARTICLE NATURE COMMUNICATIONS | https://doi.org/10.1038/s41467-020-18140-1
a TA GAS b c d
10m 30m 30mRM 10m 30m 30mRM 10mCON
100 kDa α-actinin 3 2.0 2.0 30mCON
75 kDa * *** 30mRM
p4EBP1T37/46/4EBP1
P62 P=0.07
1.5 * ** 1.5
pAKTT308/AKT
pS6S240/244/S6
T308
pAKT 2
50 kDa
1.0 1.0
AKT
50 kDa
pS6
S240/244 1
25 kDa 0.5 0.5
25 kDa S6
T37/46
15 kDa p4EBP1 0 0.0 0.0
G A
G A
G A
G A
G A
G A
AS
AS
AS
AS
AS
AS
4EBP1
G A
G A
G A
AS
AS
AS
T
T
T
T
T
T
T
T
T
15 kDa
e f
10mCON 30mCON 30mRM 8 * **
%pS6S235/236+ fibers
6
4
2
0
M
m N
30 ON
30 CO
R
C
m
m
10
g
***
40
Min fiber feret μm
30
500 μm
20
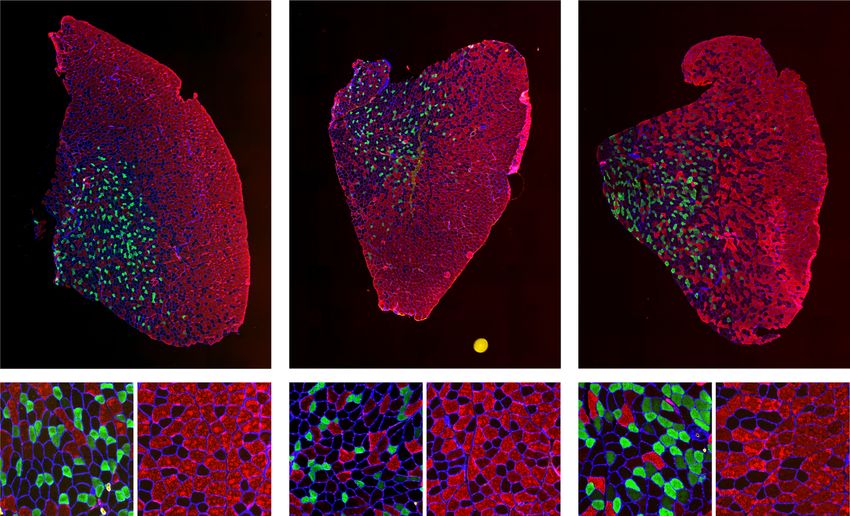
pS6 α-BTX Merge pS6 α-BTX Merge pS6 α-BTX Merge
10
0
50 µm
6+
6-
pS
pS6S235/236 / α-BTX / Laminin / DAPI
pS
h i
CON Cytokines RM Cytokines + RM
*** ***
(normalised to respective control)
Myotube diameter
1.0
0.6
0.2
100 μm
Desmin / DAPI Cytokines – + – +
RM – – + +
j CON
k 3 *** l CON
*** Cytokines: + + *** Cytokines
ATF4 protein abundance
Cytokines RM: + + Cytokines + RM
***
(normalised to control)
4
p62 protein abundance
6
(normalised to control)
RM
mRNA abundance
Cytokines+RM 100 kDa α-actinin *** **
(fold of control)
50 kDa
* ATF4 2 3
4 *
*** Bafilomycin
** *** Cytokines: + + + + 2
*** ** * 1 ** *
** RM: + +
2 *
p62 1
50 kDa
37 kDa GAPDH
0 0 0
Tp53 Atf4 Ppp1r15a Hspa5 Ddit3 Sqstm1 Cytokines – + – +
CON Bafilomycin
RM – – + +
feedback from the mTORC1 target S6K1 via IRS132. We also phosphorylated to total 4EBP1 was significantly lower in
examined the levels of the autophagy marker p62, which accu- 30mCON than 10mCON mice, while rapamycin restored the
mulates in muscle upon mTORC1 activation11. The ratio of ratio (Fig. 3c). There was a tendency for lower pAKT/AKT
phosphorylated to total S6 was significantly higher in 30mCON (Fig. 3d) and higher p62 (Supplementary Fig. S6A) protein levels
compared to 10mCON muscles, and was significantly suppressed in 30mCON compared to 10mCON mice, but rapamycin did not
by rapamycin treatment (Fig. 3b). Conversely, the ratio of significantly affect these parameters. However, no differences
6 NATURE COMMUNICATIONS | (2020)11:4510 | https://doi.org/10.1038/s41467-020-18140-1 | www.nature.com/naturecommunications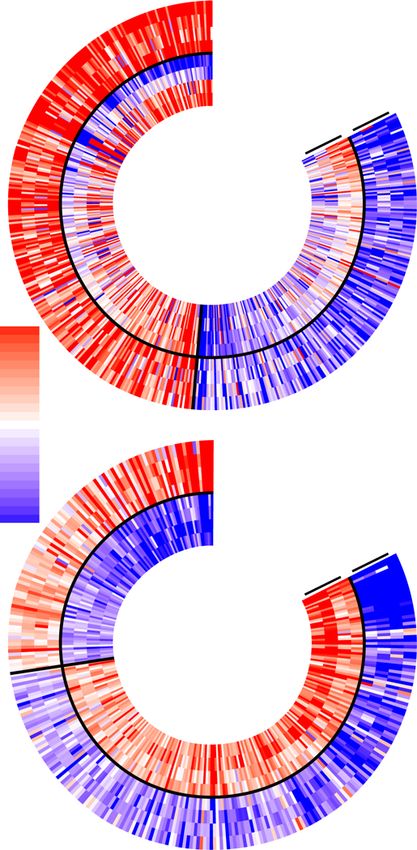
NATURE COMMUNICATIONS | https://doi.org/10.1038/s41467-020-18140-1                                                                      ARTICLE

Fig. 3 Rapamycin-sensitive mTORC1 activity increases in sarcopenic muscle fibers and drives muscle wasting in vitro. a Representative western blot
analysis of AKT-mTORC1 pathway components in 10mCON, 30mCON, and 30mRM in both the tibialis anterior (TA) and gastrocnemius (GAS) muscle.
Similar results were obtained for each protein across three separate gels with different samples. Quantification of western blots showing the abundance of
phosphorylated protein normalized to total protein for (b) S6, (c) 4EBP1, and (d) AKT. e Representative images of TA cross sections stained for pS6S235/
236 (red), α-bungarotoxin (neuromuscular junctions (NMJs), yellow), laminin (green), and DAPI (blue), and magnification of regions containing NMJs.

Scale bars in full-section and enlarged images are 50 µm and 5 µm, respectively. f Quantification of the percentage of pS6S235/236-positive fibers in
10mCON, 30mCON, and 30mRM groups. g Quantification of minimum fiber Feret for pS6S235/236-positive and pS6S235/236-negative fibers in 30-month-
old TA muscle. h Representative images of C2C12 myotubes incubated for 24 h in differentiation media (CON) or media containing 10 nM rapamycin, 20
ng ml−1 TNFα, and 100 ng ml−1 IFNγ (cytokines) or cytokines and rapamycin (cytokines + RM), and i quantification of myotube diameter. j RT-qPCR
analysis of genes associated with ER stress and muscle wasting in C2C12 myotubes after 6 h of incubation in CON, cytokines, rapamycin, or cytokines
+rapamycin. k Quantification and representative western blot image (left, upper) of ATF4 protein abundance after 6 h of incubation in differentiation
media with or without cytokines and rapamycin (RM). l Quantification of p62 protein abundance and representative western blot image (left, lower) in
differentiation media (CON) or media containing the autophagy-flux inhibitor bafilomycin (200 nM) after 4 h of incubation in media with or without
cytokines and rapamycin (24 h). Group numbers for b are n = 6 mice for TA and seven for GAS (10mCON), eight for 30mCON, and seven for 30mRM. For
c and d, n = 7 mice (10mCON), eight (30mCON), seven for TA, and eight for GAS (30RM). For f–g, n = 8. For h–i, n = 6 wells across two separate
experiments. For j, n = 6 wells. For k, n = 4 wells. For l, n = 6 (CON) and five (cytokines and cytokines+RM) wells. Data are mean ± SEM. Two-way
repeated-measure ANOVAs with Sidak post hoc tests (b–d, i), one-way ANOVAs with Fisher’s LSD (f), Tukey’s (j, k) post hoc tests, or student’s two-sided
t test (g), were used to compare between data. *, **, and *** denote a significant difference between groups of P < 0.05, P < 0.01, and P < 0.001,
respectively. Where 0.05 < P < 0.1, P values are reported.

were observed between TA and GAS in any measured proteins,                      for 5 days (Supplementary Fig. S6E). Importantly, despite
indicating that differences in mTORC1 activity cannot explain                   impairing myotube hypertrophy across the treatment period,
muscle-specific responses to rapamycin.                                          absolute myotube size was larger in cytokine- and rapamycin-
   To determine whether increased mTORC1 activity was                           treated cells than cytokine-treated control cells (Supplementary
uniform in the muscle or localized to particular substructures,                 Fig. S6B). Furthermore, 10 nM rapamycin effectively prevented
we stained TA cross sections with antibodies against pS6S235/236                the cytokine-induced activation of well-known muscle-wasting
and laminin (to outline muscle fibers), and used α-bungarotoxin                  pathways (Fig. 3j, k). Consequently, the increase in ATF4 protein
to identify postsynaptic acetylcholine receptors (AChRs) at the                 by cytokines was efficiently blocked by rapamycin (Fig. 3k).
NMJ. In previous work, we have shown that both pS6S235/236 and                  Similarly, rapamycin prevented the accumulation of the autop-
pS6S240/244 are equally sensitive to mTORC1 activation and                      hagy marker p62 (Fig. 3l). The reduction in p62 protein by
suppression19. While pS6S235/236 staining was stronger in                       rapamycin was the result of reduced p62 production and not
synaptic than extra-synaptic regions (Fig. 3e), as previously                   enhanced autophagic flux as shown using the autophagy inhibitor
reported33, muscle fibers were largely negative for pS6S235/236                  bafilomycin (Fig. 3l). These results show that mTORC1 activity
staining. However, in 30mCON mice, the number of pS6S235/236-                   increases in old, atrophic muscle fibers, and rapamycin blunts
positive muscle fibers increased four times compared to 10mCON                   cytokine-induced muscle wasting by blocking transcription of
mice (Fig. 3e, f). Rapamycin significantly reduced the number of                 several cytokine-induced stressors.
pS6S235/236-positive fibers, without eliminating strong pS6S235/236
staining at the NMJ (Fig. 3e). In 30mCON mice, the mean                         Overactive muscle mTORC1 causes sarcopenia-like NMJ
minimum fiber Feret’s diameter of pS6S235/236-positive muscle                    changes. NMJ instability is a common feature of aged muscle,
fibers was significantly smaller than that of pS6S235/236-negative                and is thought to be a strong contributor to sarcopenia37–40.
fibers (Fig. 3g), indicating atrophy in fibers with high mTORC1                   We have previously demonstrated that the sustained muscle
activity.                                                                       fiber-specific mTORC1 activity in TSCmKO mice drives pro-
   To test the idea that mTORC1 signaling in muscle fibers                       gressive muscle wasting and weakness reminiscent of
contributes to muscle wasting, we investigated the effect of                    sarcopenia11,12. More recently, we discovered that skeletal
rapamycin on cultured C2C12 myotubes under basal conditions                     muscle fibers of TSCmKO mice (for Tsc1 muscle knockout)
and in response to inflammatory cytokines. A chronic low-grade                   show a strong impairment in the denervation-induced increase
upregulation of circulating pro-inflammatory cytokines (e.g.,                    in AChR turnover, leading to rapid postsynaptic disintegra-
TNFα, IL6, and CRP) is a common feature of sarcopenia34, and                    tion33. Together with the observations that mTORC1 signaling
suppressing inflammation attenuates sarcopenia in rodents35. To                  increases     in    30mCON       muscle,    and     dampening
establish the role of rapamycin-sensitive mTORC1 signaling                      mTORC1 signaling with rapamycin ameliorates the sarcopenic
under muscle-wasting conditions, we incubated C2C12 myotubes                    features of aged mice, our previous denervation work led us to
in media containing 20 nM of tumor necrosis factor-alpha                        hypothesize that changes in mTORC1 signaling in postsynaptic
(TNFα) and 100 nM interferon-gamma (IFNγ), collectively called                  muscle fibers may also affect NMJ stability. Typical morpho-
“cytokines,” for 24 h with or without 10 nM of rapamycin. TNFα                  logical features of NMJ instability include axon thinning and
and IFNγ synergistically drive myotube wasting36. After 24 h,                   sprouting, decreased postsynaptic AChR density, and frag-
cytokine-treated myotubes were ~40% thinner than vehicle-                       mented postsynaptic structure41,42. To test this hypothesis, we
treated cells, while 10 nM of rapamycin was sufficient to protect                performed a detailed evaluation of NMJ morphology using the
the myotubes from wasting (Fig. 3h, i). Myotubes in differentia-                publicly available NMJ-morph tool43 in 10mCON, 30mCON,
tion media treated with 10 nM rapamycin were thinner than                       and 30mRM mice, as well as 9-month-old control (9mCON)
control cells (Supplementary Fig. S6B), resulting from impaired                 and 9-month-old TSCmKO (9mTSCmKO) mice with or with-
differentiation (Supplementary Fig. S6C) and myotube hyper-                     out a 4-week treatment of rapamycin (2 mg kg−1 day−1, i.p).
trophy (Supplementary Fig. S6D) between differentiation days 5                  Age- and mTORC1-induced changes were examined using
and 6. Indeed, differentiation is strongly impaired in C2C12 cells              whole-mount images of EDL NMJs stained for the presynaptic
incubated in differentiation media containing rapamycin (>1 nM)                 nerve terminal and postsynaptic AChR clusters (Fig. 4a).

NATURE COMMUNICATIONS | (2020)11:4510 | https://doi.org/10.1038/s41467-020-18140-1 | www.nature.com/naturecommunications                               7
ARTICLE NATURE COMMUNICATIONS | https://doi.org/10.1038/s41467-020-18140-1
a 10mCON 12mCON
30mCON 12mTSCmKO
30mRM 12mTSCmKO+RM
25 µm 25 μm
α-BTX Syn/NF α-BTXs / Syn/NF α-BTX YFP α-BTX / YFP
b 3.5 **
c 60 * **
d e 1.5 P=0.055 **
EDL: nerve sprouting (%)
*** **
EDL: axon diamter (μ m)
8 ** *
(normalised to control)
EDL: # AChR clusters
***
EDL: AChR density
*** ** **
2.5 ** **
40 6 1.0
1.5 4
20 0.5
** *
2
0.5
0 0 0 0.0
ON ON RM ON KO +RM ON ON RM ON KO +RM ON ON RM ON KO +RM ON ON RM ON KO +RM
mC mC 0m 9mCSCm KO mC mC 0m 9mCSCm KO mC mC 0m 9mCSCm KO mC mC 0m 9mCSCm KO
10 30 3 T m 10 30 3 T m 10 30 3 T m 10 30 3 T m
9m TSC 9m TSC 9m TSC 9m TSC
9m 9m 9m 9m
f g h i 2.0 CON j CON k Mean: CON v TSCmKO*
SD: CON v TSCmKO*
TSCmKO TSCmKO 11m-TA 11m-SOL
GAS: axon diameter (μ m)
8
GAS: # AChR clusters
TA v SOL* 150
mEPC amplitude (nA)
3 ** * * * 150
EPC amplitude (nA)
GAS: sprouting (%)
20
Quantal content
1.5
** ** 6 *
2
*** ** 100 100
1.0
10 4
1 50 50
2 0.5
0
0 0 0.0 0 0
TA SOL TA SOL CON TSCmKO CON TSCmKO
ON ON RM ON ON RM ON ON RM
mC mC 0m mC mC 0m mC mC 0m
10 30 3 10 30 3 10 30 3
l m 110 12mCON n 105
o 110
GAS: 4th CMAP (% of 1st)
11m-TA 11m-SOL 12mTSCmKO ** **
1.0
SOL: peak tetanic force
SOL: peak tetanic force
* 100
EPC amplitude (nA)
(normalised to P1)
*
(nerve/muscle, %)
(nerve/muscle, %)
100 *
0.8 * *** 95 90
80
90
0.6
85 70
0.4 80 60
CON*** 75 50
CON*
TSCmKO TSCmKO
0.0 0 0 0
2 4 6 8 10 2 4 6 8 10 3 4 7.5 10 15 m m N O M
Stimulation # Stimulation # 10 –30 CO mK +R
Stimulation freq (Hz) 28 9m TSC mKO
m
9 TS C
9m
Quantification revealed significant thinning of axons (Fig. 4b), 10mCON mice (Fig. 4a–d). Similarly, a 4-week treatment of
an increased number of sprouting axons (Fig. 4c), and higher TSCmKO mice with rapamycin normalized axon diameter and
AChR cluster numbers, a measure of postsynaptic fragmenta- sprouting, but did not affect the number of AChR clusters
tion (Fig. 4d). All these features were seen in 30mCON and (Fig. 4a–d). In line with previous reports37,44, we observed
9mTSCmKO mice. In 30mRM mice, all age-related differences lower density of postsynaptic AChRs in cross sections from
seen in 30mCON mice were ameliorated to levels similar to EDL muscles of 30mCON (trend) as well as 9mTSCmKO mice,
8 NATURE COMMUNICATIONS | (2020)11:4510 | https://doi.org/10.1038/s41467-020-18140-1 | www.nature.com/naturecommunications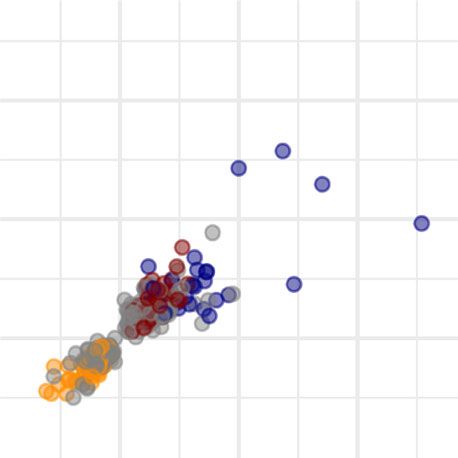
NATURE COMMUNICATIONS | https://doi.org/10.1038/s41467-020-18140-1                                                                      ARTICLE

Fig. 4 Overactive mTORC1 drives neuromuscular junction (NMJ) instability and impairs NMJ function. a Representative whole-mount images of the
pre- (neurofilament/synaptophysin or YFP) and postsynapse (acetylcholine receptors (AChRs) stained using alpha bungarotoxin) in extensor digitorum
longus (EDL) muscle for 10-month-old control (10mCON), 30-month-old (30mCON), and 30-month-old mice treated from 15 months with rapamycin
(30mRM, left) and for 9-month-old control (9mCON), TSCmKO (9mTSCmKO), and TSCmKO + 4 weeks of rapamycin-treatment (TSCmKO+RM, right)
mice. Morphological properties of whole-mount EDL NMJs, including b axon diameter, c the percentage of NMJs with sprouting axons, and d the number of
postsynaptic AChR clusters for 9mTSCmKO and sarcopenic experiments. e Acetylcholine receptor density in EDL cross sections. f–h Morphological
properties of whole-mount GAS NMJs for 10mCON, 30mCON, and 30mRM mice. In situ electrophysiological readouts of individual NMJ transmission
properties in the tibialis anterior (TA) and soleus (SOL) muscle of 11-month-old TSCmKO mice and littermate controls, including (i) miniature end- plate
current (mEPC), j end-plate current (EPC), k quantal content, and l EPC over repeated stimulations. m EMG recordings of compound muscle action
potential (CMAP) rundown over four consecutive stimulations in the GAS of 9-month-old TSCmKO mice and littermate controls at stimulation frequencies
between 3 and 15 Hz. Nerve- relative to muscle-stimulated peak tetanic force in SOL nerve-muscle preparations in (n) 10- (n = 5) and 28–30-month-old (n
= 13) wild-type mice, and (o) 9-month-old control (n = 11), TSCmKO (n = 10), and TSCmKO mice treated with rapamycin for 4 weeks (n = 5). Group
numbers for 10mCON are n = 5 (b, d), 3 (c), 6 (e), and 4 (f–h) mice. For 30mCON and 30mRM, n = 5 (b, d), 4 (c, f–h), and 7 (e) mice. For 9mCON,
9mTSCmKO, and 9mTSCmKO+RM, n = 4 (b–d) and 3 (e) mice. For 11mCON and 11mTSCmKO, n = 5 (TA: i–l) and 4 (SOL: i–l) mice. For m, n = 6
(12mCON) and 5 (12mTSCmKO) mice. For n, n = 5 (10m) and 13 (28–30 m). For o, n = 11 (9mCON), 10 (9mTSCmKO), and 5 (9mTSCmKO + RM) mice.
Data are presented as mean ± SEM. One-way ANOVA with Fisher’s LSD post hoc test (b–h, o), two-way (i–j) or two-way repeated-measure ANOVA (l, m)
with Fisher’s LSD post hoc test (m), or two-tailed independent student’s t test (n) were used to compare between data. *, **, and *** denote a significant
difference between groups of P < 0.05, P < 0.01, and P < 0.001, respectively. Where 0.05 < P < 0.1, P values are reported.

compared to adult control mice (Fig. 4e). In both cases, rapa-                  mTORC1 signaling at high age is responsible for NMJ dete-
mycin treatment restored AChR density to control levels.                        rioration and hence to the development of sarcopenia.
Interestingly, although rapamycin did not protect the mass of
GAS muscle from age-related loss, it did prevent age-related
changes in NMJ morphology (Fig. 4f–h), indicating that                          Muscle-dependent sarcopenic signaling responses to rapamy-
rapamycin-induced improvements in NMJ structure are not                         cin. Diverse, muscle-specific gene expression profiles allow mus-
responsible for the muscle-specific efficacy of the drug. To                      cles to perform a wide range of different functions with different
assess whether the structural changes at the NMJ would also                     contraction properties46. We also observed a substantial difference
affect neuromuscular transmission, we next used in situ elec-                   in the responsiveness of muscles to aging, ranging from mild
trophysiological recordings of single NMJs in fast-twitch TA                    (EDL: −10.0 ± 1.8%, TA: −11.5 ± 1.5%, and TRI: −15.1 ± 1.8%;
and slow-twitch SOL muscle of 11-month-old TSCmKO                               mean ± SEM) to severe (SOL: −22.2 ± 2.9%, QUAD: −21.4 ±
(11mTSCmKO) and control (11mCON) mice. While the                                1.7%, and GAS: −20.4 ± 1.5%). Moreover, rapamycin was differ-
magnitude of miniature end-plate currents (mEPCs, Fig. 4i),                     entially effective in preventing loss of muscle mass (Fig. 2a). In an
resulting from spontaneous acetylcholine vesicle release, and                   attempt to understand commonalities and differences between
evoked EPC (Fig. 4j) was not significantly altered, both the                     muscles in response to aging and rapamycin, we performed
magnitude and variability (SD) of quantal content (EPC/mEPC,                    mRNA-seq on four muscles (GAS, TA, TRI, and SOL) from each
Fig. 4k) were significantly increased in the TA and SOL of                       of six mice for 10mCON, 30mCON, and 30mRM groups (i.e., a
11mTSCmKO compared to 11mCON mice. Quantal content                              total of 72 muscles). In addition to their differential responses to
(i.e., the number of acetylcholine vesicles released in response                aging and rapamycin, the four muscles were chosen to encompass
to a single nerve action potential) is tightly regulated to ensure              fore- and hindlimb locations, slow and fast contraction properties,
that each nerve action potential results in a muscle action                     and anterior and posterior positioning. First, we investigated the
potential, but must be balanced with the need for repeated                      age-related gene expression changes (i.e., log2(30mCON/
stimuli and finite vesicle stores41. In line with findings in sar-                10mCON)) between the four muscles (Fig. 5a, below diagonal)
copenic muscle, transmission fatigability in response to repe-                  and observed moderate-to-strong correlations. Correlation
ated stimulations increased in 11mTSCmKO mice (Fig. 4l). A                      strength was predominately related to fiber-type properties, with
deficit in neuromuscular transmission fatigue in electromyo-                     the strongest correlations observed between fast-twitch muscles
graphic (EMG) recordings on the GAS of 12-month-old                             (e.g., GAS vs. TRI, r = 0.71). Moderate correlations were still
TSCmKO mice was also seen in compound muscle action                             observed between the slow-twitch, SOL muscle and all three fast-
potential (CMAP) measurements comparing the first to the                         twitch muscles (r = 0.46–0.53). Slopes, fitted to the direction of the
fourth stimulation, starting at a stimulation frequency of 4 Hz                 highest variance (i.e., principle component 1), showed that the TA
(Fig. 4m). Transmission fatigue can result from decreased                       had the strongest age-related gene expression response (i.e., slope
AChR density and therefore postsynaptic insensitivity. Finally,                 favors TA axis), followed by GAS, SOL, and TRI (Fig. 5a, below
as an overall readout of NMJ efficiency, we used nerve-muscle                    diagonal). In contrast to age-related gene expression changes, the
preparations of the SOL muscle to compare the tetanic force                     correlation between muscles for rapamycin-induced gene expres-
generated by triggering action potentials in the nerve versus                   sion changes (i.e., log2(30mRM/30mCON)) was unrelated to fiber
the muscle directly. In healthy, adult mice, nerve- and muscle-                 type (Fig. 5a, above diagonal). The strongest correlation for
stimulated muscle force should be the same because of the                       rapamycin was between the physically co-localized, but fiber-type-
safety factor of neuromuscular transmission45. Indeed, the ratio                distinct GAS and SOL muscle (r = 0.59), while correlations were
of force generated by nerve stimulation and by direct muscle                    the weakest between TA and both SOL (r = 0.22) and GAS (r =
stimulation was close to 1 in adult mice, while the ratio sig-                  0.31). Next, we compared age- (log2(30mCON/10mCON), x axis)
nificantly dropped in both 28–30-month-old control mice                          and rapamycin- (log2(30mRM/30mCON), y axis) related gene
(Fig. 4n) and in 9mTSCmKO mice (Fig. 4o). Four weeks                            expression changes for each muscle; negative correlations thus
of rapamycin treatment normalized the ratio in TSCmKO                           indicate the reversal of age-related changes by rapamycin (Fig. 5b).
mice (Fig. 4o). These results strongly suggest that high                        In line with the strong preservation of muscle mass at high age by

NATURE COMMUNICATIONS | (2020)11:4510 | https://doi.org/10.1038/s41467-020-18140-1 | www.nature.com/naturecommunications                               9
ARTICLE                                                                 NATURE COMMUNICATIONS | https://doi.org/10.1038/s41467-020-18140-1

        a                                                                                                      b

        c                                                                                       d

rapamycin, age-related changes in mRNA expression were                          To interrogate gene expression patterns in the different
reversed by rapamycin in the TA and TRI. Likewise, in muscles                muscles in response to aging and rapamycin, we performed
partially protected (SOL) and not protected (GAS) by rapamycin,              principal component (PC) analysis on data from all four muscles
correlations were very weakly negative (r = −0.12, s = −0.56) and            for 10mCON, 30mCON, and 30mRM mice (PC10–30–30mRM).
nonexistent (r = 0.02, s = 0.06, Fig. 5b), respectively. Hence,              PC110–30–30mRM, PC210–30–30mRM, and PC410–30–30mRM were
muscle-specific gene expression responses to rapamycin closely                associated with inherent differences between the muscles,
reflect rapamycin-induced changes in muscle mass (Fig. 2a).                   independent of age and treatment (Fig. 5c and Supplementary

10               NATURE COMMUNICATIONS | (2020)11:4510 | https://doi.org/10.1038/s41467-020-18140-1 | www.nature.com/naturecommunications
NATURE COMMUNICATIONS | https://doi.org/10.1038/s41467-020-18140-1 ARTICLE
Fig. 5 Rapamycin exerts pro- and anti-aging stimuli. a Pairwise comparisons of age- (30mCON/10mCON, under diagonal) and rapamycin-induced
(30mRM/30mCON, above diagonal) gene expression changes between tibialis anterior (TA), triceps brachii (TRI), soleus (SOL), and gastrocnemius (GAS)
muscles, and b pairwise comparisons of age- and rapamycin-induced gene expression changes within muscles with slope, intercept, and Pearson’s
correlation coefficient (r) indicated. For a and b, each graph is a 2D-density plot with the plotting area divided into small fragments; the intensity of the gray
color of each fragment represents the number of genes in that fragment. Black dashed lines correspond to directions of the highest variance (PC1) for
comparisons with the slope “s” and intercept “i”. The color of the plotting area was defined by the strength of the Pearson correlation coefficient r.
c Coordinates of principal components (PC1–5) for gene expression data collected in TA, TRI, SOL, and GAS in 10mCON, 30mCON, and 30mRM. n = 6
mice per group and muscle, except for SOL 30mCON where n = 5. Each dot corresponds to one muscle sample, from an individual animal. The numbers
associated with the PCs indicate the fraction of the variance in transcript expression in samples along the corresponding PC. d Heatmaps of the changes in
the expression of genes aligned with PCs 3 and 5, respectively. A gene was considered aligned with a PC if the absolute value of the Pearson correlation
between the expression of the gene and PC coordinates was ≥0.4, and the absolute value of the z score of the projection of the gene expression on a PC
was ≥1.96.
Fig. S7A, B, D). In contrast, PC310–30–30mRM reflected age-related and 171 decreasing), and performed hierarchical clustering of
changes common to all four muscles, which were not affected by their log-fold changes in natural aging (30mCON/10mCON),
rapamycin in the TA and TRI, but exacerbated in the GAS and rapamycin treatment (30mRM/30mCON), and premature aging
SOL (Fig. 5c, upper right). GO terms associated with (9mTSCmKO/3mTSCmKO and 9mTSCmKO/9mCON, Fig. 6e).
PC310–30–30mRM were dominated by immune responses (e.g., Of the ten clusters with distinct expression patterns, three (now
neutrophil chemotaxis) and the NMJ (e.g., synaptic transmission, referred to as clusters 1–3) showed strong, consistent natural and
cholinergic; Supplementary Fig. S7C). PC510–30–30mRM, on the premature aging-related gene expression changes and significantly
other hand, reflected an “anti-aging” effect of rapamycin, mapped to GO terms (Fig. 6f). The first and third clusters contain
consistent across all four muscles (Fig. 5c, lower right). GO genes whose expression decreased and increased, respectively,
terms associated with PC510–30–30mRM corresponded to extra- during natural and premature aging, and were reversed by pro-
cellular matrix (ECM) components, which showed a remarkable longed rapamycin treatment. This suggests that muscle mTORC1
age-related decrease (Supplementary Fig. S7E). We also visualized activity modulates gene expression changes in clusters 1 and 3.
the log-fold changes in expression of genes aligned with Consistent with our findings that rapamycin blocked cytokine-
PC310–30–30mRM and PC510–30–30mRM (Fig. 5d). This visualization induced muscle wasting in C2C12 myotubes, genes associated
reinforces the finding that age-related mRNA expression changes with cluster 3 related to immune responses (Fig. 6f). Strikingly,
are consistent between muscles, while the effect of rapamycin is genes in cluster 1 were highly enriched for structural components
muscle specific. Together, these results indicate that the of the ECM, including all three major isoforms of collagen VI
responsiveness of a muscle to rapamycin depends on the balance (Col6a1–3). Cluster 2 represents the muscle-specific “pro-aging”
between pro- and anti-sarcopenic signaling. effects of rapamycin. Expression of the corresponding genes
increased with both natural and premature aging, while rapamycin
Signature of mTORC1-driven sarcopenic signaling. Next, we exacerbated these changes in muscles where mass was weakly, or
wanted to identify which age-related changes in gene expression not at all protected by rapamycin (i.e., GAS and SOL). Genes in
could be ascribed to chronic activation of mTORC1 in muscle this cluster mapped to components of the NMJ, and were
fibers. First, we identified a muscle-aging signature by performing remarkably enriched for known markers of functional denervation
PC analysis on all four muscles from the 10mCON and 30mCON and NMJ instability47–51. Together, these data suggest that
groups (PC10–30m, Fig. 6a). PC110–30m, PC210–30m, and PC410–30m mTORC1 mediates age-related changes in ECM gene expression,
were once again associated with inherent differences between immune response signaling, and denervation pathways. That
muscles, while PC310–30m represented age-related gene expression systemic application of rapamycin exacerbates the latter pathway
changes common to all muscles (natural aging PC310–30m). in specific muscles, indicates that the response depends on mul-
Gene expression responses to rapamycin treatment in aged mice tiple inputs, some intrinsic and others extrinsic to the muscle.
could result from mTORC1 inhibition in both muscle and non-
muscle tissue. As the muscle phenotype of TSCmKO mice was mTORC1-driven sarcopenic signaling converges on the NMJ.
highly similar to that of aged mice, but increased mTORC1 As rapamycin suppressed age-related morphological alterations
activity is restricted to skeletal muscle fibers, we next conducted to the NMJ, and TSCmKO mice display sarcopenia-like changes
mRNA-seq studies in EDL muscles from 3- (weak/no phenotype) in NMJ transmission and morphology, our data pointed to the
and 9-month-old (severe phenotype) TSCmKO mice and their NMJ as a hotspot of mTORC1-driven muscle loss. Therefore, we
age-matched littermate controls. The first PC showed an aging- next investigated whether the identified mTORC1-driven gene
like pattern (premature aging PC1TSCmKO) with gene expression signatures (clusters 1–3 above) originate from cells residing at
remaining stable in WT mice, but changing in TSCmKO mice the NMJ. To do this, we identified NMJs in cross sections of TA
between 3 and 9 months (Fig. 6b, left). PC2TSCmKO represents muscle with α-bungarotoxin and isolated them by laser-capture
early alterations that subside between 3 and 9 months in microdissection. RNA-seq data from NMJ regions (NMJ) of
TSCmKO compared to control mice (Fig. 6b, right). Importantly, adult and sarcopenic muscles were then compared with the
when comparing natural aging PC310–30m and premature aging results from non-NMJ regions (xNMJ). NMJ regions were
PC1TSCmKO commonly increasing (5.3-fold, P < 0.001) and highly enriched for genes known to be specifically expressed at
decreasing (6.5-fold, P < 0.001) genes were over represented, and the NMJ52 (Fig. 7a). Using a list of markers of muscle-resident
oppositely regulated genes (0.6-fold, P < 0.05, Fig. 6c) were under cell types53, we found that glial (i.e., Schwann) cells were the
represented. Likewise, many of the top-ten enriched GO terms for only cell type consistently enriched in NMJ regions. Gene set
natural aging PC310–30m were also enriched in premature aging enrichment analysis (GSEA) demonstrated that genes associated
PC1TSCmKO (Fig. 6d). We next identified genes aligned with nat- with clusters 1–3 were significantly enriched at the NMJ in adult
ural aging PC310–30m and expressed in all data sets (217 increasing (10m NMJ/10m xNMJ, Fig. 7b) mice. In NMJ regions, cluster 1
NATURE COMMUNICATIONS | (2020)11:4510 | https://doi.org/10.1038/s41467-020-18140-1 | www.nature.com/naturecommunications 11ARTICLE NATURE COMMUNICATIONS | https://doi.org/10.1038/s41467-020-18140-1
a b
c e
d
f
genes were significantly decreased, while cluster 2 and 3 genes NMJ (Fig. 7d). On the other hand, the age-related depletion of
were significantly increased in 30m compared to 10m muscle genes associated with cluster 1 was more prominent in NMJ
(Fig. 7c). Genes from clusters 2 and 3 also had increased than non-NMJ regions, and may particularly compromise the
expression in 30m xNMJ compared to 10m xNMJ regions, stability of the NMJ and its ability to remodel following com-
suggesting that age-related gene expression changes in these mon age-related remodeling events, such as muscle fiber
clusters were muscle-wide although expression was higher at the degeneration/regeneration and motor unit loss42.
12 NATURE COMMUNICATIONS | (2020)11:4510 | https://doi.org/10.1038/s41467-020-18140-1 | www.nature.com/naturecommunicationsNATURE COMMUNICATIONS | https://doi.org/10.1038/s41467-020-18140-1 ARTICLE
Fig. 6 mTORC1 suppresses extracellular matrix (ECM) remodeling, promotes inflammation, and is involved in muscle responses to functional
denervation. a Coordinates of principal components (PC2–4) for gene expression data (TPM) collected in tibialis anterior (TA), triceps brachii (TRI), soleus
(SOL), and gastrocnemius (GAS) from 10mCON and 30mCON mice. b Coordinates of PC1 and PC2 for gene expression data (TPM) generated from extensor
digitorum longus (EDL) muscle of 3- and 9-month-old TSCmKO and littermate control mice. The numbers associated with the PCs indicate the fraction of the
variance in gene expression in samples along the corresponding PC. Each dot corresponds to one muscle sample, from an individual animal. Linear regression
analysis was used to compare slopes and intercepts. c Overlap of genes aligned with PC3 from a (natural aging) and PC1 from b (premature aging). A gene was
considered aligned with a PC if the absolute value of the Pearson correlation coefficient between the expression of the gene and PC coordinates was ≥0.4, and
the absolute value of the z score of the projection of the gene expression on a PC was ≥1.96. Red and blue numbers represent increasing and decreasing genes,
respectively, while black numbers represent genes oppositely regulated between TSCmKO and sarcopenia data sets. d Top-ten DAVID gene ontology terms
enriched (P < 0.01) for genes aligned to natural aging PC3 and the enrichment of these terms for genes aligned with premature aging PC1. e Heatmap of
changes occurring during aging in the expression of genes aligned with natural aging PC3, i.e., common age-related gene-expression changes (30mCON/
10mCON) in all four muscles, along with fold changes in these genes for 30mRM/30mCON, 9mTSCmKO/3mTSCmKO, and 9mTSCmKO/9mCON.
Hierarchical clustering based on the Euclidean distance of these changes rendered 10 gene clusters, including three prominent clusters, now referred to as
clusters 1, 2, and 3. Genes associated with clusters 1, 2, and 3 are listed. f Top-eight DAVID gene ontology terms enriched (P < 0.01) for gene clusters 1, 2, and 3,
respectively. Enrichment significance threshold was set at P < 0.01 (gray and red dashed lines). Genes from clusters 1 to 3 contributing to the top enriched terms
are colored. For TSCmKO data set n = 5 mice per group. For the sarcopenia data set, n = 6 mice per muscle per group, except for SOL 30mCON where one
data point was removed due to a technical error. A modified Fisher’s exact test was used to determine significance.
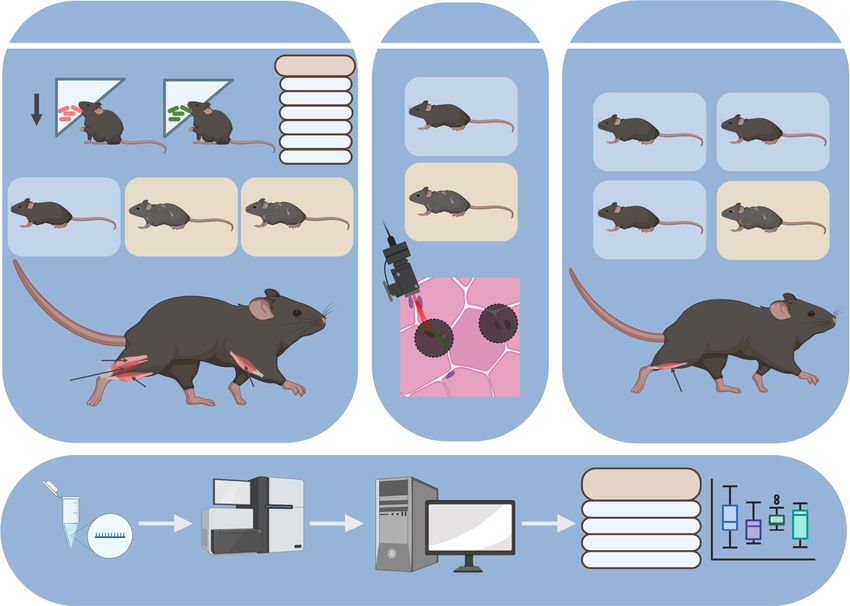
Intermuscle differences in neural stability39 and compensatory multi-compartment, mTORC1-focused gene expression atlas
reinnervation responses38–40 are thought to play a major role in based firmly on robust phenotypical characterization (Fig. 8).
determining the extent of muscle loss following age-related While traditional wisdom stemming from short-term models
perturbations. We wondered whether the magnitude of age- of muscle hypertrophy and atrophy dictates that anti-sarcopenic
related signaling (i.e., genes contributing to PC310–30m) could interventions should focus on boosting mTORC1 activity5,6,
explain between-muscle differences in the extent of age-related evidence is mounting that efforts should rather focus on
muscle loss (Supplementary Fig. S9A–L). While the extent of mTORC1 suppression. Here, we conclusively demonstrate that
sarcopenia was lower in TA muscle than GAS or SOL (Fig. 2a), overactive skeletal muscle mTORC1 fulfils all criteria necessary to
the expression of many genes involved in the muscle response to be considered a hallmark of sarcopenia2. First, mTORC1 activity
denervation (Chrng, Myog, Runx1, Chrna1, and Scn5a) was is higher in atrophic myofibers of sarcopenic mice (Fig. 3). Sec-
accentuated (>log2(1.5), Fig. 7e and Supplementary Fig. S9A–C). ond, sustained activation of mTORC1 in skeletal muscle fibers
The marked upregulation of denervation-induced genes was the recapitulates age-related changes in NMJ stability (Fig. 4) and
only signature differentiating the aging response in TA muscle gene expression (Fig. 6). Third, long-term mTORC1 suppression
from the other three muscles. Notably, all genes in this signature by rapamycin significantly attenuates the age-related loss of
belonged to cluster 2, representing muscle-specific responses to skeletal muscle size and function (Figs. 1 and 2). Together, these
rapamycin. Muscle-specific differences in gene expression and data establish mTORC1 hyperactivity as a bona fide hallmark of
muscle phenotypes indicate that the enhanced age-related sarcopenia and the TSCmKO mouse as a model of skeletal muscle
denervation response in TA is compensatory, while the enhanced fiber mTORC1-driven early sarcopenia.
rapamycin-related denervation response in GAS results from a Our data point to age-related NMJ instability as a focal point of
more pronounced denervation stimulus. In line with this mTORC1-driven sarcopenia. Maintenance of NMJ structure and
hypothesis, the TA lost significantly less muscle mass than the transmission efficiency is crucial for preserving muscle function
GAS 7 and 14 days after sciatic nerve resection, suggesting that it at high age41. Long-term rapamycin treatment preserved mor-
is better able to cope with denervation than GAS (Fig. 7f). phological indicators of NMJ stability (Fig. 4), while TSCmKO
Finally, to determine whether gene expression changes in the mice displayed NMJ instability and NMJ transmission changes
mTORC1-driven muscle-aging clusters were a direct result of comparable to old muscle, such as increased quantal content and
chronic skeletal muscle mTORC1 activity, and readily reversible, transmission fatigue55,56. Age-related increases in quantal content
we treated 3- and 9-month-old TSCmKO mice and controls with are thought to compensate for postsynaptic insensitivity to pre-
rapamycin for 3 days, and performed mRNA sequencing on EDL serve transmission efficiency57. However, increasing the number
muscles. GSEA showed a significant decrease in gene expression of ACh vesicles released in response to a single nerve action
for half and two-thirds of clusters 2 and 3, respectively, but short- potential (i.e., the quantal content) can drive greater transmission
term rapamycin treatment could not restore the expression of depression during repeated stimulations58. Indeed, we observed
genes in cluster 1 (Fig. 7g). Likewise, differential expression increased EPC rundown (Fig. 4l, m) of individual NMJs from TA
analysis showed that short-term rapamycin treatment reversed muscle, and increased CMAP depression in GAS muscle (Fig. 4n)
half of all genes in clusters 2 and 3, but only a quarter of genes in from TSCmKO mice. Together with the observation that 4 weeks
cluster 1 (Fig. 7h). This suggests that genes in clusters 2 and 3 are of rapamycin treatment restores NMJ stability in TSCmKO mice,
directly regulated by mTORC1, while genes in cluster 1 are not. these results strongly implicate sustained muscle fiber mTORC1
activity in age-related NMJ destabilization.
While the net effect of long-term rapamycin treatment on
Discussion aging skeletal muscle was overwhelmingly positive, significant
Gene expression atlases (e.g., HAGR54) have greatly expanded our muscle-specific exacerbation of pro-aging signaling tempered its
understanding of the regulatory mechanisms controlling orga- anti-aging effects. In line with our findings, 6 weeks of low-dose
nismal and tissue aging. However, muscle is chronically under- treatment with the rapalog RAD001 improved TA, but not GAS
represented in such atlases, and despite considerable between- mass in old Sprague Dawley rats15. Tissue-specific effects of
muscle gene expression heterogeneity, generally restricted to a mTOR suppression on aging have also been noted in hypo-
single muscle46. Here, we address this deficiency by establishing morphic mTOR (mTORΔ/Δ) mice, which expresses ~25% of wild-
SarcoAtlas (https://sarcoatlas.scicore.unibas.ch/), a multi-muscle, type mTOR protein59. Despite an overall positive phenotype,
NATURE COMMUNICATIONS | (2020)11:4510 | https://doi.org/10.1038/s41467-020-18140-1 | www.nature.com/naturecommunications 13You can also read