The potential for bottled biogas for clean cooking in Africa
←
→
Page content transcription
If your browser does not render page correctly, please read the page content below
The potential for bottled biogas
 for clean cooking in Africa

The potential for bottled biogas for clean cooking
in Africa
Working Paper 11/Feb/2020

Authors: Edson Twinomunuji, Francis Kemausuor, Mairi Black, Amitava Roy, Matthew
 Leach, Richard Oduro Jhuma Sadhukhan, Richard Murphy
Contact: Professor Matthew Leach, m.leach@surrey.ac.uk

 This material has been funded by a QR GCRF grant from Research England to the University of Surrey; the
 Modern Energy Cooking Services (MECS) programme; and Engas UK ltd. This includes funding by UK Aid from
 the UK government; however the views expressed do not necessarily reflect the UK government’s official
 policies.
The potential for bottled biogas for clean cooking in Africa
Authors: Edson Twinomunuji, Francis Kemausuor, Mairi Black, Amitava Roy, Matthew Leach, Richard Oduro
 Jhuma Sadhukhan, Richard Murphy

Abstract
This paper is the outcome of an initial scoping study on the potential for bottled biogas as a clean cooking option
for Ghana and Uganda. The study seeks to understand the opportunities for bottled biogas for cooking in Africa,
and asks why it has not already taken off, and the key issues to be addressed to enable this.

The paper starts by outlining the nature of the multiple challenges being addressed in the pursuit of clean and
modern solutions for cooking, including the health impacts from combustion of solid biomass fuels but also the
emissions of GreenHouse Gases. In parallel, developing regions face issues in managing residues and wastes
from agro-industry and small-scale farming. Using residues to produce biogas for cooking has a long history in
Asia, including at micro scales, typically in household-scale bio-digestors. Biogas is also seen as a bioenergy
opportunity for Africa, but many millions of families live in peri-urban areas or for other reasons have insufficient
bio-resources to fuel their own digestor.

Bottling of biogas has been suggested as on option for providing accessible, renewable, clean energy to
individual households. Research and some pre-commercial trials have taken place in India and parts of Africa,
but there is limited evidence in the public domain, and it is evident that bottling has not yet taken off at scale.
This study sought to understand the opportunities and the barriers to implementation of bottled biogas for
cooking in Africa, with a focus on Ghana and Uganda.

Section 2 of the report reviews anaerobic digestion and biogas production and highlights the technical issues
which must be overcome to achieve a bottled biogas product. The current status and potential opportunities for
biogas production are reviewed for Ghana (Section 3) and Uganda (Section 4) along with country specific policy
support mechanisms. Section 5 reports on field visits to biogas producing sites in Ghana and Uganda in August
2019. Section 6 gives an outline of a workshop and conference organised under this study in October 2019.
Section 7 provides overall conclusions of this scoping study and suggests next steps

Acknowledgements: This study would not have been possible without the engagement of numerous
individuals and institutions in Uganda and Ghana who supported the field visits, and some of whom travelled
to the project workshop in the UK. We also thank the wider group of participants in the UK conference, who
shared their expertise and views with enthusiasm. Finally, we thank the donors, Research England and the
University of Surrey for the main QR GCRF grant, Engas UK for match funding their specialist input and the
Modern Energy Cooking Services (MECS) programme, funded by UK Aid, for match funding the workshop and
conference.

Attribution: Please cite this work as “Twinomunuji E, Kemausuor F, Black M, Roy A, Leach M, Oduro R
Sadhukhan J and Murphy R (2020). The potential for bottled biogas for clean cooking in Africa - February 2020
Working Paper. University of Surrey, KNUST, UCPC, Engas UK and MECS. Available at
https://www.mecs.org.uk/working-papers/.

 2
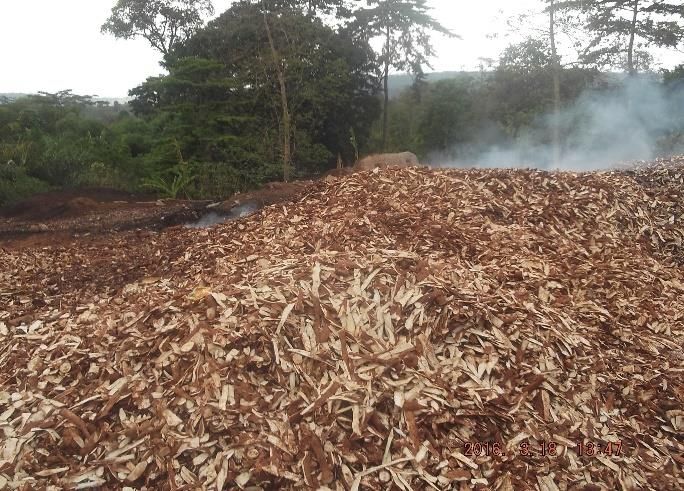
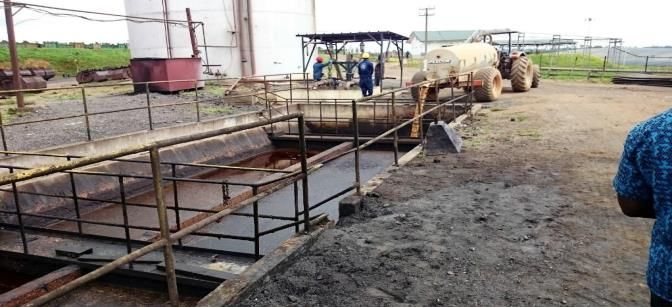
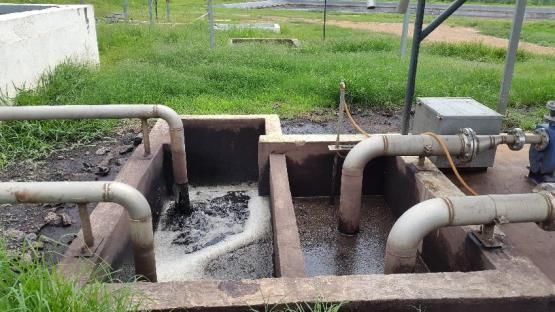
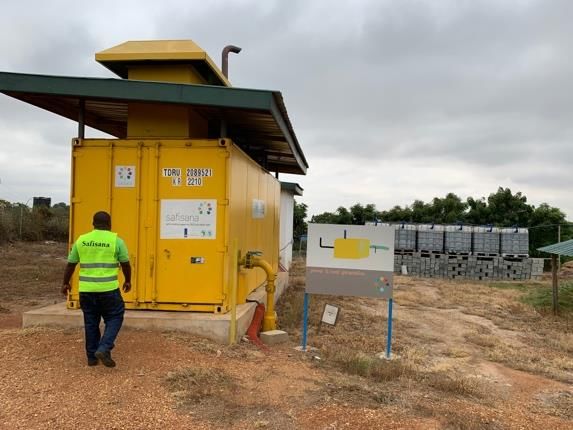
Contents
Abstract ...................................................................................................................................................... 2
Abbreviations ............................................................................................................................................. 6
1. Introduction ............................................................................................................................................ 7
2. Summary of biogas production .............................................................................................................. 10
 2.1 Anaerobic Digestion – feedstock and biogas outcomes ..................................................................... 10
 2.2 Anaerobic Digestion process ............................................................................................................ 11
 2.3 Anaerobic Digestion facilities ........................................................................................................... 13
 2.4 Biogas Upgrading and Bottling Technology ....................................................................................... 14
 2.4.1 Biogas Purification and Upgrading Technologies ................................................................................ 15
 2.4.2 Compression and Bottling Techniques ................................................................................................ 17
 2.4.3 Biogas Upgrade, Compression and Bottling Case Studies ................................................................... 17
 2.4.4 Engas UK biogas purification technology – an opportunity for Ghana and Uganda........................... 19
3. Biogas Technology Mapping in Ghana .................................................................................................... 24
 3.1 Feedstock Resources ....................................................................................................................... 24
 3.1.1 Residue from crop production ............................................................................................................ 24
 3.1.2 Residues from food processing industries in Ghana ........................................................................... 25
 3.2 Business Opportunities in the Ghana Biogas Sector .......................................................................... 28
 3.3 Stakeholders in the Ghana Biogas Industry ....................................................................................... 29
 3.4 Policy and Other Support of the Biogas Sector In Ghana ................................................................... 30
 3.4.1 Biogas Management, Policies and Regulations ................................................................................... 30
 3.4.2 Institutional Framework ...................................................................................................................... 30
 3.4.3 License Procedure under the Energy Commission .............................................................................. 31
 3.5 Case Study ...................................................................................................................................... 31
 3.5.1 Ghana Oil Palm Development Company (GOPDC) biogas plant ......................................................... 31
4. Biogas Technology Mapping in Uganda .................................................................................................. 32
 4.1 General Overview of Feedstock Potential for Biogas Production in Uganda ....................................... 32
 4.1.1 Biogas feedstock potential from agricultural crop residues ............................................................... 32
 4.1.2 Livestock production ........................................................................................................................... 32
 4.1.3 Biogas feedstock potential from agro-processing industries in Uganda ............................................ 34
 4.1.4 Biogas feedstock potential from municipal solid waste ..................................................................... 35
 4.2 Overview of Current Biogas Applications in Uganda ......................................................................... 36
 4.3 Business Opportunities in the Ugandan Biogas Sector ...................................................................... 37
 4.4 Stakeholders in the Ugandan Biogas Industry ................................................................................... 37
 4.5 Biogas Technology Policy and Regulation in Uganda ......................................................................... 38
 4.6 Case Studies .................................................................................................................................... 39
5. Field Visits – 19th-30th August 2019 ...................................................................................................... 40
 5.1 Ghana ............................................................................................................................................. 40
 5.1.1 Guinness Brewery, Kumasi (20th August 2019) .................................................................................. 40
 5.1.2 HPW Fresh and Dry (21st August 2019) .............................................................................................. 41
 5.1.3 Aglow Poultry processing facility (22nd August 2019) ........................................................................ 42
 5.1.4 Safisana AD facility (23rd August 2019) .............................................................................................. 43

 3
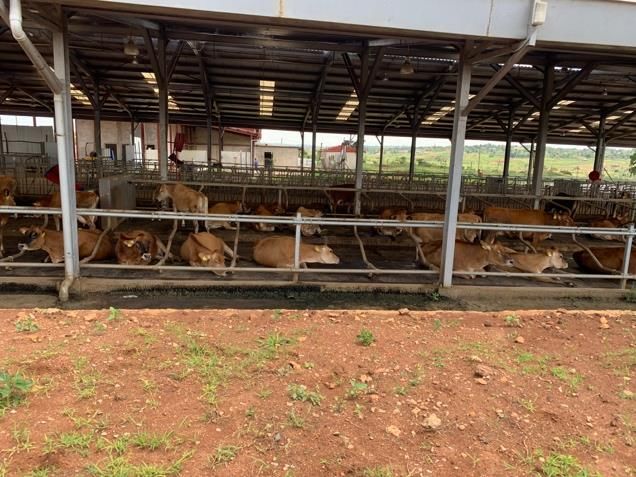
5.2 Uganda ........................................................................................................................................... 45
 5.2.1 Centre for Research in Energy & Energy Conservation (CREEC), U. of Makere .................................. 45
 5.2.2 Visit to Uganda National Livestock Resource Research Institute (28th August 2019)........................ 45
 5.2.3 Visit to Bwendero Dairy Farm Ltd (BDF), Hoima (29th August 2019) ................................................. 47
6. Initial techno-economic modelling ......................................................................................................... 48
 6.1 Basis of the analysis......................................................................................................................... 48
 6.2 Analysis results for Ghana and Uganda ............................................................................................ 50
 6.3 Discussion of results ........................................................................................................................ 52
7. Workshop and Conference .................................................................................................................... 53
 7.1 Outcomes of the Workshop of project partners ................................................................................ 53
 7.2 Outcomes of the Conference ........................................................................................................... 56
8. CONCLUSIONS ....................................................................................................................................... 59
 8.1 Context and study aims ................................................................................................................... 59
 8.2 Summary of study findings .............................................................................................................. 59
REFERENCES ............................................................................................................................................. 63
Appendix 1. Improved and Clean Cooking Stoves – design and classifications ............................................. 68
Appendix 2. AD designs for small-scale applications ................................................................................... 69
Appendix 3. Energy and Financial costs comparisons for biogas upgrading technologies ............................. 71
Appendix 4. Biogas upgrading technologies – process diagram examples ................................................... 73
Appendix 5. Workshop exploring the potential for bottled bio-gas for clean cooking in Africa..................... 76
Appendix 6. Conference exploring portable bio-derived gas for clean cooking in Africa ............................... 79

TABLES
Table 2.1 Typical properties and composition of biogas ...................................................................................... 10
Table 2.2 Biogas yield and electricity produced from different potential substrates .......................................... 11
Table 2.3 Biochemical processes of anaerobic digestion ..................................................................................... 12
Table 2.4 The 4 process steps of anaerobic digestion and associated bacteria ................................................... 13
Table 2.5 Commercial biogas technologies........................................................................................................... 14
Table 2.6 Comparison of biogas upgrading technologies ..................................................................................... 16
Table 2.7 Biogas storage options .......................................................................................................................... 17
Table 2.8 Specification of Engas UK’s 25 Nm3/h bio-CNG upgrader ..................................................................... 23
Table 3.1: Theoretical biogas potential from various organic waste sources in Ghana ....................................... 24
Table 3.2: Energy potential from biogas of Oil Palm Processors .......................................................................... 25
Table 3.3: Energy potential from biogas of selected fruit processing companies ................................................ 26
Table 3.4: Energy potential from biogas of cocoa processing companies ............................................................ 27
Table 3.5: Energy potential from biogas of manure produced by livestock in Ghana.......................................... 28
Table 3.6: Energy potential from biogas at abattoirs in Kumasi and Accra .......................................................... 28
Table 4.1: Agricultural residues available ............................................................................................................. 32
Table 4.2 Populations of Livestock (1000’), 2013 – 2017 ..................................................................................... 33
Table 4.3 Estimated livestock manure production and estimated biogas potential ............................................ 33
Table 4.4 Biogas feedstock potential from abattoirs in Kampala ......................................................................... 33
 4
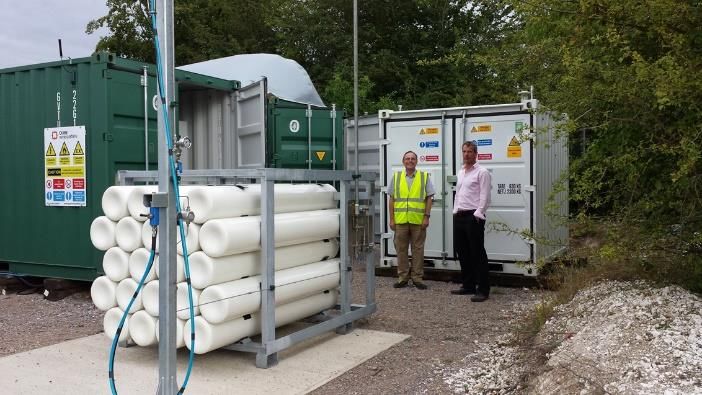
Table 4.5 Molasses generated in sugar industries in Uganda............................................................................... 34
Table 4.6 Quantities of wastewater from fish factories in Uganda ...................................................................... 35
Table 4.7: Some agro-processing enterprises with medium scale biogas plants ................................................. 36
Table 4.8: List of organization involved in improving bioenergy technology in Uganda ...................................... 38
Table 7.1. Priorities for developing bottled biogas ............................................................................................... 57
Table A2.1 Factor comparisons for small-scale AD designs .................................................................................. 70
Table A3.1 Energy Consumption of biogas upgrading technologies .................................................................... 71
Table A3.2 Capital & operating and maintenance costs of upgrading technologies ............................................ 72

FIGURES
Figure 2.1 The Anaerobic Digestion Process ......................................................................................................... 11
Figure 2.2 Biogas Plant System ............................................................................................................................. 18
Figure 2.3 Removal of CO2 from biogas ................................................................................................................ 18
Figure 2.4 CNG compressing facility ..................................................................................................................... 18
Figure 2.5 Biogas bottling by Singlar Bio-Energy .................................................................................................. 19
Figure 2.6 Engas UK’s bio-CNG plant .................................................................................................................... 21
Figure 2.7 Waste to energy system with integrated Engas UK technology .......................................................... 22
Figure 2.8 Cylinder bank for 500 kg biomethane .................................................................................................. 22
Figure 3.1: Palm Oil Mill Effluent (POME) ............................................................................................................. 25
Figure 3.2: Empty fruit bunches (EFB)................................................................................................................... 25
Figure 3.3: Palm Kernel Shells (PKS)...................................................................................................................... 25
Figure 3.4: Burning of cassava peels at cassava processing site in Brong-Ahafo region ...................................... 27
Figure 3.5 Effluent from the mill being disposed and channelled into the biogas reactor .................................. 31
Figure 5.1 AD system at Guinness Brewery, Kumasi, including gas flaring system .............................................. 40
Figure 5.2 AD and renewable energy at HPW Fresh and Dry ............................................................................... 41
Figure 5.3 Aglow poultry processing AD facility ................................................................................................... 42
Figure 5.4 Safisana AD facility ............................................................................................................................... 44
Figure 5.5 CREEC visit and tour of facilities........................................................................................................... 45
Figure 5.6 Uganda Biogas Alliance Pilot facility .................................................................................................... 46
Figure 5.7 Bwendero Dairy Farm (and distillery) .................................................................................................. 47
Figure 6.1 Business Model for Bio-CNG to replace LPG cylinders in Ghana ......................................................... 50
Figure 6.2 Business Model for Bio-CNG to replace LPG cylinders in Uganda ....................................................... 51
Figure 8.1 AD systems and the proposed opportunity for compressed and bottled biogas ................................ 61
Figure A1.1 Classification of stove types............................................................................................................... 68
Figure A2.1 Fixed dome (Chinese type) digestor .................................................................................................. 69
Figure A2.2 Floating cover (Indian type) digestor ................................................................................................. 70
Figure A2.3 Polyethylene tubular digestor ........................................................................................................... 70
Figure A4.1 Simplified process diagram of a recirculating water scrubber .......................................................... 73
Figure A4.2 Simplified process flow diagram of an organic solvent scrubber ...................................................... 73
Figure A4.3 Simplified process flow diagram of an amine scrubber .................................................................... 74
Figure A4.4 Simplified process flow diagram of a pressure swing adsorption unit .............................................. 74
Figure A4.5 Simplified process design for membrane upgrading process............................................................ 75

 5
Abbreviations
ABPP Africa Biogas Partnership Programme
AD Anaerobic Digestion
BOD Biochemical Oxygen Demand
BSU Biogas Solutions Uganda Ltd
C/N Carbon to Nitrogen ratio
CH4 Methane
CHP Combined Heat and Power
CNG Compressed Natural Gas
CO2 Carbon dioxide
COD Chemical Oxygen Demand
DM Dry matter
EFB Empty Fruit Bunches (palm)
EPA Environment Protection Agency
ERA Electricity Regulation Authority Uganda
FFB Fresh Fruit Bunch (palm)
GHG Greenhouse Gas
GNCPC Ghana National Cleaner Production Centre
H2S Hydrogen sulphide
ha Hectare
HAP Household Air Pollution
HRT Hydraulic Retention Time
LPG Liquefied Petroleum Gas
MSW Municipal Solid Waste
N2 Nitrogen
NARO National Agricultural Research Organisation Uganda
NWSC Uganda’s National Water and Sewerage Corporation
OFMSW Organic Fraction Municipal Solid Waste
O&M Operation and Maintenance
PKS Palm Kernel Shells
PMA Plan for the Modernisation of Agriculture Uganda
POME Palm Oil Mill Effluent
PSA Pressurised Swing Absorption
PVC Polyvinyl chloride
REA Rural Electrification Agency Uganda
REB Rural Electrification Board Uganda
RED European Union Renewable Energy Directive
RETs Renewable Energy Technologies
RNG Renewable Natural Gas
SNG Sustainable Natural Gas
SSA Sub-Saharan Africa
TCD Tonnes of Cane per Day
TS Total Solids
UCPC Uganda Cleaner Production Centre
VOC Volatile Organic Compounds

 6
1. Introduction
Global energy consumption has approximately doubled since the 1970s, with an estimated 70% being met by
fossil fuels in 2016 (www.iea.org/statistics/). Based on current and planned policy scenarios for energy
development, global energy demand is set to grow by 25% by 2040 (www.iea.org/weo2018/). At the same time,
concentrations of greenhouse gases (GHGs) in the atmosphere are rising rapidly, with fossil fuel-derived carbon
dioxide (CO2) emissions being the most important contributor and having caused an estimated 1.0oC of global
warming above pre-industrial levels (IPCC, 2018). Scenarios for keeping global warming below 1.5oC require a
45% decline in anthropogenic CO2 emissions from 2010 levels by 2030, reaching net zero by 2050. Limiting global
warming to below 2oC requires a 25% decline in CO2 emissions by 2030, reaching net zero by 2070 (IPCC, 2018).
In this context, many developed countries are looking at policies to achieve net zero emissions, and transitioning
to renewable energies is a key element in proposals to meet this target. We are also living in societies where the
impact our waste streams are having on the environment are of increasing concern, and more efficient use of
resources, management of waste and circular economy thinking are among the targets and challenges being
considered to reduce the impact we are having on the planet.
The contrast in energy availability, accessibility and energy use is marked between developed and developing
countries, with rural communities in many countries still being reliant on traditional fuels (wood and charcoal)
for household needs. Whilst the use of traditional fuels may be seen as a contributing factor to global warming,
resulting from combustion emissions1, black carbon emissions2 and fuel sourcing contributing to deforestation3,
traditional fuel use is also having a significant impact on the health and well-being of those communities which
rely on their use. A report by The World Bank (2014) states that ~900 million households in Sub-Saharan Africa
(SSA) will still rely on traditional cook stoves in 2020 and that 600 000 deaths per year can be attributed directly
to the smoke generated by traditional cook stoves and the fuels used. Further health issues associated with
household air pollution (HAP) are also highlighted, and it is reported that globally, HAP-related deaths account
for more deaths than HIV/AIDs and malaria combined. The promotion of cleaner, more efficient cooking options
for developing countries has for many years focused on improved design of cook stoves still using the traditional
fuels. However, alternative energy options including electricity, ethanol, liquified petroleum gas (LPG) and biogas
are increasingly being promoted as affordable, clean energy alternatives for cooking in the home. (Appendix 1
and https://www.cleancookingalliance.org/technology-and-fuels/stoves/ for overviews of improved and
clean cooking stoves and fuels). The focus of this study is on biogas.
Biogas4 produced from organic wastes, residues and energy crops has been playing an increasingly important
role globally in providing renewable, clean energy. The scale of production of biogas can be entirely flexibly,
depending on levels of feedstock and investment available. Raw biogas can be used directly for heating, cooking
and lighting at the small scale, or it can be upgraded to biomethane5, which can be used to replace natural gas

1 Combustion emissions from traditional cooking fuels in SSA are reported to contribute 0.4-1.2% of global CO2(eq)
emissions (The World Bank, 2014)
2 Black carbon emissions from traditional cooking fuels in SSA are reported to contribute 6% of global black carbon

emissions (The World Bank, 2014)
3 The use of traditional cooking fuels in SSA accounts for the consumption of > 300 million tons of wood (including wood

harvested for charcoal production) (The World Bank, 2014).
4
 The term biogas is used generically here to refer to the gas derived from biological sources as the result of anaerobic
digestion, as opposed to natural gas.
5 Biomethane is the term used to define methane produced from biological sources, rather than natural gas, and is derived

from biogas after scrubbing/purification of the gases obtained from anaerobic digestion.
 7
in gas grid systems, in the generation of power and heat when coupled with an appropriate conversion
technologies (e.g. Combined Heat and Power (CHP)), and as a gaseous vehicle fuel (Miltner et al., 2017).
Biomethane can also be used as feedstock to produce chemicals and materials, replacing methane derived from
natural gas (Weiland, 2010).
The potential for biogas production and use at various scales, using various levels of technology, make it an
attractive bioenergy option. Due to its versatility, and its ability to address a variety of issues including waste
management, renewable energies and climate change, biogas has been promoted in several countries for
different reasons (Vasco-Correa et al., 2018). The European Union has included biogas as part of its Renewable
Energy Directive (COM(2016) 767final/2), the Directive on Alternative Fuels Infrastructure (Directive
2014/94/EU), and as part of it’s climate change commitment6 and it is estimated that biogas will contribute 25%
to the 2020 EU-28 renewable energy targets (Miltner et al., 2017). However, the uptake and implementation of
anaerobic digestion (AD) technologies for biogas production, and biogas use itself, can be challenging, as they
are influenced by policy support, socio-economic conditions, technology availability and support, as well as
existing infrastructure, location of production and intended use (Vasco-Carrea et al., 2018).
China has had a long history of biogas utilisation which, since 2003, has been heavily sponsored through policies
and incentives, resulting in considerable uptake of biogas technologies at small and large scale (in 2013 there
were 43 million family users of biogas and 10,000 large-scale biogas project) (Gu et al., 2016). India has also
promoted the use of biogas since the early 1970’s in rural areas, through policies promoting off-grid energy and
the National Biogas and Manure Management Programme and also implemented a national programme for
energy recovery from municipal solid, industrial and agricultural waste in 1995. Mittal et al. (2018) have reported
that total biogas production in India is 2.07 billion m3/year, from an estimated potential of 29-48 billion m3/year.
Biogas is also seen as a bioenergy opportunity for Africa, particularly for rural communities where reliance on
traditional fuels is prevalent. Roopnarian and Adleke (2018) have reviewed initiatives in several African countries
but also highlight barriers to implementation, such as investment costs for digestor systems, understanding of
feedstock availability and lack of promotion of the technology.
The existing applications of biogas divide broadly into three categories:
 1. Large scale production and upgrading of the biogas to methane, for grid injection or compression and
 storage and use for natural-gas fuelled vehicles
 2. Medium to large scale production, often linked to onsite power generation or combined heat and power
 (eg at agri-business sites to manage residues and for self-generation, or AD at local authority waste
 management sites with sale of power)
 3. Very small-scale production in household bio-digestors, for providing household cooking fuel, light and
 heat
The EU’s interest is primarily in (1) and (2), as substitute for fossil-based energy. China’s and India’s experience
has been in all three categories, but with a strong focus on the third category, which bring access to energy,
including for cooking, to off-grid households. A limiting condition on implementation of such a system is that a
household must have sufficient resource for digesting, often a mix of human and animal wastes, food wastes
and crop residues. African households with subsistence agriculture, including some livestock, may well meet this

6
 https://ec.europa.eu/clima/policies/strategies_en
 8
resource requirement, and bio-digestors are being actively promoted in some countries. However, many millions
of families live in peri-urban areas or for other reasons have insufficient bio-resources to fuel their own digestor.
Bottling of biogas has been suggested as on option for providing accessible, renewable, clean energy to
individual households, from biogas production facilities at a larger scale; cylinders or other stores of biogas could
be delivered to the home in the same manner as LPG, or Compressed Natural Gas (CNG) (Kapdi et al., 2005)).
Various researchers in India have explored the potential of adopting bottling techniques for biogas, and implied
that there are commercial applications underway (Kapdi et al., 2005; Harsha et al., 2015; Salave and Desai.,
2017). There is limited evidence in the public domain, and the focus of bottling appears to be mainly on fuelling
vehicles, with some limited trials for cooking. It is evident that bottling has not yet taken off at scale. There are
also clear technical issues which must be overcome to make this a practical solution, most of which will add to
the cost of production of the fuel and the affordability to households.

 This report is the outcome of an initial scoping study on the potential for bottled biogas as a clean cooking
 option for Ghana and Uganda.
 The study seeks to understand the opportunities for bottled biogas for cooking in Africa, and asks why it has
 not already taken off, and the key issues to be addressed to enable this.

Section 2 of the report reviews anaerobic digestion and biogas production and highlights the technical issues
which must be overcome to achieve a bottled biogas product. The current status and potential opportunities for
biogas production are reviewed for Ghana (Section 3) and Uganda (Section 4) along with country specific policy
support mechanisms. Section 5 reports on field visits to biogas producing sites in Ghana and Uganda in August
2019. Section 6 gives an outline of a workshop and conference organised under this study in October 2019.
Section 7 provides overall conclusions of this scoping study and suggests next steps.

 9

2. Summary of biogas production
2.1 Anaerobic Digestion – feedstock and biogas outcomes
Anaerobic Digestion (AD) is a naturally occurring process in the recycling of organic matter in the environment.
In the absence of oxygen, specific categories of anaerobic (putrefactive) bacteria digest organic matter,
producing biogas as a by-product of their metabolism. AD may occur in any oxygen depleted environment e.g.
water-logged soils (including e.g. paddy fields), water bodies, the digestive systems of other living organisms
(Felton et al., 2014), as well as in land-fill and other waste storage systems (e.g. farmyard manure storage, palm
oil mill effluent ponds). Managing AD systems can result in energy provision from the methane-rich biogas; a
reduction in the volume, mass and toxicity of wastes (as the input substrate); and a beneficial slurry which can
be used as a biofertilizer and soil conditioner, to improve crop yields.
The composition of biogas is highly dependent on the organic substrate and the conditions under which the
process takes place. The general properties and composition of biogas are reported in Table 2.1 (Raja and Wazir,
2017).
Table 2.1 Typical properties and composition of biogas
Source: Raja and Wazir (2017)

 Biogas: odourless and colourless, burns with a blue flame; calorific value of 1 m3 is ~ 22 MJ
 (burning at 60% efficiency)
 Material Composition Percentage
 methane (CH4) 50-70
 carbon dioxide (CO2) 25-50
 nitrogen (N2) 0-10
 hydrogen (H2) 0-1
 hydrogen sulphide (H2S) traces
 water vapour traces
 oxygen (O2) 0-2

The chemical composition of the organic substrate is an influencing factor on the composition of biogas, as well
as being an influencing factor on AD conversion rates and yields, and the final composition of the slurry effluent
(Achinas et al., 2017). The biogas yield of some typical AD substrates used in commercial scale plants in Germany
have been reported (Achinas et al., 2017) and are illustrated in Table 2.2.
Further substrate specific yields and biogas compositions for individual AD feedstocks are the subject of
individual academic studies (e.g. Herout et al., 2011) and on-line tools are available which will allow individual
feedstock process parameters and yields to be calculated7.

7
 https://www.nnfcc.co.uk/publications/tool-ad-cost-calculator
 10
Table 2.2 Biogas yield and electricity produced from different potential substrates
Source: Achinas et al. (2017)

 Biomass type Biogas yield per ton of fresh matter Electricity produced per ton fresh
 (m3) matter* (KWh)
 cattle dung 55-68 122.5
 chicken litter 126 257.3
 fat 826-1200 1687.4
 food waste (disinfected) 110 224.6
 fruit wastes 74 151.6
 horse manure 56 114.3
 maize silage 200/220 409.6
 municipal solid waste 101.5 207.2
 pig slurry 11-25 23.5
 sewage sludge 47 96.0
*35% electrical efficiency combined heat and power, heating value 21 MJ/m3, 55% methane content, 3.6 MJ/kWh.

2.2 Anaerobic Digestion process
The chemistry of the AD process has been widely described in literature (Felton et al., 2014; Deepanraj et al.,
2014; Zhang, 2016; Achinas et al., 2017; Raja and Wazir, 2017; Roopnarian and Adeleke, 2017) and is summarised
in Figure 2.1 and the following section.

Figure 2.1 The Anaerobic Digestion Process
Source: Roopnarian and Adeleke (2017), modified from Divya et al. (2015)

 11
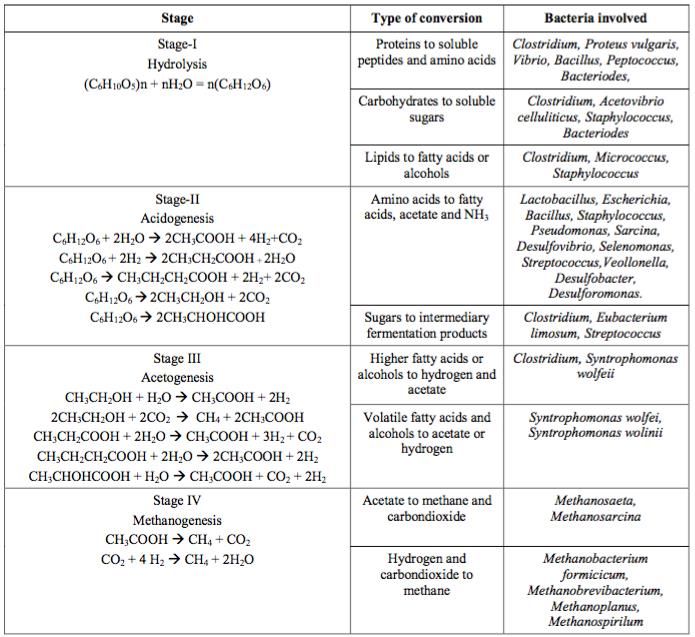
Anaerobic digestion occurs in four processes which are carried out by various groups of bacteria working
together. The basic processes have been described by Raja and Wazir (2017) and are summarised in Table 2.3.

Table 2.3 Biochemical processes of anaerobic digestion
Modified from Raja and Wazir (2017)

 Biochemical Description
 Process
 Hydrolysis Biomass is typically a complex material composed of large organic polymers, proteins,
 (or liquification) fats and carbohydrates (composition depending on source). In the hydrolysis step, these
 constituents are broken down by fermentative bacteria into smaller, soluble molecules
 such as amino acids, fatty acids, and simple sugars, making them available to other
 bacteria involved in the AD process. Hydrogen and acetate are also products of the
 hydrolysis step and may be used by methanogens in the methanogenesis stage of
 anaerobic digestion process. At the hydrolysis stage, many of the molecules may still be
 relatively large, and are further broken down in the process of acidogenesis.
 Acidogenesis The acidogenesis step of AD involves acidogenic microorganisms which further break
 down biomass and organic products after hydrolysis. The acidogens produce an acidic
 environment and metabolise amino acids and sugars creating ammonia, H2, CO2, H2S,
 shorter volatile fatty acids and organic acids, as well as trace amounts of other by-
 products. The principal acids produced are acetic acid, propionic acid and butyric acid.
 Acetogenesis Acetogenesis is the biochemical process carried out by acetogens resulting in the
 production of acetate. Acetogens catabolise the products of acidogenesis into acetic acid,
 CO2 and H2. Acetogens break down the biomass to the point where methanogens convert
 the remaining materials by methanogenisis.
 Methanogenesis Methanogenesis is the final stage of AD whereby methanogens create methane from the
 final products of acetogenesis, as well as from some of the intermediate products from
 hydrolysis and acidogenesis.

Deepanraj et al. (2014) provide a comprehensive account of the biochemical processes involved in the AD
process and summarise the micro-organisms commonly involved in the 4 steps of AD (Table 2.4). The AD process
and composition of the raw biogas outcome is dependent on the type of feedstock, most importantly, the carbon
(C) and nitrogen (N) content and the C/N ratio (Divya et al., 2015). It can also be affected by the presence of toxic
compounds which may be present in waste materials (e.g. high ammonia content, soluble copper, zinc, nickel,
mercury and chromium salts; pesticides and synthetic detergents). The AD process is also influenced by the
composition of the bacterial flora used to initiate the process, which are in turn influenced by process
parameters such as temperature (i.e. mesophilic bacteria predominate at 30-40oC whilst thermophilic bacteria
function between 50-60oC), pH (i.e. low pH can inhibit bacterial function). Castellano-Hinojosa et al. (2018) also
provide a detailed review of each of these parameters and reflect how careful consideration should be given to
feedstock and AD process design, to make the AD process as efficient as possible, in terms of biogas yield per
unit of feedstock. In the context of this review however, the sophistication of technology should be balanced
with the practicalities of scale and cost of installation and running costs for AD facilities.

 12
Table 2.4 The 4 process steps of anaerobic digestion and associated bacteria
Source: Deepanraj et al. (2104)

2.3 Anaerobic Digestion facilities
The AD process can take place naturally e.g. in landfill and other waste storage sites or within designed small-
scale, medium or large-scale reactors. Numerous types of AD systems exist, and the type and design of AD
process facilities will depend on the application and scale of the system required (e.g. wastewater treatment,
slurry treatment, food waste treatment, solid waste treatment). AD facility designs and the process parameters
which affect biogas production are well reported in literature (e.g. Weiland, 2010; Deepanraj et al., 2014; Divya
et al., 2015; Zhang et al., 2016; Meegoda et al., 2018) however, it is not the intention of this study to review all
types of digestion systems which are available for multiple applications. Focusing on Africa, the two main AD
system designs which are often considered are the ‘fixed-dome’ system, originally developed for use in China,
and the ‘floating drum’ system, developed for use in India. Both of these are often considered for small-scale
use (up to 20 m3 biogas production) or slightly larger community scale facilities. Cost, ease of use and
maintenance are important factors in choice of design (see Appendix 2 for comparisons). At the small/household
scale, a couple of other AD system designs which have been developed are the ‘balloon digestor’ and the ‘low-

 13
cost polyethylene tube digestor’, both of which are based on ingenuity and use of low cost, available materials8
(Morgan et al., 2018).
In considering the development of biogas bottling, the scale of biogas production should be a consideration and
further techno-economic assessment for specific industrial scale AD designs may need to be future consideration
in the continuation of this project. Commercial AD systems are also well documented in literature and have been
summarised by Rupf et al., (2016) among others (Table 2.5). A study by Roopnarain and Adeleke (2017) reports
on the progress made in several African countries, highlighting the scale, application and types of AD systems
which have been deployed. Kemausuor et al. (2018) report that whilst household scale biogas production
systems have been quite widely deployed in several countries in Africa, large-scale operations are limited due
to technology constraints, as well as high capital costs and lack of support from institutional and political
mechanisms.
Table 2.5 Commercial biogas technologies
Source: Rupf et al. (2016)

 Digestor Type No. of Feedstock TS/DM HRT Operating Applications
 stages range (days) temperature
 Batch reactors ≥1
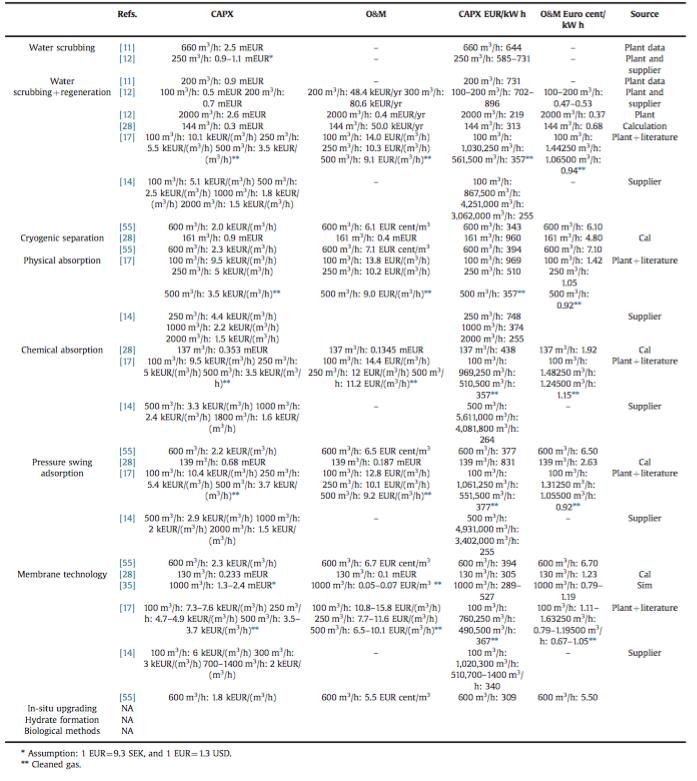
The physical and chemical properties of biogas make it impossible to bottle under normal temperature and
pressure. As is the case of Liquefied Petroleum Gas (LPG), biogas cannot be converted into the liquid state under
normal temperature and pressure. It requires a pressure of about 47.4 Kg/cm2 at a critical temperature of -
82.10C before it can be liquefied. Compression and bottling of biogas provides an option to improve the quality,
energy content, transportability and storage of biogas. The need to upgrade biogas for a wide range of
applications has led to the development of specific technologies targeting specific contaminants. Biogas
upgrading and bottling technologies have also evolved over time, with different techniques of cleaning,
compressing and bottling purified CH4 gas. The sophistication of upgrading technologies depends on the end use
application and may be reflected in the cost of the technology. When upgraded biogas meets the same
specification as natural gas, it is referred to as biomethane and more recently Renewable Natural Gas (RNG) or
Sustainable Natural Gas (SNG) (Parker et al., 2017). Salave and Desai (2017), advise that ‘the right choice of the
most economically optimal technology is strongly dependent on the quality and quantity of the raw biogas to be
upgraded, the desired biomethane quality and the final utilization of the gas, the operation of the anaerobic
digestion plant and the types and continuity of the used substrates, as well as the local circumstances of the plant
site’. The following sections provide an overview of biogas purification and upgrading technologies, and
compression and bottling technologies, from literature and practical case examples.

2.4.1 Biogas Purification and Upgrading Technologies
The development of biogas purification technologies are well documented in literature by e.g. Kapdi et al. (2005);
Petersson and Wellinger (2009); Sun at al. (2015); Miltner et al. (2017); Salave and Desai (2017); Angelidaki et
al. (2018); Sahota et al., 2018), among others. These papers describe the various techniques used to upgrade
biogas, giving detailed accounts of the gas separation principles, processes, equipment and conditions required.
Angelidaki et al. (2018), specify treatments in biogas upgrading i.e. biogas cleaning, whereby the toxic, corrosive
or harmful biogas contaminants are removed and biogas upgrading whereby the calorific/heating value and
Wobbe-Index9 of biogas is improved by the removal of CO2 and water vapour.
The processes for biogas cleaning and upgrading can be simply classified according to the targeted gases for
scrubbing10 or by the system used for gas separation. Kapdi et al., 2005 describe various scrubbing techniques
based on targeted gases (CO2 and H2S) and include physical or chemical absorption; adsorption on a solid surface;
membrane separation; cryogenic separation and chemical conversion (methanation of CO2). Agarwal and Shukla
(2009) describe a system for the removal of H2S using an acidic scrubbing system based on iron wool, followed
by a lime or water scrubbing system for the removal of CO2.
Scrubbing systems may also be classified according to the absorbents used to remove impurities e.g. Bauer et
al. (2013) describe water scrubbing, solvent scrubbing, amine scrubbing, pressure swing adsorption (based on
porous solids as absorbent), and separately, membrane gas diffusions based on molecular size separation of the
gases. Sun et al. (2015) also provide a review of technologies, based on the same classifications as Bauer et al.
(2013) and review further developing technologies, such as in-situ membrane enrichment, hydrate formation
and biological methods for biogas upgrading. The paper also provides comparisons between the energy and
financial costs for each technology, based on developments at the time of publication (2015) (Appendix 3).

9 ‘The Wobbe Index is a measure of the interchangeability of fuel gases and their relative ability to deliver energy. It gives
an indication of whether a turbine or burner will be able to run on an alternative fuel source without tuning or physical
modifications’ https://neutrium.net/properties/wobbe-index/
10 Gas scrubbing is a generic term which is used to describe the removal of gaseous pollutants from a larger gas stream

(https://tapc.com.au/gas-scrubbing/)
 15
Sahota et al. (2018) describe biogas purification technologies based on the mechanisms of separation i.e.
absorption, adsorption and physical separation. Absorption technologies are based on gas: liquid diffusion,
whereby the separation of gases occurs as the result of their relative solubility in the chosen solvent.
Absorption technologies are further defined as physical absorption based on water or organic solvents and
chemical scrubbing, based on a chemical interaction with the liquid solvent. Adsorption technologies are defined
by the interaction (adhesion or binding) between selective components of the gaseous mixture and a solid
material. The type of interaction (physisorption or chemisorption) further defines the separation technology, as
the result of the process of absorbent regeneration i.e. by pressure swing absorption, purge gas stripping,
electrical swing, temperature swing or displacement desorption. The third classification of biogas purification as
defined by Sahota et al. (2018) is physical separation as the result of selective permeation of gases through a
membrane, based on the molecular size of gases and chemical affinity to the membrane, when a
pressure/concentration gradient is established. Different types of membranes have been studied for separation,
including inorganic membranes, polymeric membranes and mixed matrix membranes.
A number of emerging technologies have also been reviewed, including cryogenic biogas upgrading, which
involves the separation of gas mixtures by fractional condensation and distillation at low temperatures, and in-
situ methane enrichment. The development of the ‘industrial lung’ and biogas upgradation through supersonic
separation are methods which are underdevelopment (Sahota et al., 2018). Table 2.6 provides a review of the
advantages and disadvantages of biogas upgrading technologies and a summary of biogas upgrading processes
can be found in Appendix 4.
Table 2.6 Comparison of biogas upgrading technologies
Source: Sahota et al. (2018)

 16
The choice and feasibility of introducing a biogas upgrading technology is influenced by a number of factors e.g.
substrate composition, biogas composition, scale of AD operation, end use application of the upgraded biogas,
requirements of existing infrastructure, cost of biogas upgrading process (installation, energy costs and O&M).
A summary of biogas upgrading technologies in Europe by Valorgas (2009) suggests that high pressure water
scrubbing is the most suitable for small-scale biogas upgrading as it is low cost for installation and maintenance
and gives high yields of high purity biogas. At the larger scale, biogas upgrading is optimised to maximizing
methane content and purity, and energy efficiency. Water scrubbing is highlighted for its economic viability vs.
cryogenic and chemical absorption techniques which, although providing higher efficiency of upgrading require
higher investment however, operational costs may balance out investment costs in larger scale applications for
cryogenic and membrane technologies (Sahota et al., 2018).

2.4.2 Compression and Bottling Techniques
The underlying principle for compression of biogas is to increase pressure and reduce volume, to improve
storage and transport options and to concentrate energy content. It has been established that compression of
upgraded biogas is more effective than raw biogas, and various compressor systems exist, which can be used in
conjunction with upgrading technologies. Olugusa et al., 2014 have provided a review of commercially available
technologies suitable for use for biogas compression in Nigeria, citing details from one particular company.
According to Davey Compressors Company Ltd. (www.daveycompressors.com), 4 different systems are available
commercially (i.e. reciprocating compressors, rotary screw compressors, rotary vane compressors and
centrifugal compressors) each of which has its own advantages and disadvantages in terms of cost, simplicity of
design, ease of use and maintenance etc.
The type of storage system for biogas will also influence decisions on the type of compressor system required.
As highlighted by Kapdi et al., 2005 (Table 2.7), different storage systems under different pressures will require
more or less robust (and costly) systems for storage, However, if the purpose of the process is to increase access
to biogas in a storable, transportable for then higher costs for storage systems should also be taken into account.
Table 2.7 Biogas storage options

 Pressure Storage Device Material
 low (0.138-0.414 bar) water sealed gas holder steel
 low gas bag rubber, plastic and vinyl
 medium (1.05-1.97) propane or butane tank steel
 high commercial gas cylinders alloy

2.4.3 Biogas Upgrade, Compression and Bottling Case Studies
Case Study 1
Realizing the high potential for biogas in India and its current underutilization of 10% of the possible capacity,
Grassroots Energy Technologies Pvt Ltd (GRE), a private company wholly owned subsidiary of US C-Corp founded
in 2015, initiated investigations into various aspects of biogas technology. They identified lack of reliability,
labour, instrumentation and knowledge as a limiting factor for the uptake of small-scale plants in rural areas.
With large scale plants (600 m3 per day), the major cause of lack of utilisation was identified as high capital cost
and specific location limitations due to the uninform distribution of feedstock. GRE intend to solve these issues
through innovative approaches, such as introducing a 100 m3 plant, with an upgrading facility to improve CH4
concentration in excess of 90%, as well as improving reliability by using modular and prefabricated biodigesters.

 17
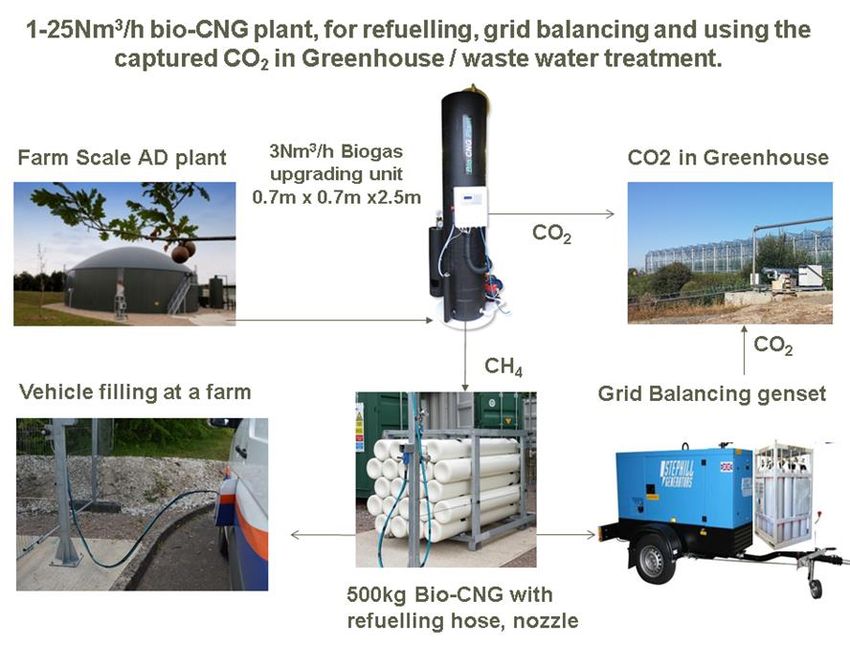
Their technology for removing CO2 can be seen in Figure 2.3, where an absorption disk stack provides a high
surface area to dissolve CO2 from biogas into water.

Figure 2.2 Biogas Plant System
Source: https://www.grassrootsenergy.co/

Figure 2.3 Removal of CO2 from biogas
Source: https://www.grassrootsenergy.co/

The upgraded gas is contained in specialised balloons (under atmospheric pressure) and a CNG filling pump is
refitted to compress biogas into cylinder cascades for storage. The compressing facility can be seen in Figure 2.4.

Figure 2.4 CNG compressing facility
Source: https://www.grassrootsenergy.co/

 18
The company indicates that, biogas produced this way competes with LPG with a 25% cut in cost, making the
former a potentially preferable choice. They also indicate that CNG could be a better substitute for automotive
fuels with a 50% reduction in cost. The developments in these projects have added to the justification for the
use of CNG in India and places like Africa, where there is the need to transition to clean cooking fuels.
Case Study 2
The approach taken by GRE’s is quite recent, however, it is known that investigations on biogas bottling have
been going on in an entrepreneurial mode in India for some years. According to Bamboriya (2012),
demonstration projects on medium-size, mixed-feed biogas plants for generation, purification and bottling of
biogas, under the Research, Development, Demonstration and Distribution policy of the Indian Ministry of New
and Renewable Energy, were developed in 2008-2009. Such installations had the objectives of producing bio-
CNG to the same quality as CNG (i.e. 98% methane), to be used as vehicular fuel as well as for solving energy
needs for stationary and motive power, electricity generation and thermal applications. The approach was
intended to enhance decentralised energy systems, with the backing of sustainable business models. With the
Indian Government’s financial support, pilot projects were executed in Chhattisgarh, Gujarat, Haryana,
Karnataka, Maharashtra, Punjab, Madhya Pradesh, Andhra Pradesh and Rajasthan. An example of the project in
Ganganagar, Rajasthan is shown in Figure 2.5. The project proved viable with net profit of 34.92 (Rs. in lakh) and
payback periods of 5-6 years and 3-4 years respectively for a non-subsidised and a subsidised case.

Figure 2.5 Biogas bottling by Singlar Bio-Energy
Source: https://www.kisgroup.net/biogas-purification.html

2.4.4 Engas UK biogas purification technology – an opportunity for Ghana and Uganda
For this clean cooking project, the availability of feedstock is one of the determining factors for the selection of
suitable technology for biogas purification for its scale of operation, modularity, initial investment, and risk
mitigation for the continuation beyond the grant-funded phase. Various conventional biogas upgrading
technologies have been discussed as above, but finding the right kind of technology in the context of Ghana and
Uganda is of vital importance.
There are various biogas purification technologies available in Europe and other countries, where gas scrubbing
technologies are required for other industries. However, whether an existing European technology will be
 19
suitable in Ghana and Uganda is subject to further investigation; for example ,the technology might require local
customization for warmer climates (e.g. cooling instead of heating), and also changing the construction material
specification from stainless steel to other, lower-cost materials to make cost targets viable. This may well require
some local manufacturing and re-developmental work. As a start, the publicly available information on European
products on their quoted capital cost, servicing cost, required minimum-gas-flow rate, and being susceptible to
the impurities of raw biogas, are considered in the given context. For example, a typical 100 – 500 Nm3/h raw
biogas upgrading plant from European suppliers (e.g. Greenlane, DMT, Air Products, Parker etc) would cost from
£900,000 to £1300,000 per plant. The challenge however would be to produce and supply 500 Nm3/h raw biogas
consistently for a period of 15-20 years.
Looking at this market challenge and opportunities in the context of developing countries, Engas UK Ltd (based
in Horsham, West Sussex), has developed a new kind of water scrubbing system. Unlike the conventional water
scrubbing system, Engas UK has combined biogas compression, scrubbing and gas-drying into one single step to
purify biogas, compress and dry bio-CNG; this innovation has enabled significant reductions in the capital cost,
and is more energy efficient.
Conventional Water Scrubbing technology
In conventional water scrubbing systems, the raw biogas is first compressed to 8-9 bar, using a separate
centrifugal compressor/screw compressor. This pressurized raw biogas is fed in at the bottom of a 13-14 m tall
scrubbing tower, while high pressure water (8-9 bar) is trickled down from the top of the tower through a packing
medium, to allow contact between the rising gas flow against the downward flowing water. Water soluble gases
(e.g. CO2, H2S, NH3, siloxanes) are absorbed in water under 8-9 bar pressure leaving behind methane (CH4), which
has significantly reduced solubility in water in this condition, compared to CO2. Pure and wet methane leaves
from the top of the scrubbing tower towards a gas dryer.
CO2 laden water along with other gases (H2S, NH3, siloxanes and some CH4), is released at the bottom of the
scrubbing tower in a controlled manner, into a pressurised tank (called the flash-tank) where the pressure is
dropped to around 2 bar, in order to release 3-5% residual CH4 (due to is lower solubility at 2 bar than 8-9 bar).
This CH4 is also sent to the gas-dryer to separate the moisture and to produce 95-96% pure dry methane (bio-
CNG, biomethane) for immediate use or for further compression.
The flash tank plays a vital role in conventional water scrubbing systems, to prevent a significant loss of methane
(around 7-9 %) from the system. The operational and control of this flash tank is fairly complex, requiring fine
adjustment of flow rates for both gas and liquid, controlling liquid level, pressure, rate of gas purging etc.
After extracting methane from the flash-tank, water is then pumped into a degassing tower which is kept at
atmospheric pressure. The degassing tower is a tall (10 m) water pipe (about 25-50 cm diameter), packed with
pall rings to increase the contact area between gas and liquid. A fan-blower installed at the bottom of the
degasser tower injects fresh air through the degasser as a counter flow of falling water from the top. This flash
air inside the degasser helps to reduce the partial pressure of CO2 i.e. helps degassing from water. As a result of
this air diffusion mechanism into water, and due to the release of CO2, the pH level of water returns back to
normal (around 6.9-7) for its reuse in the next scrubbing cycle.
To summarise, three separate stages are compulsory in conventional water scrubbing i.e. i) pre-compression of
raw biogas, ii) scrubbing of raw biogas using a 13-14 m tall towers including the flash-tank mechanism and
degassing tower, and iii) gas drying of biomethane for end use. Due to these multiple steps, a large number of
additional parts and equipment (e.g. a separate compressor, gas dryer) are needed, adding to cost and
servicing/maintenance. Energy consumption is also high e.g. the dryer needs energy to regenerate the moist
 20
You can also read