The potential local and regional impacts of COVID-19 in New Zealand - With a focus on tourism - NZIER
←
→
Page content transcription
If your browser does not render page correctly, please read the page content below

The potential local and regional
impacts of COVID-19 in New Zealand
With a focus on tourism

NZIER public discussion paper
Working paper 2020/03
About NZIER

 NZIER is a specialist organisation that uses applied economic research and analysis to
 provide a wide range of strategic advice.
 We undertake and make freely available economic research aimed at promoting a better
 understanding of New Zealand’s important economic challenges.
 Our long-established Quarterly Survey of Business Opinion (QSBO) and Quarterly Predictions
 are available to members of NZIER.
 We pride ourselves on our reputation for independence and delivering quality analysis in
 the right form and at the right time. We ensure quality through teamwork on individual
 projects, critical review at internal seminars, and by peer review.
 NZIER was established in 1958.

Funding

 Each year, NZIER devotes resources to undertake and make freely available economic
 research and thinking aimed at promoting a better understanding of New Zealand’s
 important economic challenges. This paper was funded as part of this public good research
 programme.

Authorship

 This working paper was prepared at NZIER by Laëtitia Leroy de Morel, Glyn Wittwer (CoPS),
 Dion Gämperle and Christina Leung. It was presented at the 23rd Annual Conference on
 Global Economic Analysis organised by GTAP (17–19 June 2020).
 This working paper was quality approved by John Yeabsley and Chris Nixon.
 The assistance of Peter Clough and Sarah Spring is gratefully acknowledged.

 Registered office: Level 13, Public Trust Tower, 22–28 Willeston St | PO Box 3479, Wellington 6140
 Auckland office: Ground Floor, 70 Shortland St, Auckland
 Tel +64 4 472 1880 | econ@nzier.org.nz | www.nzier.org.nz

 © NZ Institute of Economic Research (Inc). Cover image © dreamstime.com
 NZIER’s standard terms of engagement for contract research can be found at www.nzier.org.nz.

 While NZIER will use all reasonable endeavours in undertaking contract research and producing reports to ensure the information is as
 accurate as practicable, the Institute, its contributors, employees, and Board shall not be liable (whether in contract, tort (including
 negligence), equity or on any other basis) for any loss or damage sustained by any person relying on such work whatever the cause of
 such loss or damage.
Key points

We use our CGE model to assess the potential impacts of COVID-19 on the New
Zealand economy and its regions
 Our regional CGE model is used to run three scenarios (phases) based on the different alert
 levels (1-4) imposed by the New Zealand Government.
 For each phase, we mostly focus on restrictions applied to the entry and movements of
 people as well as on labour and capital temporarily rendered idle due to the isolation and
 social distancing measures.
 We do not explicitly model any fiscal response to showcase the base against which fiscal
 policies can be assessed.

The impacts of COVID-19 affect the wider-economy, not just tourism
 Tourism is hit hardest. The tourism sector (domestic and foreign tourism) is the most
 affected by COVID-19 restriction measures (Figure 1). It is also the sector that is likely to
 take longer to recover compared with other sectors.
 • Domestic tourism is expected to recover relatively quickly, with public campaigns
 playing a role in restoring regional demand.
 • The impact on international tourism may last much longer given that border
 restrictions are expected to last until 2022.
 However, the economic effects of COVID-19 go beyond the tourism sector:
 • Industries that support the tourism sector, such as accommodation, food and beverage
 services and transport industries, are also significantly hit by the isolation measures
 and travel ban.
 • Output also decreases, although less sharply, in industries that are not directly reliant
 on the tourism sector (e.g. other primary sector and manufacturing, construction and
 other services). This is due to a decrease in available labour and capital immobilised by
 the implementation of restriction measures.
 • While real annual GDP loss (in percentage terms) is the highest in tourism-centric
 regions (Queenstown-Lakes, Rotorua and Auckland), all regional economies of New
 Zealand are expected to contract due to the direct and flow-on effects associated with
 the COVID-19 restriction measures.

New Zealand’s annual GDP could be reduced by up to $21 billion under lockdown,
with the effects lessening as New Zealand moves down the alert levels
 Figure 1 shows that New Zealand’s GDP has fallen back to a similar level to 2016. In other
 words, COVID-19 has removed 3 years of GDP growth. We expect that it will take at least an
 additional 4 years until New Zealand’s GDP returns to its pre-COVID level (2019).

 iv
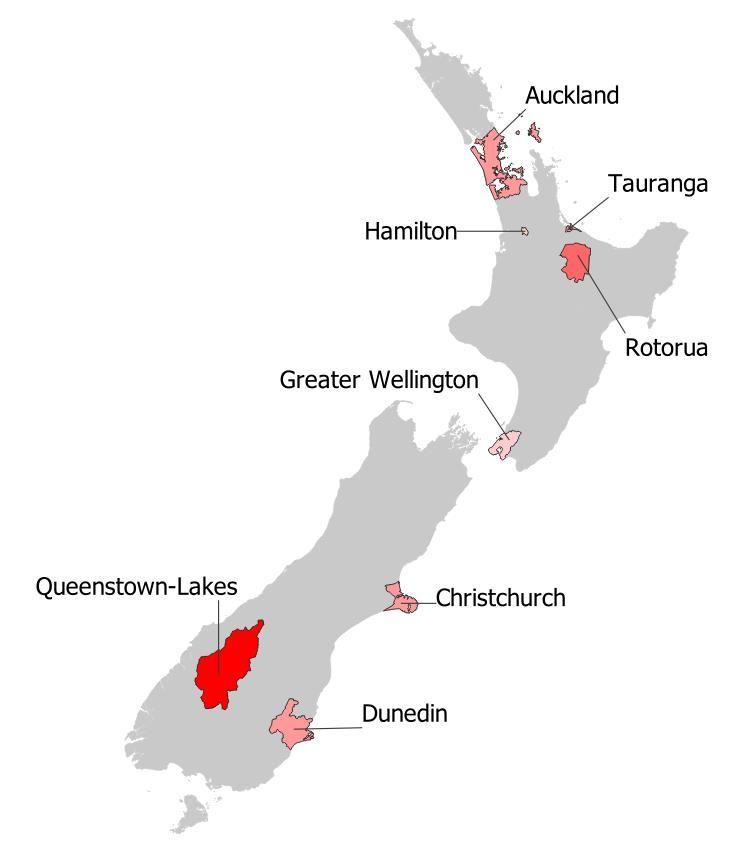
Figure 1 New Zealand’s real GDP recovery path and impacts on different sectors1
 Annual changes from 2019 baseline, in $ million Annual changes from 2019 baseline, in percentage

 Source: NZIER

 What are the policy implications?
 Over the longer term, as economic impacts remain, there will be a need for greater
 flexibility to allow for both physical and human capital to be redeployed toward surge
 industries. Focusing on investment that builds physical and human capital to foster an
 environment where the New Zealand economy can adapt quickly to changing
 circumstances will be most conducive to a sustainable recovery.

 Our results are driven by supply and demand side effects
 On the supply side, results are driven by the reduction in labour and capital across
 industries as a result of the lockdown. This includes a marked decline in the amount of
 manufacturing and services activity, especially under Alert Level 4.
 On the demand side, our results flow from the decrease in international tourism and
 domestic tourism. Both declines largely reflect the effects of border closures and travel
 restrictions within the country. We expect there will be some substitution from New
 Zealanders taking domestic holidays instead of international holidays. However, even with
 this substitution effect, domestic tourism is likely to be 49% lower in 2020, relative to 2019.

1 For simplification purposes, we have combined industries that have a similar recovery path such as agriculture and food
 manufacturing, construction and other services, other primary sector and manufacturing industries.

 v
Assumptions and caveats as of 15 June 2020

 • This discussion paper uses assumptions that were defined before 15 June 2020; the
 date at which this paper was finalised and submitted to the GTAP conference for
 presentation. As such, there is considerable uncertainty about the severity of the
 potential economic impacts of COVID-19. We address some of these uncertainties
 through the design of modelling scenarios (phases). We are mindful that our modelling
 scenarios and underlying assumptions are based on data that was available at the time
 we wrote this paper and that the situation is evolving rapidly.
 • We used the static version of our regional CGE model, TERM-NZ, which looks at
 ‘before’ (i.e. pre-COVID-19) and ‘after’ (with different COVID-19 alert levels). As such,
 we do not explicitly model the timing of the different restriction measures imposed by
 the New Zealand Government under the different alert levels. We also do not take into
 consideration the economic growth that would have happened without COVID-19.
 • We decided to not explicitly model any fiscal response in order to showcase the base
 against which fiscal policies can be assessed.
 • The key strength of a CGE model is that it explicitly builds in various constraints around
 resource availability in the economy, so that any expansion of one part of the economy
 leads to fewer resources being available elsewhere in the economy (unless the shock is
 a productivity gain).
 As such:

 − CGE models are based on a strong theoretical framework that incorporates utility
 maximising households and cost-minimising firms.
 − CGE models also capture the multidirectional flows between the various actors of
 the national economy and how they interact with the rest of the world. This
 complexity allows the models to be applied to a wide range of ‘what if’ questions
 and to be a powerful tool to facilitate evidenced based policy development.
 − Additionally, our CGE model incorporates a very high level of industry and
 commodity detail, so that the distributional impacts of shocks to the economy (i.e.
 winners and losers) can be estimated. It can also explore the regional and local
 distribution of economic impacts.
 • Despite their strengths, there are some key limitations inherent in most CGE models,
 for example:
 − As they represent the inner workings of an entire economy, rather than one
 sector, CGE models depend on many data sources, parameters, equations and
 assumptions. When official data sources are thin or not available, we need to
 make assumptions, normally based on unofficial sources or from international
 literature.
 − The economic theory underpinning CGE models is usually neoclassical in nature. In
 this setting, consumers maximise utility, firms minimise costs, resources can move
 between sectors, and firms do not generate super-normal profits. These
 assumptions can legitimately be questioned.

 vi
• These caveats do not mean that our modelling results are not robust. Rather, they
 reflect the inherent challenges in carrying out economic modelling work in such
 uncertain times.
• We hope that our approach draws out some of the costs, benefits and trade-offs
 associated with COVID-19 and associated social and travel restriction measures in New
 Zealand. We have sought to be as transparent as possible about our methodology,
 data and assumptions; and their limitations.

 vii

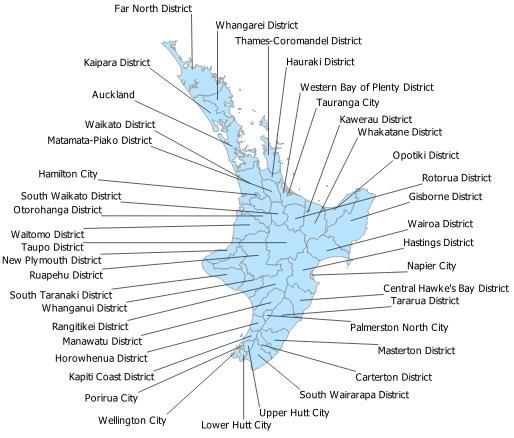
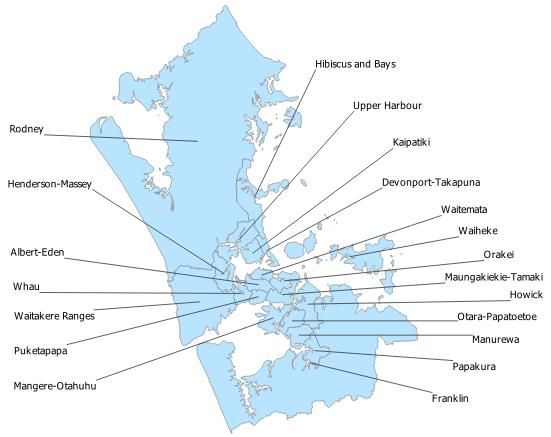
Contents

1 Introduction ...................................................................................................................................1
2 Literature review ............................................................................................................................2
3 Snapshot of the tourism sector in New Zealand ............................................................................3
4 The TERM-NZ model ......................................................................................................................5
 4.1 Key feature of the model .....................................................................................................5
 4.2 The TERM-NZ database........................................................................................................7
 4.3 Introduction of new tourism industries ...............................................................................7
 4.4 Bottom-up regional modelling.............................................................................................8
5 Illustrative simulations on the tourism sector in New Zealand .....................................................9
 5.1 Scenario design based on NZIER tourism forecasts .............................................................9
 5.2 Simulation results ..............................................................................................................13
6 Discussion on assumptions and policy implications ....................................................................20
7 References....................................................................................................................................22

Appendices
Appendix A Our CGE model: TERM-NZ.................................................................................................. 25
Appendix B Extending the TERM-NZ database – methodology ............................................................ 26
Appendix C Model closure .................................................................................................................... 33
Appendix D Information needed to extend the database .................................................................... 34
Appendix E Aggregated industries in the TERM-NZ database .............................................................. 35
Appendix F Geographical detail in the TERM-NZ database................................................................... 37

Figures
Figure 1 New Zealand’s real GDP recovery path and impacts on different sectors................................. v
Figure 3 Share of tourism expenditure by product in New Zealand ........................................................4
Figure 4 Our CGE model represents the circular flows between all the agents and activities in the
 economy ................................................................................................................................6
Figure 5 Potential timing of lifting New Zealand international and domestic travel restrictions ..........10
Figure 6 NZIER’s monthly tourism forecasts and 12-monthly moving average (12mma) .....................10
Figure 7 New Zealand’s real GDP recovery path ....................................................................................15
Figure 8 Real GDP decreases the most in tourism-centric regions ........................................................16
Figure 9 Regional real GDP recovery path under the different phases .................................................17
Figure 10 Real household spending decreases the most in tourism-centric regions ............................18
Figure 11 Sector impacts under the different phases at the national level ...........................................19
Figure 12 Process overview to extend the TERM-NZ database .............................................................32
Figure 13 New Zealand districts represented in our database – North Island ......................................37
Figure 14 New Zealand districts represented in our database – South Island.......................................38
Figure 15 Auckland local boards represented in our database..............................................................39

 viii
Tables
Table 1 Tourism and foreign students forecasts under different scenario assumptions ......................13
Table 2 Headline economic impacts.......................................................................................................14
Table 3 Impacts on regional GDP ...........................................................................................................15
Table 4 Impacts on regional real household spending...........................................................................17
Table 5 Regional and sectoral information and sources ........................................................................34
Table 6 CGE industries in the extended TERM-NZ database..................................................................35

 ix
1 Introduction

 The outbreak of COVID-19, which started in China in December 2019, has since spread to
 the rest of the world and was recognised as a pandemic on 11 March 2020. In response to
 COVID-19, many countries have limited people’s movement by closing their borders to
 foreign visitors and adopting measures of social distancing and confinement.
 Due to its geographic isolation, New Zealand has been able to watch as the situation
 evolved in China, Italy, Spain, France and the USA. As a consequence, the country rapidly
 implemented strict measures to limit and contain the spread. New Zealand’s lockdown was
 imposed on 25 March 2020 when the country had only 262 cases.
 As of 15 June 2020, New Zealand’s confirmed and probable cases reached 1,504. Like other
 countries, New Zealand closed its borders to foreign travellers and declared a 4-week
 confinement period with all business premises closed except for essential services such as
 medical, pharmaceutical and food supply. The country has also adopted social distancing
 measures with recommendation such as staying 2 metres away from others, avoiding large
 groups and ordering groceries online and have them delivered home to avoid supermarket
 queues.
 The duration of New Zealand’s business restrictions under COVID alert levels is uncertain
 and will mostly depend on how fast the country can flatten the curve (i.e. slowing the
 spread of the virus over time) and reduce the number of new cases. If the lockdown
 succeeds, social distancing measures will be eased, and non-essential businesses will be
 able to reopen. However, borders are likely to remain closed for travellers or their entry to
 the country severely curtailed for the next few months. Given the importance of the
 tourism sector for the New Zealand economy, COVID-19 is expected to have significant
 negative impacts for the economy.
 To date, no publicly available study has looked at the economic impacts of COVID-19 on
 New Zealand and its tourism sector using a computational general equilibrium (CGE)
 modelling framework. Through the work presented here, we provide an attempt to fill the
 gap by focusing on measuring the impacts of COVID-19 on tourism and the wider economy
 at both the regional and national levels. Using our regional bottom-up CGE model TERM-
 NZ, which allows for a disaggregated tourism sector, we model three different scenarios
 (phases) to better understand the potential economic impacts of COVID-19 on foreign and
 domestic tourism in New Zealand.
 The paper is structured as follows. Section 2 outlines our literature review which explored
 what has been done in terms of CGE modelling on tourism and pandemics. In section 3 we
 present a snapshot of the New Zealand tourism sector. We then outline the model,
 scenarios and input data used for our modelling application in section 4. In the subsequent
 sections, we present and discuss results as well as the conclusions drawn for industry
 stakeholders and policy makers.

 1
2 Literature review

 Measuring the contribution of tourism to a national economy is a difficult exercise. On the
 demand side, tourism represents the sum of tourist expenditure on a wide range of
 products. From the supply side, tourism can be viewed as a collection of productive
 activities that are mostly used by tourists. As such, tourism is not identified as a single
 industry in national accounts (United Nations 2010).
 A significant amount of research work has been done over the last few decades to fill the
 gap and better estimate the economy-wide effects of tourism.
 Until recently, tourism analysis was heavily reliant on input-output (I-O) analysis. Archer
 (1977) and Fletcher (1989) provide examples of and discuss some of these studies.
 However, I-O models suffer several shortcomings. For example, they assume that all wages
 and prices remain constant, regardless of the levels of production and demand. Hence, they
 consider that economic resources such as land, labour and capital are infinitely available,
 are never idle or can be reallocated without adjustment costs. They also do not consider
 any crowding-out effects (Dwyer et al. 2003). As such, I-O models can lead to misleading
 results, including in tourism analysis, as they do not take into account the effects of tourism
 on factor prices, incomes or income distribution.
 In contrast, CGE models are not only driven by prices that respond to changes in supply and
 demand, they also account for resource constraints and flow-on effects. Contrary to I-O
 analysis, CGE models capture the complex and multi-directional flows between tourism,
 other sectors in the economy and foreign producers and consumers.
 Given their versatility, CGE models have recently appeared as a relevant and important tool
 for tourism policy analysis (Dwyer 2015) and are now increasingly used for tourism
 economic analysis and policy implications. CGE analysis of tourism has been facilitated with
 the introduction of tourism satellite accounts (TSAs) in the mid-1990s,2 which have enabled
 tourism to be identified as an economic driver for GDP, employment, investment and
 consumption. See Dwyer et al. (2006) for an illustration and discussion on the differences,
 similitudes and complementarities between TSAs and CGE application.
 In the last 15 years or so, applications of CGE modelling in tourism have included evaluation
 of the economic contribution of the tourism sector (Dwyer et al. 2003), economic impact
 evaluations of government policies (Blake, Gillham and Sinclair 2006) changes in inbound
 tourism (Dwyer et al. 2003; Dixon et al. 2019) and changes in the number of foreign
 students (Dixon et al. 2019).
 Several studies that use CGE modelling have also looked at the impacts of a special event or
 crisis, including a disease pandemic. For example, Dixon et al. (2001), Giesecke et al. (2012,
 2015) and Nassios and Giesecke (2018) all looked at the tourism and economy-wide effects
 in Australia of the 9/11 terrorism attack. Other studies such as Moss et al. (2016) explore
 the impacts of a possible Ebola outbreak in the Asia-Pacific.
 Dwyer et al. (2006) used a CGE model of the Australian economy to show that the effects of
 SARS on the Australian tourism industry were less severe than what was perceived by
 stakeholders of the tourism industry. The authors show that the economic impact of a crisis

2
 Canada was one of the first to adopt a tourism satellite account and published results in 1994, followed by other countries such as
 France, New Zealand, Mexico, Norway, Singapore, Sweden and the USA (United Nations 2010).

 2
on an economy is contingent on whether cancelled or delayed outbound travel is
 substituted by savings, domestic tourism or for the purchases of other goods and services.
 The results indicate that substitution effects must be considered in estimating the impact of
 some adverse situation on the economic contribution of tourism to a destination.
 Keogh-Brown et al. (2010) and Smith et al. (2011) use a CGE model to measure the
 potential economic impact of a global infectious disease pandemic on the United Kingdom,
 France, Belgium and the Netherlands. In both papers, the authors conclude that the impact
 of a pandemic influenza is less significant than disease-mitigation policies such as school
 closures and increased absenteeism of healthy workers.
 Verikios et al. (2015) assess the global effects of two influenza pandemics with a global CGE
 model and show that the economic impacts are more significant in the case of a pandemic
 characterised by a high infection rate and low virulence rather than a pandemic with a low
 infection rate and high virulence.
 More recently and topical, Wittwer (2020) used a multi-regional dynamic CGE model of
 Australia, TERM-WINE, to provide an assessment of the economic impacts induced by
 bushfires and COVID-19 in the country, with a particular focus on the grape and wine
 sectors.
 As far as we know, no publicly available study has been done that looks at the economic
 impacts of a disease pandemic on tourism and the wider economy in New Zealand within a
 CGE modelling framework. We attempt to fill the gap by focusing on measuring the impacts
 of COVID-19 on regional tourism in New Zealand.

3 Snapshot of the tourism sector in New Zealand

 New Zealand tourism is a $41 billion industry (from Stats NZ’s TSA). Tourism expenditure
 contributed to $16.2 billion of direct value added, which represents 5.8% of direct
 contribution to GDP. It accounted for 20% of New Zealand total exports in the year to
 March 2019, with international visitors spending $17 billion. Domestically, New Zealanders
 spend $24 billion annually in places outside their residence (40 km radius from home).
 Tourism also benefits the New Zealand Government, providing $3.8 billion in value-added
 tax (GST).
 Figure 2 shows that retail trade significantly benefits from tourism, with tourists spending
 $12 billion annually on alcohol, food, fuel and other retail products. This is followed by
 transport ($10 billion), food and beverage services ($4.7 billion) and accommodation
 services ($3.3 billion). Both air transport and accommodation are highly dependent on
 tourism with over 90% of all spending in these industries coming from tourists compared to
 only 43% for the food and beverage services industry.

 3
Figure 2 Share of tourism expenditure by product in New Zealand

Source: Stats NZ, Tourism Satellite Account (2019)

Over 220,000 people are directly employed in the New Zealand tourism industry (8.4% of all
employment), with an additional 160,000 people indirectly employed through industries
supplying the tourism industry (6% of all employment).
Stats NZ’s Tourism Satellite Account (TSA) is New Zealand’s official source of tourism
statistics. However, these numbers are not timely, as provisional numbers are released for
the previous year. The Ministry of Business, Innovation and Employment (MBIE) also
produces a range of tourism statistics. These numbers represent estimates rather than
official statistics. However, they are reasonably robust, timelier and include more detailed
breakdowns. This is especially relevant given that MBIE’s data can be broken down by
region.
Of all tourist expenditure, 29% occurs in Auckland, which is New Zealand’s largest city and
hosts New Zealand’s largest airport. Auckland Airport welcomes 71% of all visitor arrivals in
New Zealand. The next largest tourism markets are:
• Queenstown-Lakes (10% of all tourism expenditure)
• Christchurch City (9% of all tourism expenditure)
• Wellington City (7% of all tourism expenditure)
• Hamilton City (3% of all tourism expenditure)
• Tauranga City (3% of all tourism expenditure)
• Rotorua District (3% of all tourism expenditure)
• Dunedin City (3% of all tourism expenditure).
International tourists spend more in Auckland and Queenstown-Lakes than domestic
tourists. Auckland and Queenstown-Lakes make up 38% and 16% respectively of the

 4
international tourism market in the country but only 23% and 6% respectively of the
 domestic tourism market. Conversely, data from MBIE shows that domestic tourists spend
 more than international tourists in Wellington City, Hamilton City, Tauranga City and
 Dunedin City.
 Based on MBIE’s regional tourism estimates described above, we choose to focus on the
 following districts (territorial authorities):
 • Auckland City
 • Queenstown-Lakes District
 • Christchurch City
 • Wellington City
 • Hamilton City
 • Tauranga City
 • Rotorua District
 • Dunedin City
 • Rest of North Island (which accounts for 20% of tourist expenditure)
 • Rest of South Island (which accounts for 13% of tourism expenditure).

4 The TERM-NZ model

 For this paper, we use our bottom-up multi-regional CGE model TERM-NZ. TERM-NZ stands
 for ‘The Enormous Regional Model of the New Zealand economy’. It is based on the original
 Australian multi-regional TERM model (Wittwer 2012, 2017).

4.1 Key feature of the model
 Given the model’s multi-regional bottom-up structure, New Zealand regions/districts are
 each modelled as an independent CGE model, which means that New Zealand
 regions/districts are linked via inter-regional trade and inter-regional movements of labour
 and capital.
 The model is based on a neoclassical foundation in which supply and demand are
 determined for each commodity produced at the regional/district level based on profit
 maximisation by producers and utility maximisation by households in the region/district.
 The model also assumes mobility of labour and competitive markets within each
 region/district. At the regional/district level, each industry chooses labour, capital and land
 to maximise its profits while functioning in a competitive market.
 A regional representative household purchases an assortment of goods and services based
 on individual preference, relative prices and available income. Investment is divided
 amongst regional industries in such a way that it maximises rates of returns to investors
 (households, firms). Each regional industry uses industry-specific capital in a cost-
 minimising fashion.

 5
Within each region, there is a local and central government. Local government within each
region follows a central fiscal framework. Behaviours of foreign tourists are expressed by
export demand curves for goods and services from each region and by supply curves for
international imports to each region.
Other key assumptions within the model include the following:
• Production inputs are intermediate inputs (domestic and imported) and primary
 factors (labour, land and capital).
• The demand for primary factors and the choice between imported and domestic
 commodities are determined by constant elasticity of substitution (CES) production
 nests. This means an increase in the price of one input shifts sourcing towards another
 input.
• Intermediate goods, primary factors and other costs are combined using a Leontief
 production function. This means the proportion of production inputs is held constant
 for all levels of output.
• The production mix of each industry is dependent on the relative prices of each
 commodity. The proportion of output exported or consumed domestically is also
 dependent on relative prices.
A visual representation of our CGE model is shown in Figure 3. It highlights how the model
captures the complex and multidirectional flows between the various actors of the national
economy and how they interact with the rest of the world.

Figure 3 Our CGE model represents the circular flows between all the agents and
activities in the economy

Source: NZIER

 6
4.2 The TERM-NZ database
 TERM-NZ is originally based on Stats NZ’s 2013 Input-Output tables, which contain
 information on 106 industries and 201 commodities. The model’s database is benchmarked
 to the latest annual national accounts data (GDP expenditure and income side components)
 once year.
 We have recently worked on extending our original database. The new TERM-NZ database
 contains information on 88 districts, which represent New Zealand’s 67 territorial
 authorities and 21 local boards in Auckland. The model also contains information on 149
 industries producing a similar number of commodities. This development work included the
 addition of five new tourism industries, which are directly relevant to this paper.
 The TERM-NZ model is usually run with an aggregated version of the database to speed up
 the computational process and because it is not technically possible to run such a large
 database with its full dimensions.
 A description of the aggregated industries can be found below in Table 6 in Appendix E.
 Figure 12, Figure 13 and Figure 14 in Appendix F show maps of the New Zealand districts
 and Auckland local boards.
 We provide below an overview of the methodology we applied to add tourism industries
 and (sub)regional details. Figure 11 in Appendix A provides an overview of the different
 steps undertaken to extend our TERM-NZ and add sector and district-level detail.

4.3 Introduction of new tourism industries
 In the original TERM-NZ database, tourism3 is not identified as a separate industry or
 product but rather is nested in the expenditure of households and industries on products
 such as accommodation, food and beverages or transport.
 We follow the approach of Wittwer (2017) to extend the TERM-NZ database with the
 addition of five new tourism industries. This is done by combining all the economic
 activities linked to tourism (characteristic and related tourism activities).
 These are the new tourism industries:
 • Domestic holiday, which represents tourist expenditure made by New Zealanders,
 undertaken domestically, either locally or inter-regionally. We used visitor expenditure
 by New Zealanders, including all corresponding taxes and margins.
 • Foreign holiday (imported New Zealand tourism) represents tourism-related
 expenditure made by New Zealanders travelling abroad. We used international
 expenditure of New Zealanders travelling abroad.
 • Export tourism (foreign tourism) covers tourism expenditure by foreign visitors in New
 Zealand, not travelling for education purposes. We used expenditure by foreign
 travellers in New Zealand other than foreign students studying in the country.
 • Export student (foreign student) represents the expenditure by foreign students in
 New Zealand. We used expenditure by foreign students in New Zealand. This
 expenditure includes all corresponding taxes and margins.

 3 In its definition, tourism includes usual domestic or international travellers who are holidaying, visiting friends and
 relatives, on business or travelling for educational purposes.

 7
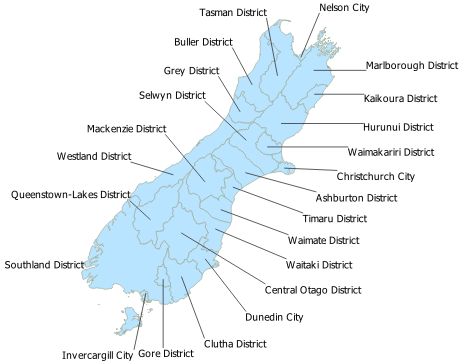
• International flights cover the use of imported and domestically produced air
 transport by New Zealanders travelling abroad.
 Unlike all the other industries in the database, the new tourism industries do not use labour
 and capital directly. Instead, tourism industries purchase goods and services (e.g.
 accommodation, food and beverage, transport) and sell them to foreign and domestic
 visitors. As such, these tourism industries combine goods and services produced by a
 variety of industries so that all tourism expenditure is grouped within these five tourism
 industries.
 We construct data for the costs and sales of the new tourism industries by disaggregating
 the existing TERM-NZ database using information from Stats NZ’s TSA and MBIE’s regional
 tourism estimates.
 We provide further detail on steps undertaken to develop these new industries in Appendix
 B.1 of this paper.

4.4 Bottom-up regional modelling
 Our methodology to extend the database at the regional/district level is based on Wittwer
 and Horridge (2010) and follows a bottom-up approach. In such an approach, each
 region/district is modelled as a separate economy linked by trade of goods and services,
 common but imperfectly mobile factor markets, a common central government and
 exchange rate. The use of a bottom-up framework allows us to estimate variations in both
 quantities and prices at the regional/district levels.
 The TERM-NZ database is based on national input-output tables and has been split so that it
 now contains information for 88 districts (68 territorial authorities and 20 local boards in
 the Auckland region). These districts can easily be aggregated into regions.4
 Similarly to the original TERM model (Wittwer 2012, 2017), we usually run TERM-NZ with
 an aggregated version of the database to speed up the model computation and because it
 would not be technically possible to run the model with such a large database. TERM-NZ
 allows us to estimate the impacts of territorial authorities or local boards (sub-regions) such
 as Queenstown-Lakes and Central Otago in the Otago region or Rotorua and Tauranga in
 the Bay of Plenty.
 Two maps highlighting the different regions, territorial authorities and Auckland local
 boards can be found in Figure 12 and Figure 14, both in Appendix F.
 Appendix B.2 provides further detail on the methodology used to add (sub)regional detail in
 our database.

4
 The 16 regions of New Zealand are defined according to Stats NZ,
 http://archive.stats.govt.nz/browse_for_stats/Maps_and_geography/Geographic-areas.aspx

 8
5 Illustrative simulations on the tourism sector in New Zealand

 We examine the effects of COVID-19 on two major categories of tourism expenditure:
 • Foreign visitors to New-Zealand (excluding foreign students).
 • Domestic travellers.

5.1 Scenario design based on NZIER tourism forecasts
 Each quarter, NZIER publishes its Quarterly Predictions5 for members, which provides 5-
 yearly macroeconomic forecasts for the New Zealand economy. For the June quarter 2020
 forecasting round, NZIER has forecasted the New Zealand tourism expenditure to capture
 the effects of COVID-19.
 NZIER used the following assumptions for its forecasts:
 • International and domestic tourism falls close to zero during the month of Alert Level 4
 (lockdown) due to travel restrictions.6
 • Domestic travel restrictions and isolation measures continue for an additional 3 weeks
 where New Zealand has moved to Alert Level 3.
 • New Zealand moves to Alert Level 2 on 15 May in a phased approach that will unfold
 over 4–6 weeks and to Alert Level 1 by July 2020. We expect domestic tourism to
 resume and grow quickly due to pent-up demand for recreation activities and New
 Zealanders substituting local holidays over foreign holidays. We forecast domestic
 tourism will peak in December 2020 for the holiday period.
 • At the start of July 2020, New Zealand moves to Alert Level 1 and international tourism
 can resume with restriction upon entry (i.e all travellers arriving in the country will
 have to self-isolate for a 2-week period and the number of international flights is
 limited).
 • Australia and New Zealand both have COVID-19 under control and have a joint border
 control at the start of August 2020. This allows for an open border policy between
 both countries. As a result, some domestic tourism is substituted to the newly opened
 Australian market, and Australian tourist expenditure grows.
 Figure 4 presents a visual illustration of the timing we are considering regarding New
 Zealand international and domestic travel restrictions. Our scenarios (phases) are based on
 the assumptions illustrated in this figure. Results of NZIER tourism forecasts can be seen in
 Figure 5.

5 NZIER’s Quarterly Predictions are calculated using a multi-sector macroeconomic model of the New Zealand economy.
 Complementary data analysis is also employed to make professional judgements when macroeconomic conditions have changed
 from trend.
6
 Our assumption takes into account the fact that, since the country has closed its borders, a number of foreigners are still in New
 Zealand, on extended holidays or on temporary work visas, and continue to contribute in tourist expenditure.

 9
Figure 4 Potential timing of lifting New Zealand international and domestic travel
restrictions
Our shocks are annualised

Source: NZIER

Figure 5 NZIER’s monthly tourism forecasts and 12-monthly moving average
(12mma)

Source: NZIER, derived from Stats NZ’s balance of payments and MBIE tourism estimates

 10
To date (15 June 2020), New Zealand Government strategy is to eliminate COVID-19 from
 the country rather than take a herd immunity approach. As such, the country is likely to
 adopt very restrictive measures on inbound and outbound international travel to avoid the
 risk of imported cases that would put the country at risk of an increased spread.
 We designed three scenarios (phases) to explore the potential impacts of COVID-19 on the
 New Zealand economy. These phases are based on the set of measures imposed by the
 New Zealand Government for the different alert levels (1 to 4).7 We mostly focus on
 restrictions applied to the entry and movements of people as well as on labour and capital
 temporarily rendered idle due to the isolation and social distancing measures.
 In all our simulations, we use the static version of TERM-NZ so that we compare the
 economy before and after COVID-19, looking at the impacts of different social and travel
 restriction measures (‘shock’).
 We therefore do not explicitly model the timing of the different restriction measures
 imposed by the New Zealand Government under the different alert levels. There is no time
 dimension in the static model, so we do not look at how the economy adjusts to a new
 equilibrium over time.8
 We also do not take into consideration the economic growth that would have happened
 without COVID-19. Prior to the COVID-19 outbreak, the New Zealand economy had been
 expected to grow by around 2% between 2020 and 2022. This highlights how significant the
 estimated reduction in key macroeconomic metrics are when we compare with the
 counterfactual in which the economy would have grown in the absence of the COVID-19
 pandemic.
 The shock applied disturbs the equilibrium in the economy, and the model calculates
 changes in demand, supply and prices of inputs (like labour and capital). It then reallocates
 them across sectors according to where they get greatest returns, establishing a new
 equilibrium after a policy has been implemented.
 Given the immediate enforcement of a lockdown, travel ban and closure of New Zealand’s
 borders and given the short timeframe the different alert levels will play out, we assume an
 immediate effect on the tourism industries and the New Zealand economy. Therefore, we
 apply a short-term closure for the three phases. See Appendix C for further detail on the
 underlying assumptions of a short-run model closure.
 For each phase, we report results as percentage deviation from the 2019 base case. In
 other words, we measure it as the percentage difference between the state of the New
 Zealand economy pre-COVID (counterfactual) and the situation with theCOVID-19 outbreak
 pandemic and its associated travel restrictions and isolation measures.

 Phase 1: Lockdown and travel ban – year ended June 2020
 We consider the situation of New Zealand during the 5-week period that extended from 25
 March to 26 April 2020 and some relaxation of restrictions under Alert Level 3 in the
 subsequent 2 weeks. Under the lockdown, borders are closed to foreign visitors (inbound
 travel) and New Zealanders are not allowed to travel abroad (outbound travel) and within

7 https://covid19.govt.nz/alert-system/covid-19-alert-system/
8
 These fluctuations may have significant impacts in their own right and could be captured in future research by using our more
 sophisticated dynamic CGE model.

 11
the country (domestic travel). We also assume overall export education decreases by 20%
 under the lockdown period based on figures from Immigration New Zealand.
 The lockdown measures are also likely to impact the labour market as firms in non-essential
 manufacturing and services industries have been forced to shut temporarily. Based on
 NZIER’s Quarterly Predictions June 2020 forecasts, we assume a 7% decrease in the average
 labour demand for 2020.
 To reflect the measures imposed by the lockdown, we take into consideration the fact that
 part of the capital stock in manufacturing, services and construction sectors cannot be used
 under the lockdown. We also impose a change in households’ tastes away from consumer
 goods and services (retail, hotels and restaurants, transport, childcare, sports and
 recreation activities, etc.).
 Finally, recent export figures released by NZ Statistics show that, during the lockdown
 period, there was an increase in export demand (mostly from China) for dairy, fruit, meat
 and seafood products and a decrease in forestry and non-food manufactured goods. We
 include these changes in export demand in our simulations.

 Phase 2: Alert Level 2 – only domestic tourism is allowed (under conditions) – year
 ended June 2021
 In this scenario, New Zealand returns to Alert Level 2 (15 May) then to Alert Level 1 in
 August 2020. We assume that most of the measures for Alert Level 2 will be implemented
 in a staged approach over a few weeks, with most measures becoming less restrictive over
 time.9
 Under Alert Level 2, borders stay closed to foreign visitors, but international students with a
 student visa can travel back to the country. New Zealanders are allowed to travel
 domestically, and more economic activities can resume (restaurants, bars, etc.).
 Additionally, we assume households’ tastes partly move back to consumer goods and
 services as more retail, sports and recreation activities can resume under Alert Level 2.
 We also assume a slight increase of labour demand as some workers on zero-hour contracts
 can go back to work and capital is put back to use with the reopening of most non-essential
 manufacturing and services industries. Capital stays mostly immobilised in air transport as
 Air New Zealand maintains a reduced number of domestic flights.10

 Phase 3: Alert Level 1 – both foreign and domestic tourism are allowed again
 (under conditions) – year ended June 2022
 In this scenario, we consider that New Zealand has fully transitioned to Alert Level 1 (early
 August 2020) and will stay at that level until June 2022.11 Borders are open to foreign
 travellers and students under certain conditions (mandatory self-isolation for a 2-week
 period and access restricted to certain countries). These conditions also apply to New

9 As Alert Level 2 measures are becoming less restrictive over time, there is a possibility of New Zealand moving into Alert Level 1
 during this period. Our forecasts and assumptions take this possibility into account given that our shocks have been annualised and
 as such, include the estimated number of weeks spent under each alert level. See Figure 4 for a visual illustration.
10 https://www.airnewzealand.co.nz/covid19-airnz-updates#flight-changes
11 As Alert Level 1 measures are becoming less restrictive over time, there is a possibility of New Zealand moving into a “Level 0” (close
 to pre-COVID-19 life and with return of international tourism) during this period. Our forecasts and assumptions take this possibility
 into account given that our shocks have been annualised and as such, include the estimated number of weeks spent under each alert
 level. See Figure 4 for a visual illustration.

 12
Zealanders who travel abroad and come back into the country. Domestic tourism is
 allowed, and most economic activities have returned to normal except for air transport.12
 To estimate our shocks, we first calculate forecast tourism spending using seasonally
 adjusted monthly data on tourism. We then calculate the annual percentage change in
 forecast tourism spending compared to June month of the previous year, which allow us to
 take into account the number of weeks we assumed New Zealand stays under each alert
 level (Table 1).
 Table 1 presents our assumptions for domestic and international tourism (outbound and
 inbound) under the three different phases.

 Table 1 Tourism and foreign students forecasts under different scenario
 assumptions13
 Annual percentage change from June month of previous year
 NZers’
 Assumed Foreign
 Phase duration under Period14 International Domestic spending
 students
 each alert level abroad

 Phase 1: Lockdown July 2019 –
 8 weeks -94% -27% -94% -20%
 (YE June 2020) June 2020

 Phase 2: Alert Level 2 July 2020 –
 4 weeks -58% -10% -65% -10%
 (YE June 2021) June 2021

 Phase 3: Alert Level 1 July 2021 –
 40 weeks -30% -11% -40% +2%
 (YE June 2022) June 2022

 Note: each scenario is compared with 2019 baseline)
 Source: Derived from NZIER tourism forecasts for Quarterly Predictions

5.2 Simulation results
 In this section, we present and discuss the results from our simulations to show the
 potential impacts of COVID-19 on the local, regional and national New Zealand economies.
 Results of the simulation help us to understand the importance of the tourism industry in
 New Zealand and to identify the potential risks to a strong downturn of activities mostly
 dedicated to tourism. Results are subject to change as we revise our simulations with latest
 forecasts on the expected impacts of COVID-19 on tourism data.

5.2.1 Macroeconomic impacts of restriction measures from COVID-19 in New Zealand
 Table 2 shows the national impacts of COVID-19 on main economic variables. Real GDP
 decreases by between 7.1% ($21.2 billion) and 2.2% ($6.8 billion) as New Zealand
 transitions through the different alert levels. For all three phases, real GDP loss is

12 Air New Zealand has permanently reduced its fleet on domestic and international flights. https://www.airnewzealand.co.nz/covid19-
 airnz-updates#flight-changes
13 We use a monthly comparison with the same month last year instead of annual data. This is because, if we used annual data, the
 sharp decline in domestic tourism will be hidden in the pre-COVID-19 peak and the recovery once New Zealand moves to Alert Level
 2 or 1.
14 Dates were chosen to see the impact as travel bans and alert level restrictions were implemented.

 13
dominated by labour and capital temporarily not used because of the lockdown measures
and restrictions imposed on international and domestic travel.
We estimate the decrease in real household consumption to be between 13.1% (Phase 1)
and 3.2% (Phase 3). Real household consumption falls by more than the decline in GDP due
to a deterioration in the terms of trade from weaker global demand. Export prices are
falling more than import prices. Hence, exports are becoming cheaper while imports
become relatively more expensive. This leads to a decline in household purchasing power
and hence consumption.
Due to the significant drop in employment and utilised capital, there is no offsetting switch
in sales to exports. At the national level, export volumes fall by between 10.8% (Phase 1)
and 5.6% (Phase 3).

Table 2 Headline economic impacts
Annual changes compared to June 2019 baseline, in percent and in $ million (in real terms)

 Household National
 Phase GDP Exports Imports
 consumption output

 % change -7.1% -13.1% -10.8% -11.6% -8.9%
 Phase 1
 Level ($m) -21,136 -22,032 -9,096 9,616 -50,348

 % change -4.3% -7.5% -7.3% -7.3% -5.5%
 Phase 2
 Level ($m) -12,704 -12,824 -6,145 6,003 -31,388

 % change -2.2% -3.2% -5.6% -4.1% -3.3%
 Phase 3
 Level ($m) -6,759 -5,588 -4,710 3,388 -18,772

Source: NZIER

Figure 6 gives an overview of the recovery trajectory of the national real GDP. It shows that
New Zealand’s GDP has fallen back to a similar level to 2016. In other words, COVID-19 has
removed 3 years of GDP growth. We expect that it will take at least an additional 4 years
until New Zealand’s GDP returns to its pre-COVID level (2019).

 14
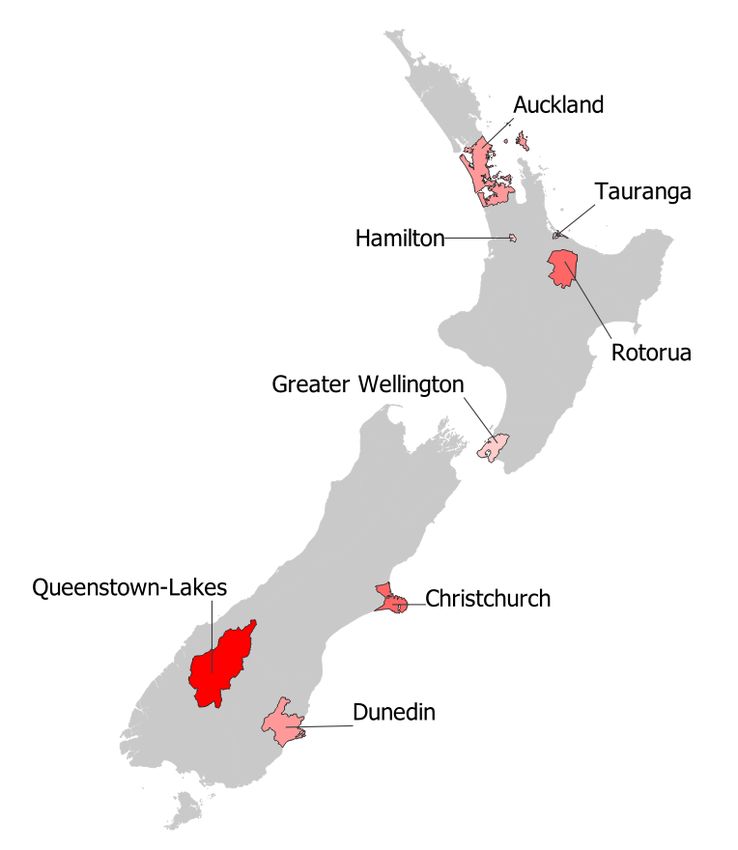
Figure 6 New Zealand’s real GDP recovery path
 Annual changes compared to June 2019 baseline, in $ million (in real terms)

 Source: NZIER

5.2.2 Regional effects
 Table 3 and Figure 7 present the impacts of COVID-19 on regional real GDP for different
 alert levels. Regions for which tourism activities account for a larger share of the regional
 economy are the most affected by COVID-19. This is the case for Queenstown-Lakes,
 Rotorua and Auckland. For all three phases, real GDP loss (in percentage terms) is the
 highest for Queenstown-Lakes, which is highly tourism dependent and therefore
 substantially affected from a downturn in international and domestic tourism. Real GDP
 losses for Hamilton City and Greater Wellington are not as significant as these economies
 are not as reliant on tourism.

 Table 3 Impacts on regional GDP
 Annual changes compared to 2019 baseline, in percentage

 Phase 1 Phase 2 Phase 3
 Region
 (Lockdown) (Alert Level 2) (Alert Level 1)

 Auckland -7.7% -4.6% -2.5%
 Greater Wellington -6.9% -4.1% -2.1%
 Christchurch City -7.8% -4.7% -2.6%
 Queenstown-Lakes -16.7% -10.8% -6.6%
 Hamilton City -6.6% -3.8% -1.8%
 Tauranga -7.1% -4.3% -2.3%
 Rotorua -8.8% -5.5% -3.2%
 Dunedin -7.5% -4.5% -2.4%

 15
Rest of North Island -6.2% -3.6% -1.7%
 Rest of South Island -6.2% -3.7% -1.9%
 New Zealand -7.1% -4.3% -2.2%
Notes:
1 Greater Wellington includes Wellington, Lower Hutt, Upper Hutt and Porirua.
2 Prior to the COVID-19 outbreak, the New Zealand economy had been expected to grow by around 2%
 between 2020 and 2022. This highlights how significant the estimated reduction in key macroeconomic
 metrics are when we compare with the counterfactual in which the economy would have grown in the
 absence of the COVID-19 pandemic.
Source: NZIER

Figure 7 Real GDP decreases the most in tourism-centric regions
Annual changes compared to 2019 baseline, in percentage – Phase 1 (lockdown)

Source: NZIER

Figure 8 shows the recovery path of different regions in terms of real GDP. Under Phase 1
(lockdown in 2020), Queenstown-Lakes’ real GDP falls to 85% of its 2019 level. Under Phase
2 (2021) and Phase 3 (2022), Queenstown-Lakes’ real GDP is slowly recovering but is still at
90% and 94%, respectively of its 2019 level. Rotorua is the second most affected region
from COVID-19 in terms of real GDP, with a drop to 92%, 95% and 97% under Phases 1, 2
and 3, respectively.

 16
Figure 8 Regional real GDP recovery path under the different phases
Annual changes from 2019 baseline, in percentage

Source: NZIER

Regional household spending – our proxy for economic welfare – in dollar value (Table 4
and Figure 9) is expected to decrease the most in Auckland, Greater Wellington and
Christchurch under each phase. This is because household spending is higher in regions that
are more populated and wealthier. Therefore, even a small percentage decrease will have a
larger monetary impact than less-populated and less-wealthy regions.
The decrease in regional household spending share is the most significant in regions whose
economy is more reliant on tourism activities such as Queenstown-Lakes, Auckland,
Christchurch and Rotorua.

Table 4 Impacts on regional real household spending
Annual changes compared to 2019 baseline, in percentage

 Phase 1 Phase 2 Phase 3
 Region (TLA)
 (Lockdown) (Alert Level 2) (Alert Level 1)

 Auckland -14.0% -8.2% -3.7%
 Greater Wellington -12.5% -7.2% -3.1%
 Christchurch City -13.7% -8.0% -3.5%
 Queenstown-Lakes -28.2% -18.4% -10.7%
 Hamilton City -12.5% -7.1% -3.1%
 Tauranga -12.8% -7.4% -3.3%
 Rotorua -13.5% -7.8% -3.4%
 Dunedin -13.1% -7.7% -3.5%
 Rest of North Island -11.9% -6.6% -2.6%
 Rest of South Island -11.9% -6.6% -2.6%
 New Zealand -13.1% -7.5% -3.2%
Note: Greater Wellington includes Wellington, Lower Hutt, Upper Hutt and Porirua.
Source: NZIER

 17
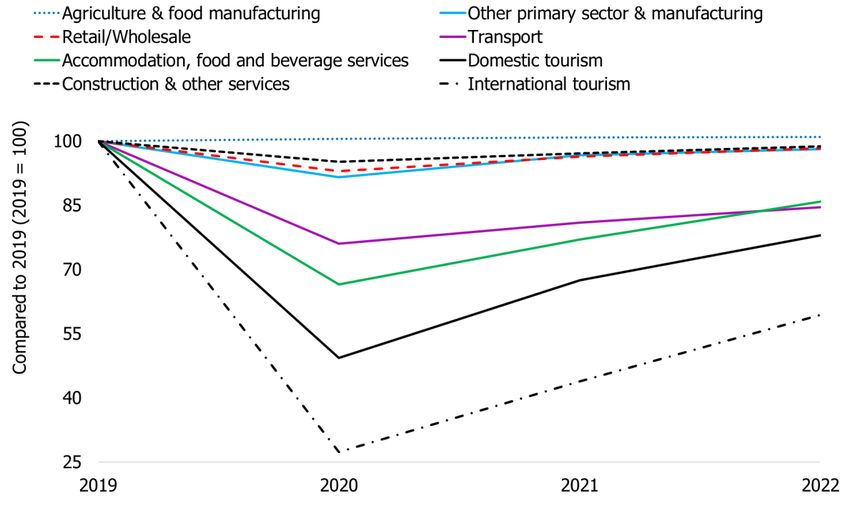
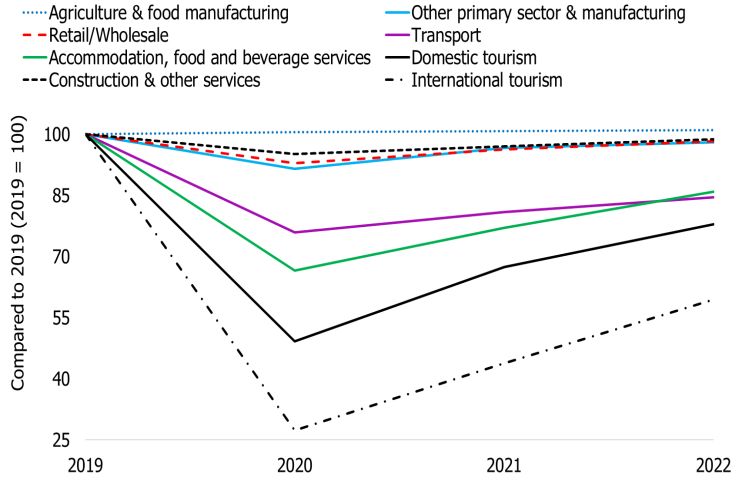
Figure 9 Real household spending decreases the most in tourism-centric regions
 Annual changes compared to 2019 baseline, in percentage – Phase 1 (lockdown)

 Source: NZIER

5.2.3 Impacts on sector activities
 Figure 10 presents the changes in aggregated industries compared with the 2019 baseline
 under each phase.
 The tourism sector (domestic and foreign tourism) is the most affected by COVID-19 and
 restriction measures. It is also the sector that is likely to take longer to recover compared
 with other sectors.
 With COVID-19, international tourism output falls to 27% of its 2019 level and slowly
 recovers over time to reach 59% of its 2019 level in 2022 (Phase 3). Domestic tourism
 output falls to 49% of its 2019 level in 2020 (Phase 1) and reaches 78% of its 2019 base in
 2022 (Phase 3). Domestic tourism is expected to recover relatively quickly, with public
 campaigns playing a role in restoring regional demand. The impact on international tourism
 may last much longer given that border restrictions are expected to last until 2022.
 Industries that support the tourism sector, such as accommodation, food and beverage
 services and transport (mostly air transport) industries, are also significantly hit by the
 isolation measures and travel ban, with output for each of these industries dropping to 66%
 and 76% respectively of their 2019 base.
 Output decreases less sharply in industries that are not directly reliant on the tourism
 sector (e.g. other primary sector and manufacturing, construction and other services). The
 output decrease in these industries is due to the decrease in available labour and capital
 immobilised by the implementation of restriction measures. There are also some

 18
substitution effects at play. With the decrease in expenditure towards visitor economic
 activity, households might allocate a larger portion of their budgets to other industries such
 as health and education (included in construction and other services).
 With a weakening demand for tourism, the exchange rate goes down. This leads to a
 demand increase for other export commodities such as dairy, meat and fruit products,
 which in turns leads to a slight increase in output for agriculture and food manufacturing
 products relative to the 2019 baseline.

 Figure 10 Sector impacts under the different phases at the national level15
 Annual changes from 2019 baseline, in percentage

 Source: NZIER

15
 For simplification purposes, we have combined industries that have a similar recovery path such as agriculture and food
 manufacturing, construction and other services, other primary sector and manufacturing industries.

 19
6 Discussion on assumptions and policy implications

 At the national level, restriction measures and the travel ban due to COVID-19 led to
 substantial real GDP loss (between $21 billion and $6.8 billion between Phase 1 and Phase
 3, respectively). For all three phases, the fall in real GDP is dominated by labour and capital
 temporarily not used because of the social and travel restriction measures imposed in the
 country. The decrease in domestic and foreign tourism is also expected to have a significant
 impact on regional economies, especially those for which tourism activities represent a
 larger share of the regional economy, such as Queenstown-Lakes, Christchurch, Auckland
 and Rotorua.
 Domestic tourism has the potential to partially mitigate the negative impacts of COVID-19
 on foreign tourism in New Zealand. Further research is needed to estimate the extent to
 which expenditure in both inter-region/district and intra-region/district tourism represent a
 substitution from foreign travellers’ expenses foregone.
 There is considerable uncertainty about the severity of the potential economic impacts of
 COVID-19. We attempted to explore some of these uncertainties through the design of
 modelling scenarios (phases). The magnitude of these impacts is highly dependent on the
 assumptions made regarding the duration of travel ban and restriction measures and their
 likely effects on labour, capital or household demand for consumer goods and services.
 Most of our assumptions are derived from NZIER’s Quarterly Predictions. We are mindful
 that our assumptions are based on data that was available at the moment we wrote this
 paper and that the situation is evolving rapidly. This means that assumptions made at the
 time this paper was written might need to be updated as more timely information comes to
 hand.
 We use the static version of our regional CGE model, TERM-NZ, which looks at ‘before’ (i.e.
 pre-COVID-19) and ‘after’ (with different COVID-19 alert levels). We therefore do not
 explicitly model the timing of the different restriction measures imposed by the New
 Zealand Government under the different alert levels.
 Additionally, and given the information available at the time this paper was written (June
 15 202), we have not explicitly modelled labour productivity loss resulting from social
 distancing measures in essential industries as its importance is still uncertain. However,
 labour productivity loss has been taken into account in NZIER’s labour forecasts and hence
 in our assumptions as well.
 We also assume no fiscal response by government outside wage subsidies, which are
 implicitly included in NZIER’s labour forecasts. Therefore, public consumption follows the
 decrease in household consumption (in nominal terms). While the New Zealand
 Government has recently announced a substantial COVID-19 economic response package,
 we decided to not explicitly model any fiscal response in order to showcase the base
 against which fiscal policies can be assessed.
 Budget 2020 included a $50 billion COVID-19 Response and Recovery Fund (CRRF),
 including the Wage Subsidy Scheme and Business Tax Relief Package aimed at supporting
 businesses to keep workers in their jobs.
 The Reserve Bank has also stepped in to support the recovery. In addition to the emergency
 75 basis points official cash rate (OCR) cut undertaken on 16 March 2020, the RBNZ has

 20
You can also read