THE PROJECTED ECONOMIC IMPACT OF COVID-19 ON THE UK CREATIVE INDUSTRIES - 15 June 2020
←
→
Page content transcription
If your browser does not render page correctly, please read the page content below
THE PROJECTED ECONOMIC IMPACT OF COVID-19
ON THE UK CREATIVE INDUSTRIES

                                  15 June 2020
EXECUTIVE SUMMARY
SCOPE
HISTORICAL DATA
NO-COVID PROJECTIONS
METHODOLOGY
COVID PROJECTIONS
SEGMENT-SPECIFIC RESULTS
EXECUTIVE SUMMARY

The impact of Covid-19 on the UK creative industries
•   The Creative Industries (CIs) are projecting a combined £74bn turnover
    loss over the course of 2020 compared to 2019 (-30%). This is expected
    to translate into a GVA shortfall of £29bn in 2020 compared to 2019 (-
    25%), over half of which is in London.
•   The greatest turnover drop is expected to be experienced in Q2, but
    current projections suggest very modest improvements over Q3 and Q4
    across the CIs.
•   In 2020, CIs are projecting a 119,000 drop in employment among
    employees (despite the Coronavirus Job Retention Scheme—JRS) and a
    further 287,000 job losses among self-employed workers, compared to
    2019 levels. In total, 406,000 CIs jobs are considered at risk, 27% of
    which are in London and 20% are in the South East.
•   The greatest employment drop is expected in Q1 for self-employed, and
    Q2 for employees. This is because contract workers, freelancers, and the
    self-employed appear to have seen an immediate impact in March, while
    companies are expected to consider redundancies starting in Q2.        3
EXECUTIVE SUMMARY
SCOPE
HISTORICAL DATA
NO-COVID PROJECTIONS
METHODOLOGY
COVID PROJECTIONS
SEGMENT-SPECIFIC RESULTS

SCOPE OF THIS STUDY

The impact of Covid-19 on the UK creative industries
Along with the tourism sector, creative industries (CI) are among the
most affected by the current Covid-19 crisis. Creative workers–one of the
more vulnerable sectors of the workforce–are already seeing devastating
impacts on their income, not only in turnover terms, but also in their
charitable contributions and sponsorships. Leaving behind the more fragile
part of the sector could cause irreparable socio-economic damage.
This report explores the short-term effects of Covid-19 on the financial
sustainability of the creative industries. It is structured as follows:
• We first introduce the UK creative industries using DCMS and trade
   bodies’ data to illustrate recent developments in the sector until 2019*;
• We then employ Oxford Economics’ forecasts to estimate the size of the
   industry at different points in 2020, in a scenario without Covid-19.
• Lastly, we use responses from CIF and a variety of organisations’
   surveys to understand the impact of the Covid-19 crisis on the creative
   industries.
*Employment data were available out to 2019, while GVA was estimated following year-on-year employment growth between5
2018 and 2019.
EXECUTIVE SUMMARY
SCOPE
HISTORICAL DATA
NO-COVID PROJECTIONS
METHODOLOGY
COVID PROJECTIONS
SEGMENT-SPECIFIC RESULTS
CREATIVE GROSS VALUE ADDED

Creative industries directly contribute to UK GVA…
Creative industries contributed £111.7bn to the UK economy in 2018, a
43.2% increase in real terms since 2010. Between 2017 and 2018, the CI
GVA grew by 7.4% in real terms, which is more than five times the growth
rate of the UK economy as a whole (1.4% increase).
       £m                          GVA of creative industries
  120,000
                                                               Advertising and marketing

  100,000                                                      Architecture

                                                               Crafts
   80,000                                                                                                  Creative
                                                               Design and designer fashion              industries’ GVA
   60,000                                                      Film, TV, video, radio and photography    accounted for
                                                               IT, software and computer services
                                                                                                          5.8% of UK
   40,000                                                                                                 GVA in 2018
                                                               Publishing
   20,000                                                      Museums, galleries and libraries

                                                               Music, performing and visual arts
         0
                2010 2011 2012 2013 2014 2015 2016 2017 2018
Source: DCMS.
                                                                                                                      7
CREATIVE EMPLOYMENT
…while providing significant numbers of jobs…
Creative Industries employed 2.10 million people in 2019, an increase of
34.5% from 2011. This is more than three times the growth rate of
employment in the UK overall (11.4%), reflecting the growing economic
importance of the sector.
000 jobs
Jobs at Creative Industries
2,500
Advertising and marketing
Architecture
2,000
Crafts
Creative
1,500 Design and designer fashion industries’
Film, TV, video, radio and photography employment
1,000 accounted for
IT, software and computer services
6.3% of UK
500 Publishing jobs in 2019
Museums, Galleries and Libraries
0
2011 2012 2013 2014 2015 2016 2017 2018 2019 Music, performing and visual arts
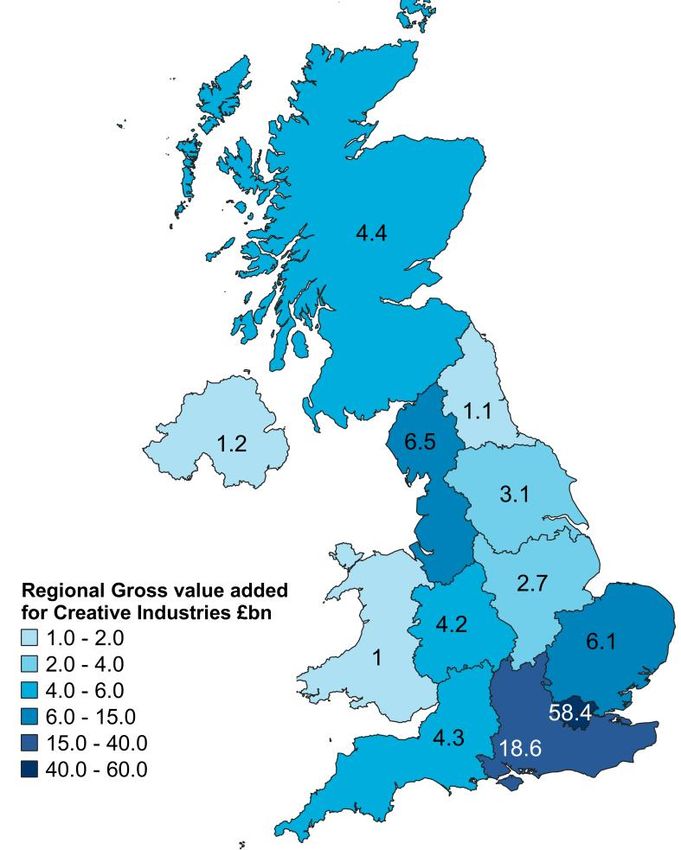
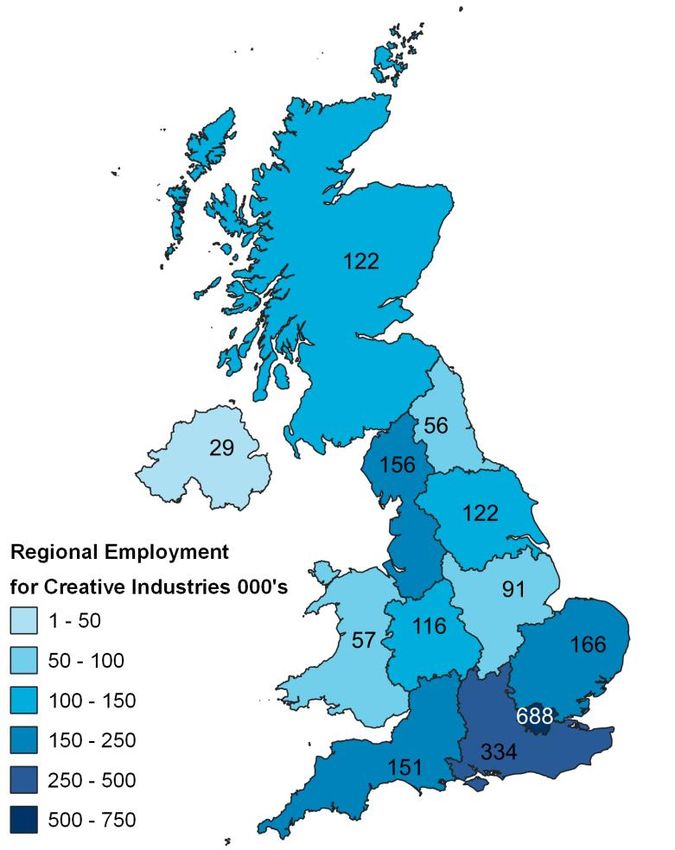
Source: DCMS 8REGIONAL PICTURE …across all UK nations and regions Note: employment data refer to 2019, while GVA data refer to 2018. 9
EXECUTIVE SUMMARY
SCOPE
HISTORICAL DATA
NO-COVID PROJECTIONS
METHODOLOGY
COVID PROJECTIONS
SEGMENT-SPECIFIC RESULTS
CREATIVE GVA: 2019-20 WITHOUT COVID-19

Before Covid-19, CI GVA was expected to grow…
Oxford Economics’ Global Industry Model was used to produce GVA growth
projections for the creative sector beyond 2019. The quarterly GVA figures
for 2020 were annualised to allow comparability with previous years’ data.
This study refers to calendar year 2020, as opposed to financial year 2020.
£m, annualised                    CI GVA, no-Covid projections
 140,000

 120,000                                                                                              We project CI
 100,000
                                                                                                       GVA would
                                                                                                      have reached
  80,000                                                                                             £114bn in 2019
                                                                                                     and £122bn* by
  60,000
                                                                                                     the end of 2020
  40,000                                                                                              in a no-Covid
                                                                                                         scenario
  20,000

      0
       2011      2012   2013   2014   2015   2016   2017   2018   2019   2020   2020   2020   2020
                                                                          Q1     Q2     Q3     Q4
* This is equivalent to £120bn over the course of 2020, which is in line with predictions of the University for the   11
Creative Arts, which also project a £120bn GVA contribution in 2020.
CREATIVE JOBS: 2019-20 WITHOUT COVID-19
…and so was CI employment
Creative Industries jobs were expected to grow, but at a slower pace, over
the course of 2020 in a no-Covid counterfactual scenario.
Number CI employment, no-Covid projections
2,500,000
Series1
2,000,000
We project CI
1,500,000 employment
would have
1,000,000 reached 2.15m
by the end of
500,000 2020 in a no-
Covid scenario
0
2011 2012 2013 2014 2015 2016 2017 2018 2019 2020 2020 2020 2020
Q1 Q2 Q3 Q4
Source: DCMS, Oxford Economics
12EXECUTIVE SUMMARY SCOPE HISTORICAL DATA NO-COVID PROJECTIONS METHODOLOGY COVID PROJECTIONS SEGMENT-SPECIFIC RESULTS
ASSUMPTIONS OF THE COVID SCENARIO (I)

CI are heavily affected by the Covid-19 crisis
CIF ran a survey of its members between 27 March-6 April 2020, which
collated evidence on current and projected losses of the industry over the
course of 2020. The survey was completed by over 2,000 creative
organisations and freelancers. We have employed the following questions to
determine impacts:
Survey question:                                                               Used to estimate:            For time
                                                                                                            period:
How many employees have you had to make redundant?                             Employed job losses          2020Q1
What percentage of your active freelance contracts (if                         Self-employed job            2020Q1
applicable) have you had to terminate?*                                        losses
Due to the Coronavirus outbreak […] do you estimate your                       Turnover loss (and           2020Q1
monthly turnover/income has:                                                   GVA in turn)
How many employees do you anticipate having to furlough?                       Employed job losses          2020Q2

During 2020, due to the Coronavirus outbreak […] do you                        Turnover loss (and           2020
predict your annual turnover/income (excluding grants) will:                   GVA in turn)                 average
* In this work, we follow CIF’s definition for ‘freelancers’ as people who are self-employed, including sole traders. We
acknowledge that freelancers may be involved in multiple contracts at once, so this assessment focuses on the number of
jobs at risk, rather than the number of people at risk of losing their jobs.                                             14
ASSUMPTIONS OF THE COVID SCENARIO (II)
How we used the CIF survey
Turnover: predictions on annual turnover losses by segment were the key
input into our models and determined the 2020 headline results. The
quarterly profile was estimated combining the survey response to the
monthly income question (used to inform Q1 results), and OE’s quarter-on-
quarter projections for the remaining quarters. Those two sources were
constrained by the 2020 overall turnover projection results.
Employment: the questions on existing redundancies and freelance
contract cancellations directly informed our employment estimates for Q1.
The key assumption is that, absent of any government scheme, employment
would fall in a similar fashion to turnover. However, the furlough scheme
enables employers to retain some workers and this is why our employment
projections are less negative than our turnover projections. We rely on the
question about furloughed employees to estimate the projected adoption of
the scheme. Quarter-on-quarter employment projections are drawn from
Oxford Economics’ forecasts.
Note: our estimates make no assumptions on what may happen after the furlough scheme closes.
15ASSUMPTIONS OF THE COVID SCENARIO (III)
A note on OE’s industry models
OE is highly experienced at forecasting industry outlooks. Our econometric models are
characterised by a top-down structure: sector forecasts are driven by national and trade-weighted
global macroeconomic demand (consumer spending, investment, exports, government spending).
In our baseline scenario, the economy grows at its weakest pace since the global financial crisis,
before strengthening as coronavirus-related disruption fades.
The available Q1 GDP data show that the economy
was already slowing sharply before the peak global
lockdown was reached in April, partly reflecting shifting
consumer behaviour prior to full lockdowns coming
into force. And in April, a number of key surveys have
plumbed new lows, suggesting that the downturn
worsened in early-Q2 as lockdowns tightened.
We still expect a solid growth bounce in H2 as
lockdown restrictions are gradually unwound, but
consumer services involving social contact (such as
those offered by the CI) will face a much slower
recovery than other sectors that can more easily
accommodate social distancing.
16ASSUMPTIONS OF THE COVID SCENARIO (IV)
This study takes a bottom up approach
The CIF survey constituted our main data source for creative segments’
projections. However, the below organisations were also able to provide
useful insight from their own survey data.
Additional survey sources: Segment
Arts Council England Museums, galleries and libraries
Advertising Association Advertising and market research
Society of London Theatre - UK Theatre Theatre (included in music,
performing and visual arts)
Radiocentre Radio
UK Screen Alliance Post-production and VFX
RIBA Architecture
AudioUK Audio
17SCOPE HISTORICAL DATA NO-COVID PROJECTIONS METHODOLOGY COVID PROJECTIONS SEGMENT-SPECIFIC RESULTS
PROJECTED INCOME LOSSES FROM CIF
                                                                             SURVEY

   A sudden and massive turnover loss…
   38% of respondents predict an annual income fall of over 75% in 2020
   (compared to 2019), and 73% predict a fall in annual turnover of more than
   50% (left hand side chart). Among self-employed, 42% expect a 75%+ loss
   and 78% a 50%+ loss (right hand side chart).
   Number of
               Projected 2020 turnover change                    Number of     Projected 2020 turnover change
   responses                                                     responses
                        from last year                                          from last year, self-employed
   800                                                           600

   700
                                                                 500
   600
                                                                 400
   500

   400                                                           300

   300
                                                                 200
   200
                                                                 100
   100

     0                                                              0
         Increase   Remain Decrease Decrease Decrease Decrease          Increase Remain Decrease Decrease Decrease Decrease
Updated              stable by up to by 26-   by 51- by more                      stable by up to by 26-   by 51- by more
                             25%      50%      75%    than 76%                            25%      50%      75% than 76%
                Source: CIF. N=2,021                             Source: CIF. N=1,291                                    19
CREATIVE GVA: 2019-20 WITH COVID-19
…implies a drop in CI GVA in the Covid-19 scenario…
• The Creative Industries are projecting a combined £74bn turnover loss
over the course of 2020 compared to 2019 (-30%). This is expected to
translate into a GVA shortfall of £29bn in 2020 compared to 2019 (-25%).
• The greatest drop is expected to be experienced in Q2, but current
projections suggest very modest improvements over Q3 and Q4 across
the CIs.
£m, annualised GVA
£m, annualised Turnover
140,000
300,000
120,000
250,000
100,000
200,000
80,000
150,000
60,000
100,000
40,000
50,000 20,000
0 0
2018 2019 2020 Q1 2020 Q2 2020 Q3 2020 Q4 2018 2019 2020 Q1 2020 Q2 2020 Q3 2020 Q4
Source: Oxford Economics
20CREATIVE GVA: 2019-20 WITH COVID-19
…with losses felt particularly in Greater London…
• Of the GVA shortfall of £29 billion, the majority is projected to take place
in London (51%), with a £14.6 billion CI GVA drop.*
• The second most affected region is the South East, expecting a £4.7
billion GVA decline, followed by the East of England and Scotland, with
projected creative GVA losses of £1.9 and £1.7 billion, respectively.
GVA at risk by region, £million
London -14,600
South East -4,700
East of England -1,900
Scotland -1,700
North West -1,400
West Midlands -1,400
South West -1,300
East Midlands -800
North East -400
Northern Ireland -300
Wales -100
Yorkshire -100
-17,000 -15,000 -13,000 -11,000 -9,000 -7,000 -5,000 -3,000 -1,000
Source: Oxford Economics, CIF, DCMS
* All regional results are based on results from the CIF survey, combined with DCMS regional creative statistics. The survey
had at least 30 responses for each region. Sample sizes were: London 868; South East 237; South West 186; North West
170; West Midlands 119; Scotland 102; Yorkshire 96; Wales 61; East Midlands 49; East of England 43; Northern Ireland 37;
North East 34. 21CREATIVE GVA: 2019-20 WITH COVID-19
…with Scotland being the hardest hit in relative terms
• Relative to the size of the CI in 2019, Scotland is the hardest hit, with a
projected 39% drop in creative GVA in 2020. Scottish respondents were
the most pessimistic about the 2020 outlook from the CIF survey. North
East follows as the second most affected region in relative terms.
• Yorkshire & the Humber is the least impacted region, expecting a 3%
GVA fall over the course of 2020, as compared to 2019. These GVA
results are based on turnover projections from the CIF survey.
GVA at risk by region, % change from 2019
London -25%
South East -25%
East of England -31%
Scotland -39%
North West -21%
West Midlands -32%
South West -29%
East Midlands -31%
North East -37%
Northern Ireland -23%
Wales -10%
Yorkshire -3%
-45% -40% -35% -30% -25% -20% -15% -10% -5% 0%
22
Source: Oxford Economics, CIF, DCMSJOB LOSSES FROM CIF SURVEY (I)
A significant share of CI jobs have already been lost…
The impact on jobs has already kicked in. As of the end of March, 13% of
respondents had made some employees redundant. However, the greatest
impact to date has been felt by freelance workers; more than one in three
respondents reported having had all their freelance contracts terminated by
Q1 2020. 46% had experienced half of their freelance contracts terminated.
Number of Number
Employees made redundant as of Q1 2020 of
Freelance contracts terminated as of Q1 2020
responses
1,400 response
800
s
1,200 700
1,000 600
500
800
400
600
300
400
200
200 100
0 0
0% 1-10% 11-25% 26-50% 51-75% 76-99% 100% Blank 0% 1-10% 11-25% 26-50% 51-75% 76-99% 100% Blank
Source: Cif. N=2,021 Source: CIF. N=2,021
23JOB LOSSES FROM CIF SURVEY (II)
…and more are expected to be lost…
Some 33% of the respondents expect having to furlough a portion of their
workforce. However, in some cases furloughing workers will not be sufficient
to make up for the turnover losses, implying more staff are expected to be
made redundant.
Number of responses
Projected furloughed employees
800
700
600
500
400
300
200
100
0
0% 1-10% 11-25% 26-50% 51-75% 76-99% 100% Blank
Updated Source: CIF. N=2,021
24CREATIVE JOBS: 2019-20 WITH COVID-19
…resulting in a 406,000 CI employment drop over 2020
• In 2020, the CIs project a 119k drop in employment among employees
(despite the Coronavirus JRS) and 287k job losses among the self-
employed, compared to 2019 employment levels.
• The greatest drop is expected in Q1 for self-employed, and Q2 for
employees. This is because contract workers, freelancers, and the self-
employed appear to have seen an immediate impact already in March,
while companies are expected to consider redundancies starting in Q2.
• Assuming constant average company size, the number of creative
businesses could fall from 296k in 2019 to 280k in 2020.
Number Employees Number Self-employed
1,600,000 800,000
1,400,000 700,000
1,200,000 600,000
1,000,000 500,000
800,000 400,000
600,000 300,000
400,000 200,000
200,000 100,000
0 0
2018 2019 2020 Q1 2020 Q2 2020 Q3 2020 Q4 2018 2019 2020 Q1 2020 Q2 2020 Q3 2020 Q4
25CREATIVE JOBS: 2019-20 WITH COVID-19
…with major job losses in London & the South East…
Across the UK, the CIs are projecting a 406,000 (19%) drop in employment.
27% of this, or 109,800 jobs, are expected to be in London, followed by the
South East with 81,800 and the West Midlands with 50,600 jobs at risk.
Regions including the East Midlands, the North East, Scotland and Yorkshire
& the Humber are making substantial use of the furlough scheme and are
therefore expecting fewer redundancies. These regions, however, will likely
be the hardest hit once the JRS is withdrawn.
Jobs at risk by region
London -109,800
South East -81,800
West Midlands -50,600
North West -47,600
South West -43,100
East of England -42,200
Wales -14,900
Scotland -6,900
Northern Ireland -6,000
North East -1,800
East Midlands -1,300
Yorkshire 0
Updated -140,000 -120,000 -100,000 -80,000 -60,000 -40,000 -20,000 0
Source: Oxford Economics, CIF, DCMS 26
Figures may not add due to roundingCREATIVE JOBS: 2019-20 WITH COVID-19
…and West Midlands as the hardest hit in relative terms
• Relative to the size of the CI in 2019, the West Midlands is the hardest hit
in employment terms, with a projected 43% drop in creative jobs in 2020.
In this region, we find the lowest recorded JRS uptake across the UK.
• Yorkshire is the least impacted region, expecting no employment fall in
2020, as compared to 2019. East Midlands follows as the second least
affected region, with a 1% CI jobs fall.
Jobs at risk by region, % change from 2019
London -16%
South East -24%
West Midlands -43%
North West -30%
South West -28%
East of England -25%
Wales -26%
Scotland -6%
Northern Ireland -20%
North East -3%
East Midlands -1%
Yorkshire 0%
-50% -40% -30% -20% -10% 0%
Source: Oxford Economics, CIF, DCMS
27EXECUTIVE SUMMARY SCOPE HISTORICAL DATA NO-COVID PROJECTIONS METHODOLOGY COVID PROJECTIONS SEGMENT-SPECIFIC RESULTS
Updated                        1. FILM, TV, VIDEO, RADIO AND
                                                                                                  PHOTOGRAPHY

In 2020, the industry might lose £36bn in turnover compared to 2019 (-57%)

 Number                           Employees                            Number                     Self-employed
 160,000                                                               120,000

 140,000
                                                                       100,000
 120,000
                                                                        80,000
 100,000

  80,000                                                                60,000

  60,000
                                                                        40,000
  40,000
                                                                        20,000
  20,000

        0                                                                    0
         2018           2019   2020 Q1   2020 Q2   2020 Q3   2020 Q4          2018        2019    2020 Q1     2020 Q2       2020 Q3    2020 Q4
 £m, annualised                     Turnover                             £m, annualised                     GVA
 80,000                                                                  25,000

 70,000
                                                                         20,000
 60,000

 50,000                                                                  15,000
 40,000
                                                                         10,000
 30,000

 20,000
                                                                          5,000
 10,000

       0                                                                         0
        2018           2019    2020 Q1   2020 Q2   2020 Q3   2020 Q4              2018     2019    2020 Q1        2020 Q2    2020 Q3     2020 Q4
 Source: Oxford Economics

  The BFI reported last month that 65% of film and high-end TV production had to be put on hold during the shutdown,
                                                                                                                    29
   though film and TV production is now restarting following the introduction of extensive social distancing guidance.
1.1 IN-DEPTH: POST-PRODUCTION AND VFX
In 2020, the sector might lose £827m in turnover compared to 2019 (-58%)
• The post-production industry employed some 13,000 people and
generated a £1.3 billion turnover in 2018 (according to ONS’ Annual
Business Survey). The employment figure excludes self-employed.
• Using early survey results produced by the UK Screen Alliance, we
estimate that the industry’s turnover could drop to £591 million in 2020
(equivalent to a seven month-long turnover hiatus).
£ million, annualised
Turnover Animation, while included within the
1,800
ONS post-production definition, has
1,600
had much more positive outcomes so
1,400
far through a smoother transition to
1,200
home-working. However, in the longer-
1,000
term, the sector may experience
800
difficulties with reduced commissions,
600
both in the UK and globally. The
400 industry has also experienced some
200 costs and delays with the transition to
0 home working.
Updated 2018 2019 2020 Q1 2020 Q2 2020 Q3 2020 Q4
Source: UK Screen Alliance, Oxford Economics
301.2 IN-DEPTH: RADIO
In 2020, the sector might lose £186m in turnover compared to 2019 (-21%)
• The radio broadcasting industry employed some 29,000 people and
generated a £890 million turnover in 2018 (according to ONS’ Annual
Business Survey). The employment figure excludes self-employed.
• Using a combination of CIF, Radiocentre, and WARC data, we estimate
that the industry’s turnover could drop to £691 million in 2020 as a result
of the collapse in advertising turnover, particularly in Q2, and
employment could be as low as 28,000 as a result of Covid-19.*
£ million 000 jobs
Turnover Employment
1,200 35
1,000 30
25
800
20
600
15
400
10
200 5
0 0
2018 2019 2020 Q1 2020 Q2 2020 Q3 2020 Q4 2018 2019 2020 Q1 2020 Q2 2020 Q3 2020 Q4
New
Source: Radiocentre, WARC, Oxford Economics Source: Radiocentre, Oxford Economics
*WARC data suggests an uptick in radio ad revenues in Q3 and Q4, which drives our turnover outlook.
311.3 AUDIO
72% of audio firms have seen a business reduction
• The UK audio production sector is comprised of SMEs making radio
programmes, podcasts, audiobooks, as well as a range of other content.
• A survey by AudioUK carried out between 12-24 April found that 72% of
the respondents had seen a reduction in their business, with around half
of those (34% of the total) saying the reduction had been large.
• The AudioUK survey estimates some 25% of freelancers have had
current working arrangements suspended or cancelled. Around 4% of
PAYE staff are on furlough, although most respondents to this question
had 5 or fewer employees pre-Covid.
• Overall AudioUK’s understanding is that a fair proportion of radio/audio
production has continued, albeit with some disruption and additional
expense. However companies covering areas like sports and live musical
events have been disproportionately affected. There is also concern that
postponed commissioning processes by broadcasters and others could
New cause difficulty later on in Q4 2020 and Q1 2021.
322. MUSIC, PERFORMING AND VISUAL ARTS
Updated
In 2020, the industry might lose £11bn in turnover compared to 2019 (-54%)
Number Employees Number Self-employed
100,000 250,000
90,000
80,000 200,000
70,000
60,000 150,000
50,000
40,000 100,000
30,000
20,000 50,000
10,000
0 0
2018 2019 2020 Q1 2020 Q2 2020 Q3 2020 Q4 2018 2019 2020 Q1 2020 Q2 2020 Q3 2020 Q4
£m, annualised Turnover £m, annualised GVA
25,000 12,000
10,000
20,000
8,000
15,000
6,000
10,000
4,000
5,000
2,000
0 0
2018 2019 2020 Q1 2020 Q2 2020 Q3 2020 Q4 2018 2019 2020 Q1 2020 Q2 2020 Q3 2020 Q4
Source: Oxford Economics
332.1 IN-DEPTH: MUSIC (UK MUSIC DEFINITION)
In 2020, the industry might lose at least $3bn in GVA, compared to 2019
• In 2018, UK Music estimates the music sector produced some £5.2 billion in GVA
and created nearly 191,000 FTE jobs. Music creators represent almost half of the
UK music industry GVA contribution and almost ¾ of the industry’s FTE jobs. The
vast majority of music creators are self-employed.
• Using CIF survey results, we estimate GVA could drop by at least £3bn in 2020,
and employment to be as low as 77,000 FTE as a result of Covid-19.
• The collapse in live music and touring is the single largest factor contributing to
this decline, with live music effectively decimated across the whole of 2020. It is
anticipated that recovery will take at least 3-4 years to get back to 2019 levels of
business.
• Recording studios, physical retail, performance income from shops, restaurants
etc have also collapsed, with the prospects for recovery still very uncertain.
• Longer term consequences are harder to predict across the music industry as a
whole, but disruption to recording and promotion, depleted cash reserves,
especially for SMEs, and delays in investment decisions will leave gaps in release
schedules, directly impacting rights-based revenues further down the line.
342.2 IN-DEPTH: THEATRE
In 2020, the industry might lose £3bn in turnover compared to 2019 (-61%)
• The performing arts sector (incl. live theatrical presentations) employed
46,000 people and generated a £5.1 bn turnover in 2018 (ONS).*
• Using SOLT data, we estimate that the industry’s turnover could drop to
£2.0 billion over 2020 as a result of cancelled performances, and
employment could be as low as 35,000 as a result of Covid-19.* This
estimate only takes into account current cancellations and does not
account for the reluctance of audiences to return to venues (only 20%
would return on opening night according to a survey by Indigo)
£ million, annualised Turnover 000 jobs Employment
6,000 50
45
5,000
40
4,000 35
30
3,000 25
20
2,000
15
1,000 10
5
0 0
2018 2019 2020 Q1 2020 Q2 2020 Q3 2020 Q4 2018 2019 2020 Q1 2020 Q2 2020 Q3 2020 Q4
Source: SOLT, Oxford Economics
* This employment figure does not include self-employed and freelancers. 353. CRAFTS
In 2020, the sector might lose £513m in turnover compared to 2019 (-53%)
Number Employees Number Self-employed
7,000 4,500
4,000
6,000
3,500
5,000
3,000
4,000 2,500
3,000 2,000
1,500
2,000
1,000
1,000 500
0 0
2018 2019 2020 Q1 2020 Q2 2020 Q3 2020 Q4 2018 2019 2020 Q1 2020 Q2 2020 Q3 2020 Q4
£m, annualised Turnover £m, annualised GVA
1,200 400
350
1,000
300
800
250
600 200
150
400
100
200
50
0 0
2018 2019 2020 Q1 2020 Q2 2020 Q3 2020 Q4 2018 2019 2020 Q1 2020 Q2 2020 Q3 2020 Q4
New
Source: Oxford Economics
363.1 IN-DEPTH: CRAFTS ECONOMY
In 2020, the sector might lose 58,000 jobs compared to 2019 (-47%)
• In 2017, the Crafts Council estimates some 129,000 people were
employed in crafts occupations across the creative economy, 77,000 of
which were employed and 52,000 of which were self-employed.
• Using CIF survey results for craft companies, we estimate that
employment in craft occupations could be as low as 65,000 as a result of
Covid-19 during 2020, including both employees and self-employed.
Jobs Jobs
80,000 Employees 60,000 Self-employed
70,000
50,000
60,000
50,000 40,000
40,000 30,000
30,000
20,000
20,000
10,000 10,000
0 0
2018 2019 2020 Q1 2020 Q2 2020 Q3 2020 Q4 2018 2019 2020 Q1 2020 Q2 2020 Q3 2020 Q4
Source: Crafts Council, Oxford Economics
New
374. DESIGN AND DESIGNER FASHION
Updated
In 2020, the sector might lose £2bn in turnover compared to 2019 (-58%)
Number Employees Number Self-employed
80,000 120,000
70,000
100,000
60,000
80,000
50,000
40,000 60,000
30,000
40,000
20,000
20,000
10,000
0 0
2018 2019 2020 Q1 2020 Q2 2020 Q3 2020 Q4 2018 2019 2020 Q1 2020 Q2 2020 Q3 2020 Q4
£m, annualised Turnover £m, annualised GVA
5,000 3,000
4,500
2,500
4,000
3,500
2,000
3,000
2,500 1,500
2,000
1,000
1,500
1,000
500
500
0 0
2018 2019 2020 Q1 2020 Q2 2020 Q3 2020 Q4 2018 2019 2020 Q1 2020 Q2 2020 Q3 2020 Q4
New
Source: Oxford Economics
38New 4.1 IN-DEPTH: THE DESIGN ECONOMY
In 2020, the design economy might lose £37bn in GVA compared to 2019 (-47%)
• The design economy stretches across many sectors. In 2016, the Design
Council estimates some 1.7 million people were employed in the design
economy, contributing £85 billion in GVA.
• Using CIF survey results for design companies, we estimate that, over
the course of 2020, employment in the design economy could drop to 1.4
million and GVA to £42 billion as a result of Covid-19.
Jobs £ million, annualised
2,000,000 Employment 90,000 GVA
1,800,000 80,000
1,600,000 70,000
1,400,000
60,000
1,200,000
50,000
1,000,000
800,000 40,000
600,000 30,000
400,000 20,000
200,000 10,000
0 0
2016 2017 2018 2019 2020 2020 2020 2020 2016 2017 2018 2019 2020 2020 2020 2020
Q1 Q2 Q3 Q4 Q1 Q2 Q3 Q4
Source: Design Council, Oxford Economics
* The design economy spans across different sectors—from architecture and craft, to other sectors of the economy,
such as designers working in banks, consultancies, automotive or aerospace companies (Design Economy 2018). .
However, the CIF survey only allowed respondents to select their main sector of operation. Therefore, this analysis
in only based on those respondents who selected design as their main sector. 395. ADVERTISING AND MARKET RESEARCH
In 2020, the sector might lose £19bn in turnover compared to 2019 (-44%)
Number Employees Number Self-employed
180,000 50,000
160,000 45,000
140,000 40,000
35,000
120,000
30,000
100,000
25,000
80,000
20,000
60,000
15,000
40,000 10,000
20,000 5,000
0 0
2018 2019 2020 Q1 2020 Q2 2020 Q3 2020 Q4 2018 2019 2020 Q1 2020 Q2 2020 Q3 2020 Q4
£m, annualised Turnover
£m, annualised GVA
50,000
20,000
45,000
18,000
40,000
16,000
35,000
14,000
30,000 12,000
25,000 10,000
20,000 8,000
15,000 6,000
10,000 4,000
5,000 2,000
0 0
2018 2019 2020 Q1 2020 Q2 2020 Q3 2020 Q4
2018 2019 2020 Q1 2020 Q2 2020 Q3 2020 Q4
New
Source: Oxford Economics
405.1 IN-DEPTH: ADVERTISING
UK advertising spend could drop by £4.2bn in 2020 compared to 2019
AA/WARC figures show that UK advertising spend rose 6.9% year-on-year
to reach £25.4bn in 2019—the tenth consecutive year of ad market growth.
The projected figure for 2020 is for advertising spend of £21.1bn, meaning a
year-on-year reduction of 17%—or £4.2b—from 2019. The most severe drop
is expected during Q2, while improvements are predicted for Q3 and Q4.*
£ billion, annualised
30
25
20
15
10
5
0
2018 2019 2020 Q1 2020 Q2 2020 Q3 2020 Q4
Source: Advertising Association, WARC
*WARC data suggests an uptick in advertising spending in Q3 and Q4, which drives our outlook.
416. PUBLISHING
In 2020, the sector might lose £7bn in turnover compared to 2019 (-40%)
Number Employees Number Self-employed
160,000 70,000
140,000 60,000
120,000
50,000
100,000
40,000
80,000
30,000
60,000
20,000
40,000
20,000 10,000
0 0
2018 2019 2020 Q1 2020 Q2 2020 Q3 2020 Q4 2018 2019 2020 Q1 2020 Q2 2020 Q3 2020 Q4
£m, annualised Turnover
£m, annualised GVA
20,000
12,000
18,000
16,000 10,000
14,000
8,000
12,000
10,000 6,000
8,000
4,000
6,000
4,000 2,000
2,000
0 0
2018 2019 2020 Q1 2020 Q2 2020 Q3 2020 Q4
2018 2019 2020 Q1 2020 Q2 2020 Q3 2020 Q4
New
Source: Oxford Economics
427. MUSEUMS, GALLERIES AND LIBRARIES
In 2020, the sector might lose £743m in turnover compared to 2019 (-9%)
Number Employees Number Self-employed
100,000 8,000
90,000 7,000
80,000
6,000
70,000
60,000 5,000
50,000 4,000
40,000 3,000
30,000
2,000
20,000
10,000 1,000
0 0
2018 2019 2020 Q1 2020 Q2 2020 Q3 2020 Q4 2018 2019 2020 Q1 2020 Q2 2020 Q3 2020 Q4
£m, annualised Turnover £m, annualised GVA
10,000 1,200
9,000
1,000
8,000
7,000
800
6,000 NEMO UK data suggest that almost
5,000 600 half of museums plan to re-open in
4,000
400 Q2, one in four in Q3, and the
3,000
2,000
remaining don’t know.
200
1,000
0 0
2018 2019 2020 Q1 2020 Q2 2020 Q3 2020 Q4 2018 2019 2020 Q1 2020 Q2 2020 Q3 2020 Q4
New
Source: Oxford Economics
438. ARCHITECTURE
In 2020, the sector might lose £1.2bn in turnover compared to 2019 (-24%)
• RIBA figures show that, as of April, practices workloads were just 67% of
what they were 12 months before. We used this to estimate the turnover
shortfall in Q2, then applied Oxford Economics’ forecast beyond Q2.
• Using a combination of RIBA and OE data, we estimate that the
industry’s employment could be as low as 110,000 as a result of Covid-
19, down from 112,000 in 2019. Job losses may be significantly higher if
the construction sector does not quickly rebound
£m, annualised Turnover Number Total employment
6,000 140,000
120,000 Series1
5,000
100,000
4,000
80,000
3,000
60,000
2,000
40,000
1,000 20,000
0 0
2018 2019 2020 Q1 2020 Q2 2020 Q3 2020 Q4 2018 2019 2020 Q1 2020 Q2 2020 Q3 2020 Q4
New
Source: Oxford Economics Source: Oxford Economics
449. OTHER SEGMENTS
Not all sectors are well represented in CIF’s survey
• Only 31 responses were gathered
from IT, software and computer
services companies, including only 6 The UK games sector’s rapid shift to remote
from the video games sector. working has enabled businesses to remain
resilient during lockdown, maintaining high
• Conversations with Ukie suggested levels of productivity with minimal disruption to
that results from this low sample size most roles. At the same time, increased
of games companies were not consumer demand in lockdown and the social
reflective of broader games industry nature of many games has expanded
findings. We therefore used OE’s audiences across a broad demographic.
baseline forecasts for the sector, However, in the mid-to-long-term, many games
businesses are reporting concern about
which project a slightly stronger impacts on their ability to access talent,
employment growth in the Covid finance, investment and business deals,
scenario. risking a slowdown or bottleneck in the pipeline
• After further consideration, the same for new content, especially impacting new UK-
approach was applied to the wider IT made IP.
Source: Ukie
sector, given the low sample size of
the remaining 25 respondents.
45APPENDIX: DEFINING CREATIVE INDUSTRIES
IN-DEPTH: MUSIC (UK MUSIC DEFINITION)

DCMS defines CI using SIC codes…
A number of organisations have highlighted the limitations in using solely the
Standard Industrial Classification codes to define an industry. For this
reason, some organisations have commissioned research to further
investigate the actual size of the sector they represent. UK Music’s Music By
Numbers is an example.

         Employment in
           the music                                      The music
          industry hit                                      industry
          190,935 in                                      contributed
         2018 (in FTE)                                   £5.2 billion to
                                                             the UK
                                                          economy in
                                                              2018

                                                                            47
IN-DEPTH: CRAFTS (CRAFTS COUNCIL
DEFINITION)
…and this is not always suitable…
Another example is the Crafts Council industry definition. DCMS definition
includes just those working in creative industries (SIC code), irrespective of
their occupation (SOC code). Crafts Council’s data instead includes all those
employed in creative occupations, even if outside the creative industries.
Creative industries Non-creative
(SIC) industries (SIC)
Creative jobs (SOC) DCMS & Crafts Crafts Council
Council definition definition
Non creative jobs (SOC) DCMS definition Not creative
Total employment in
Some 40% of
craft occupations
them were self-
was 129,000 in
employed
2017)
48IN-DEPTH: DESIGN (DESIGN COUNCIL
DEFINITION)
…as CI span beyond industry boundaries
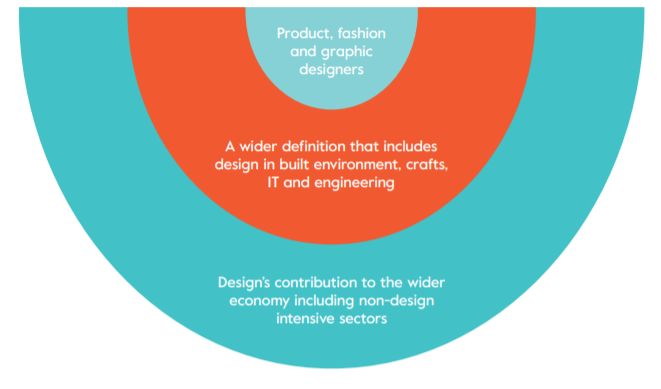
Another example is the Design Council industry definition. DCMS definition
includes just those working as product, fashion, and graphic designers.
Design Council’s data instead adopts a broader definition, including design
in built environment, crafts, IT and engineering, as well as design’s
contribution to the wider economy including non-design intensive sectors. .
Total employment in
craft occupations
was 129,000 in
2017)
New
49SPECIAL THANKS TO:
OE is grateful for additional insight from…
Name Role Association
Andy Edwards Director of Research and Analysis UK Music
Luke Hebblethwaite Insight & Innovation Manager UKIE
Hannah Gagen Advocacy Manager Society of London Theatre | UK
Theatre
Julia Bennett Head of Research and Policy Crafts Council
Sian Whyte Head of Research and Insight Design Council
Julia Lamaison Head of Research and Statistics British Film Institute
Philippa Childs Head of BECTU BECTU
Adrian Malleson Head of Economic Research and Analysis RIBA
Matt Payton Director of External Affairs Radiocentre
Louise McMullan Policy Development Officer and Head of Equity
the General Secretary’s Department
Tim Wilson Policy and Communications Adviser AudioUK
Elizabeth Rosenberg Project Assistant NEMO - The Network of European 50
Museum OrganisationsSPECIAL THANKS TO:
New
OE is grateful for additional insight from…
Name Role Association
Owen Meredith Managing Director The Professional Publishers Association
Neil Hatton Chief Executive UK Screen Alliance
Kate O’Connor Executive Chair and Director Animation UK
Isabelle Gutierrez Head of Communications and The Musicians' Union
Government Relations
Matthew Evans Head of Corporate Affairs Advertising Association
Alistair Brown Policy Manager Museums Association
Andrew Mowlah Director of Research Arts Council England
Cat Hammersley Senior Manager, Data Analysis and Arts Council England
Reporting
Jude McArdle Membership Manager Association of Independent Music
Sophie Jones Director of Public Affairs BPI
Maeve Dunne Policy and Public Affairs Manager Publishers Association
51A NOTE ON REGIONAL RESULTS
Jobs and GVA losses by region were estimated using a similar approach to jobs and GVA
losses by creative segment. However, regional results had to be rescaled so that the sum of
all regional losses matched UK-wide jobs and GVA losses.
For example, the West Midlands hosted 6% of creative jobs in 2019, but as a result of
Covid-19 we estimate it would represent only 4% of creative jobs in 2020. This is then
multiplied by the UK-wide post-Covid creative jobs in 2020, and subtracted from the
regional employment in 2019 to estimate the job losses in the region.
Scaled regional results
Unscaled regional analysis
Calculating regional shares
We employed the The results were These shares
CIF survey used to calculate were applied to
questions the share of each UK-wide creative
presented in slide region in terms of GVA and job
14 to determine creative GVA and numbers post-
GVA and jobs post-Covid. Covid to
employment determine the
losses for each regional GVA and
region. job losses.
52ABOUT OXFORD ECONOMICS
Oxford Economics was founded in 1981 as a commercial venture with Oxford University’s
business college to provide economic forecasting and modelling to UK companies and
financial institutions expanding abroad. Since then, we have become one of the world’s
foremost independent global advisory firms, providing reports, forecasts, and analytical
tools on more than 200 countries, 250 industrial sectors, and 7,000 cities and regions. Our
best-in-class global economic and industry models and analytical tools give us an
unparalleled ability to forecast external market trends and assess their economic, social,
and business impact.
Headquartered in Oxford, England, with regional centres in New York, London, Frankfurt,
and Singapore, Oxford Economics has offices across the globe in Belfast, Boston, Cape
Town, Chicago, Dubai, Dublin, Hong Kong, Los Angeles, Melbourne, Mexico City, Milan,
Paris, Philadelphia, Stockholm, Sydney, Tokyo, and Toronto. We employ 400 full-time staff,
including more than 250 professional economists, industry experts, and business editors—
one of the largest teams of macroeconomists and thought leadership specialists. Our global
team is highly skilled in a full range of research techniques and thought leadership
capabilities, from econometric modelling, scenario framing, and economic impact analysis
to market surveys, case studies, expert panels, and web analytics.
Oxford Economics is a key adviser to corporate, financial, and government decision-makers
and thought leaders. Our worldwide client base now comprises over 1,500 international
organisations, including leading multinational companies and financial institutions; key
government bodies and trade associations; and top universities, consultancies, and think
tanks.
53Global headquarters Europe, Middle East Americas Asia Pacific
Oxford Economics Ltd and Africa
Abbey House
Oxford New York Singapore
121 St Aldates
London Philadelphia Hong Kong
Oxford OX1 1HB
Belfast Boston Tokyo
UK
Frankfurt Chicago Sydney
Tel: +44 (0)20 185 268 900
Paris Los Angeles Melbourne
Milan Toronto
London
Stockholm Mexico City
4 Millbank
Cape Town
London SW1P 3JA
Dubai
UK
Tel: +44 (0)20 3910 8000
New York
5 Hanover Square (8th floor)
Email:
New York NY 10004
mailbox@oxfordeconomics.com
USA
Tel: +1 646 503 3050
Website:
www.oxfordeconomics.com
Singapore:
6 Battery Road
Further contact details:
~38-05
www.oxfordeconomics.com/about-us/worldwide-offices
Singapore 049909
Tel: +65 6850 0110You can also read


