THE REAL VALUE OF ROBUST CLIMATE ACTION - IMPACT INVESTMENT FAR GREATER THAN PREVIOUSLY UNDERSTOOD
←
→
Page content transcription
If your browser does not render page correctly, please read the page content below
THE REAL VALUE OF
ROBUST CLIMATE ACTION
IMPACT INVESTMENT FAR GREATER
THAN PREVIOUSLY UNDERSTOOD
A NET BALANCE REPORT FOR THE GOLD STANDARD FOUNDATION
THE REAL VALUE OF
ROBUST CLIMATE ACTION
IMPACT INVESTMENT FAR GREATER
THAN PREVIOUSLY UNDERSTOOD
A NET BALANCE REPORT FOR THE GOLD STANDARD FOUNDATION

This research has been published with support from WWF Switzerland.                  TABLE OF CONTENTS:
The Gold Standard gratefully acknowledges the input and guidance provided during       Introduction                  4
the review process from:
                                                                                       Objectives                    5
-   Axel Michaelowa, University of Zurich, Perspectives
                                                                                       Methodology                   6
-   Dimitry Gershenson, University of California-Berkeley, EcoShift Consulting
-   Dustin Mulvaney, San Jose State University, EcoShift Consulting                    Key challenges                7
-   Meinrad Bürer, IFRC, and The Gold Standard Technical Advisory Committee            Portfolio analysis           11
-   Richard McNally, SNV
                                                                                       Key findings                 12
-   Sumi Mehta, Global Alliance for Clean Cookstoves
                                                                                       Conclusion                   23
The content of this study does not represent the official views or opinions of the
individuals or organizations listed above.                                             Case studies                 24

© The Gold Standard Foundation 2014                                                    Appendix: Full methodology   40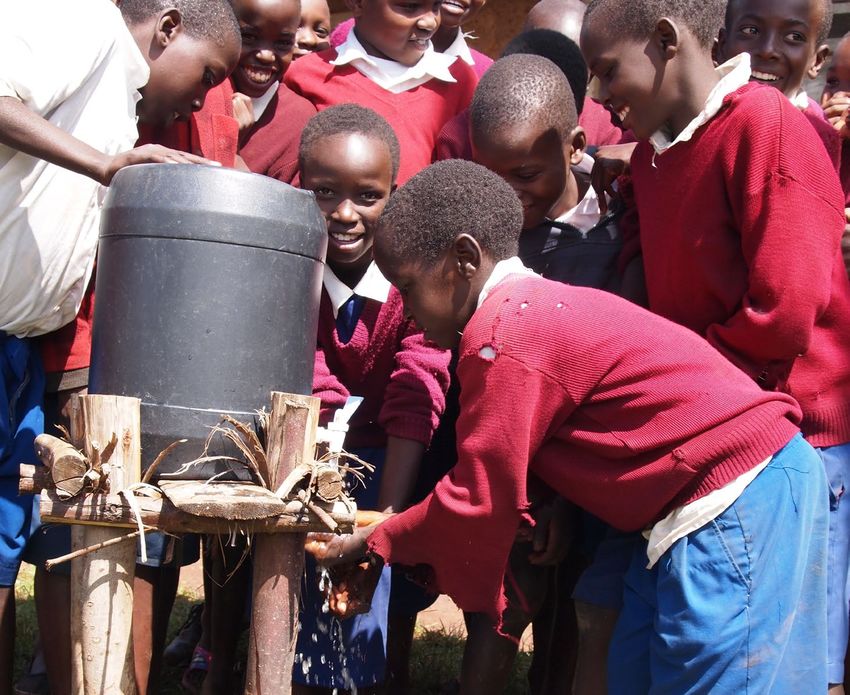
INTRODUCTION
    This year, the Intergovernmental Panel on Climate Change
    (IPCC) released its 5th Assessment Report providing a clear
    and up to date view of the current state of scientific knowledge
    relevant to climate change.

    That report is the result of seven years work from hundreds of
    the world’s leading scientists who sifted through thousands of
    the latest peer-reviewed studies examining the causes, impacts
    and mitigation options of climate change. Its message was clear
    and compelling. Greenhouse gas emissions need to peak this
    decade, and then start their rapid decline, if we are to have a
    chance of staying beneath the “safe” threshold of 2C of warming.

    The 5th Assessment Report also explains that, contrary to those
    who say climate action will cripple the economy, in fact the
    impact of mitigation policies will be negligible on global growth
    at around just 0.06 of a percentage point annually throughout
    the rest of the century. However, what the IPCC did not include
    in this economic assessment was a valuation of the multiple
    positive outcomes beyond carbon that can be delivered by
    reducing energy consumption, switching to clean energy sys-
    tems and saving forests.

    As a leading global player in the delivery of finance to green-
    house gas mitigation projects, The Gold Standard ensures
    that its projects are designed from the outset to deliver these
    environmental and social outcomes beyond carbon mitigation.
    They include improved human health, the ‘services’ of natural
    ecosystems, like water purification, improvements to livelihoods

4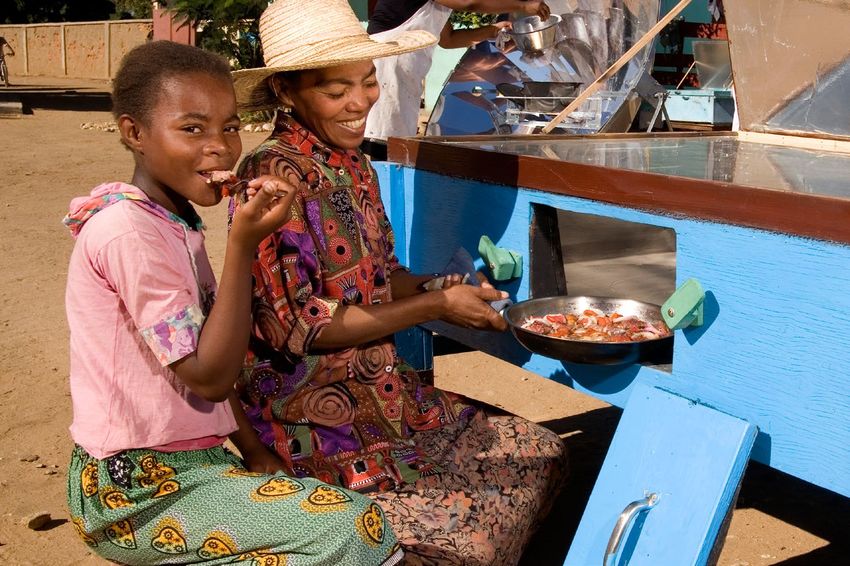
Robust climate mitigation
projects can produce positive
                                                                          This study shows that robustly designed and audited green-

environmental, social, AND                                                house gas mitigation projects, such as those developed through
                                                                          The Gold Standard, deliver far more than carbon emission
                                                                          reductions, meaning that it is no longer necessary to choose
economic outcomes.                                                        between climate and other environment and development
                                                                          outcomes. Strong climate action is not only affordable but,
                                                                          designed correctly, represents an impact investment far
     and the food and economic security of communities, regions or
                                                                          greater than previously understood.
     countries. Indeed, many of these outcomes help to contribute
     to climate adaptation and other key global priorities such as the
     Millennium Development Goals.
                                                                          STUDY OBJECTIVES
                                                                          The objectives of this study were to:
     In the lead up to COP 21 in Paris in 2015, where countries under
     the United Nations Framework Convention on Climate Change            • capture and monetise the environmental and socio-economic
     have agreed to establish a binding international agreement,            net benefits associated with issued Gold Standard (GS) proj-
     much of the policy dialogue centres around the costs and ben-          ects, grouped under key project categories
     efits of strong climate action and the design of climate interven-   • aggregate the benefits across the GS portfolio to demon-
     tions in order to achieve the largest mitigation possible while        strate the value and impact created by the projects
     also delivering sustainable development.                             • undertake further deep dives of selected case studies to cap-
                                                                            ture and monetise these additional benefits linked to specific
     As a contribution to this discourse The Gold Standard commis-
                                                                            carbon projects.
     sioned the sustainability consultancy, Net Balance, to undertake
     the first ever portfolio valuation of the outcomes in addition to    The scope of this study was not to provide a definite valuation
     carbon mitigation in our projects. This was done, where possible,    of the GS portfolio but, for the first time, to put forward a prac-
     by measuring and assigning a monetary value to these outcomes.       tical approach and methodology for discussion and for future
                                                                          refinement. The application of the methodology to the case
     Assigning monetary values, in an objective way, to outcomes
                                                                          studies is also meant to provide a pragmatic framework to these
     beyond emission reductions helps to articulate the positive
                                                                          discussions.
     economic case for strong climate action, enhancing our under-
     standing and appreciation of benefits that in the past may have      The authors and The Gold Standard acknowledge that this is
     been considered “secondary”.                                         a first – and partial – valuation attempt and that, at the project

                                                                                                                                                5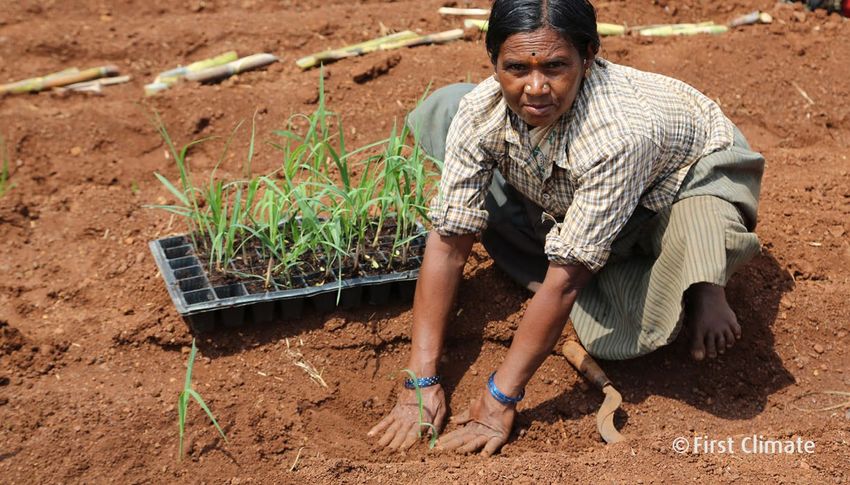
level, there may be many more categories of benefits to be                  • Identification of the material outcomes linked to the
    valued than was possible within the scope of this study.                      Sustainable Development (SD) indicators accruing to the
                                                                                  beneficiaries of a GS issued project, using the available
    METHODOLOGY                                                                   documentation;
    With an objective to assess the environmental and socio-eco-                • Exploration of the availability and suitability of measure-
    nomic net benefits associated with GS projects that have                      ment metrics to gauge the magnitude of these outcomes (or
    achieved the issuance of carbon credits, projects were grouped                “change” occurring for the beneficiaries compared to the
    into key project categories. This study focussed on those cate-               baseline or background trend);
    gories that had the greatest number of projects, and the great-             • Definition of a “proxy” allowing a monetised figure to be put
    est number of carbon credits issued, as there was more robust                 on the outcomes; this can refer to research undertaken in
    documentation available in these areas.                                       other regions on similar projects and deemed suitable for

    Our detailed approach, key assumptions and limitations for                    “benefit transfer” to the project being reviewed;

    each of the material GS indicators are presented in appendices.             • Definition of any moderating parameter, to account in particu-

    Outlined below is an overview of the key steps.                               lar for attribution (when other contributing factors play a role)
                                                                                  and deadweight (when change would have happened to some
    Our methodology for monetising the outcomes accruing to the
                                                                                  extent in the absence of the project, etc.).
    stakeholders or beneficiaries of a project is broadly based on
                                                                                In all these approaches, we assessed possible difficulties in
    economic market and non-market valuation techniques, linked
                                                                                quantification and therefore have defined limitations to the
    with “benefit transfer” techniques to economic studies where
                                                                                proposed quantification and associated uncertainty. These are
    primary valuation has been carried out. Our methodology
    applied the following steps:                                                detailed below. Further methodological details are available in
                                                                                the supplementary methodological report.

                                                                                                Apply a value
       Review & Analyse the           Identify material                                                                        Aggregate
                                                                  Link measurement             using economic
       Portfolio - Identify key         outcomes by                                                                        co-benefits across
                                                                 metrics to outcomes         benefit transfer and
           project types                project type                                                                          the Portfolio
                                                                                              financial proxies

    FIGURE 1: KEY STEPS IN THE METHODOLOGY

6
The assignment of monetary value was critical to the project.                                                • transparency: the methodology to attain the results has been
The techniques mentioned above are widely used and incorpo-                                                    fully disclosed and peer reviewed. A model, that The Gold
rated into such initiatives as The Economics of Ecosystems and                                                 Standard is able to replicate and refine, underpins the results.
Biodiversity (TEEB) and the System of Environmental-Economic
                               1
                                                                                                               Assumptions and limitations are presented alongside the results.
Accounting (SEEA) .            2

                                                                                                             KEY CHALLENGES AND LIMITATIONS
To ensure the valuation was robust the following principles were
also applied:                                                                                                As already noted, the intention of this study was to demonstrate
                                                                                                             the significant broader environment and development outcomes
• conservatism: when assumptions were required conserva-
                                                                                                             of robustly designed carbon projects developed through The
    tive estimates were used; “moderating factors” were applied
                                                                                                             Gold Standard. It was not designed to produce a definitive
    where appropriate, to account for factors such as the attri-
                                                                                                             valuation of the GS portfolio. The approach taken, and the
    bution of benefits to a project (when concurring contributing
                                                                                                             methodology used, is consistent with most examples of current
    factors existed);
                                                                                                             international work and has been structured to allow for iterative
• double-counting was avoided;
                                                                                                             improvements as additional data becomes available.
• consistency: consistency was used across the portfolio to
    ensure meaningful comparisons. This included the use of                                                  In the interest of transparency and recognising that this study’s

    purchasing power parity (PPP) factors to translate mone-                                                 objective is to act as a “stepping stone” for future research,

    tary impact into an “international currency” that takes into                                             this section brings up some of the key current limitations of the

    account the relative purchasing power of money in various                                                study. However, this section does not intend to provide full dis-

    countries; this also included the use of a unique, identical                                             cussion of the sometimes complex debates that each of these

    value for health impacts in relation to cookstoves and water                                             points warrant.

    quality;
• standardisation: standardisation was applied with the use of
    a carbon credit as a “functional unit” allowing the comparison
    of benefits across categories; and

1   The Economics of Ecosystems and Biodiversity (TEEB) is a global initiative focused on drawing
    attention to the economic benefits of biodiversity including the growing cost of biodiversity loss and
    ecosystem degradation (http://www.teebweb.org/).
2   The SEEA aims to provide a consistent measurement framework in support of sustainable develop-
    ment and green economy policy (https://unstats.un.org/unsd/envaccounting/Brochure.pdf).

                                                                                                                                                                                  7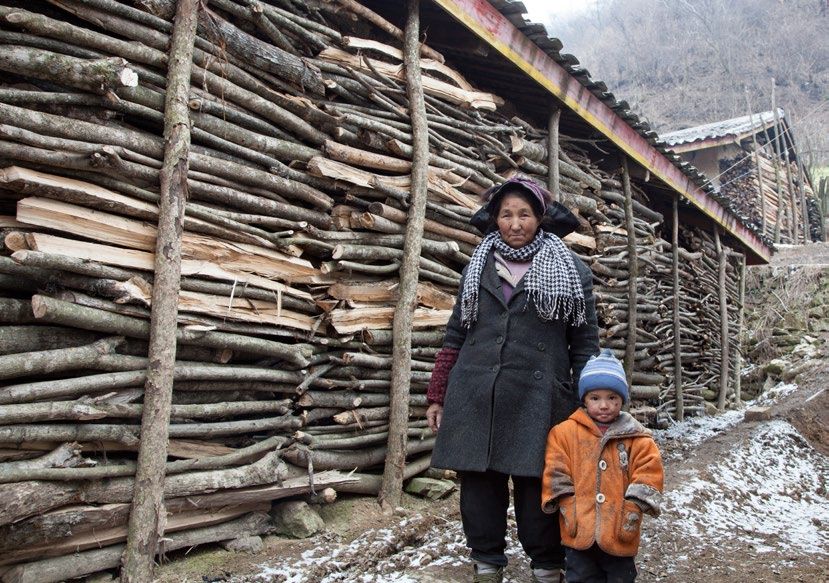
8
METHODOLOGICAL CHALLENGES                                            Despite these limitations, non-market valuation techniques
Critics have suggested that by valuing everything, including         remain the only currently widely accepted way to put a value on
human health and life, there is an implication that anything dam-    intangible benefits and hence meet the objectives of this study.
aged can be “made good” through adequate financial compen-           The challenges outlined above have been addressed by select-
sation. A premise to this study is that valuation and monetisation   ing non-market valuation sources that are authoritative and
may bring interesting perspectives and new angles to assess the      widely cited and as generic in their coverage as possible.
merits of projects and the way to structure and manage them.
                                                                     BENEFIT TRANSFER
This is in no way meant to imply that compensation or even
comparison between categories of benefits is condoned.               Benefit transfer is a practical and low-cost approach, which is
                                                                     not recommended if it is important to produce a very precise
Additional information on the points below can also be found in
                                                                     value for the project area, in which case primary valuation stud-
the supplementary methodological report.
                                                                     ies should be undertaken.

NON-MARKET VALUATION                                                 Ideally, benefit transfer requires a strict control of the similarity
It has been suggested that non-market valuation techniques           between the two environments between which the value transfer
present several difficulties, including the fact that:               is operated and adjustments can be made to the values when no
                                                                     exact corresponding environment can be found where reliable
• value is considered from the sole point of view of human-cen-
                                                                     primary valuation studies have been undertaken. This however
  tric “utility”;
                                                                     requires the definition of attributes and of a value transfer func-
• values for intangibles such as flora or fauna species are prob-
                                                                     tion, which means case by case studies.
  lematic to apportion down to a local scale;
• threshold impacts and marginal values are usually difficult to
  incorporate in such studies;
• values are location specific and, while primary data sources
  are many, there is a general lack of consistency across stud-
  ies; this is emphasised by the fact that each field is highly
  specialised and compartmentalised (health studies, biodiver-
  sity, macro-economics) and there is no standardisation of the
  values produced across these areas of research.

                                                                                                                                             9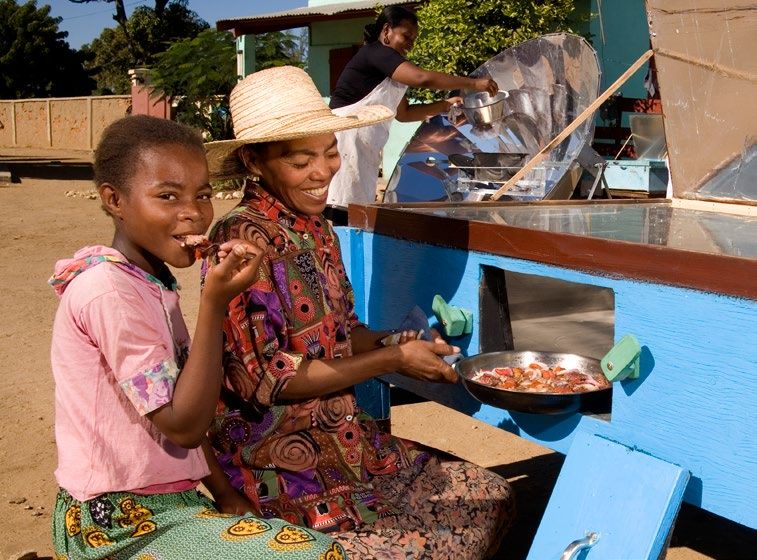
Gold Standard projects make
finances go further by delivering
                                                                             level assessment). For instance, the following co-benefits are

an investment impact far greater                                             examples of those that have not been valued: burden of disease
                                                                             (only the value of life has been valued in terms of health impact
                                                                             – mostly due to difficulties in dealing with overlap in values),
than previously understood.                                                  species diversity and ambient air quality impacts.

                                                                             Mechanisms have been applied for harmonising values across
        In this study, we have addressed some of these challenges in         the portfolio, as much as possible, in particular through the use
        the best way we could, in particular:                                of international dollar value taking into account Purchasing Power
                                                                             Parity. This system could however be further refined. The values
        • we have attempted to use simple value transfer functions that
                                                                             have been calculated per project or per valuation unit within each
          are generic enough to be applicable to consistent co-benefit
                                                                             project then apportioned per carbon credit and per year for ease
          categories (i.e. human health impacts from cookstoves, eco-
                                                                             of communication and this may provide some distortions, which
          system services, etc.);
                                                                             must be borne in mind when considering the results.
        • we have linked these value transfer functions to variables that
          could be readily sourced from the project documentation;           Given the level of precision required and the final presentation
        • we have used source valuation studies that provide generic         per year and per carbon credit, no Net Present Value has been
          enough value to be applied across a fairly broad range of          calculated. This is a deviation to generally applied economic
          projects.                                                          valuation methodologies. On the other hand, it is sometimes
                                                                             recommended to apply a zero (or very low) discount rate when
        Despite these efforts, limitations remain: for example, the valua-
                                                                             calculating “social good” values, which is by and large the case
        tion of life and health benefits has frequently encountered diffi-
                                                                             in this study. We do not believe that this methodological choice
        culties due to the highly different socio-economic backgrounds
                                                                             would materially affect the results of the study.
        in which people live.
                                                                             Finally, monetising social and environmental outcomes should
        PORTFOLIO VALUE EXTRAPOLATION                                        not be a license to trade them off against each other. There
        The most important limitation is that, given the scope of the        are explicit value judgments to be made when deciding to
        study and the diversity of the projects, all co-benefits could not   invest money into biodiversity conservation rather than health
        be explored and valued and only those deemed to be mate-             improvements and the dollar value put on both outcomes must
        rial have been included in the analysis (based on an initial high    not obscure these value judgments. For these reasons, it is

  10
appropriate to keep the valuations separate across the Triple As indicated in the following table (highlighted) the categories of
Bottom Line rather than to try to aggregate them. While we have projects reviewed were:
aggregated values within each broad category of benefit for
• wind (40% of GS portfolio by number of credits, mainly in
ease of presentation, we acknowledge that some stakeholders
Turkey and China);
may object this aggregation, in which case it is possible to revert
• cookstoves and safe water provision (grouped together as
back to the detailed data.
domestic energy efficiency);
• biodigesters providing clean gas to households; and
ANALYSIS OF THE PORTFOLIO • afforestation/reforestation.
The first step was to understand the categories of projects that In addition to obtaining a maximum coverage of the portfolio (by
make up the GS portfolio as illustrated in Table 1. Categories number of projects and of carbon credits), we also wanted to
with either the highest number of issued credits, the highest achieve diversity of projects and thus included the afforestation/
number of projects or with different profiles (e.g. afforestation/ reforestation scope, which is in the process of being progres-
reforestation) were selected for review. Using these three key sively integrated into the GS portfolio.
criteria about 80% of the certified GS portfolio (based on the
number of yearly carbon credits issued) was considered within Once the projects to be reviewed were identified, we deter-
the project scope. About 100 projects were included in this val- mined outcomes for each, beyond GHG mitigation, based on the
uation exercise, while the overall GS pipeline contains in excess changes identified across social, environmental and economic
of 1000 projects. indicators associated with the project types and formalised in
the GS sustainable development matrix.
While this assignment focussed on GS projects that have
achieved credit issuance3, it is highly likely that most registered The categories of outcomes identified included:
projects would present the same benefits, depending on the
• health improvements linked to air quality improvements,
category they fall under. GS projects with credit issuance were
• health improvements linked to water quality improvements,
selected due to the additional level of due diligence and auditing
• biodiversity enhancement (or protection),
for these projects (monitoring reports)4.
• provision of employment,
• improved livelihood of the poor,
3 As opposed to projects that are simply registered, without having gone through the full due diligence • improved balance of payments.
process.
4 With the exception of afforestation/reforestation projects, which have not all achieved credit
issuance.
11Despite conservative estimates,
Gold Standard projects have
would be unhelpful and a misrepresentation of the methodolog-
led to billions of dollars in ical intent.
It is also important to recognise that:
additional benefits to people • the greatest value is likely to arise when a large number of
people are impacted due to the larger scale across which
and the planet. impact is generated;
• the macro-economic value calculated (balance of payment)
does not consider the initial investment into a wind farm
This list does not represent all outcomes relating to GS projects, (initial capital investment, which may come from overseas),
but those that are material and can be valued using the tech- hence the co-benefit estimated only considers one side of the
niques described in the methodology. In addition, an absence financial equation, as this was not a full benefit-cost analysis
of measurable outcomes for a given project does not mean that exercise; and,
co-benefits do not exist, simply that they may be difficult to evi- • there are gaps in the valuation of outcomes for some projects,
dence and measure, or may be multifaceted or dispersed. because of data availability. Some types of outcomes were
easier to estimate (economic for example) than others, as they
KEY FINDINGS were based on simple, objective metrics.
After mapping co-benefits by project and benefit type (Table As the overall GS portfolio results are heavily dependent on the
2) and identifying the outcomes associated with GS projects, number and nature of projects, carbon credits (annual averages
we were able to assign a monetary value to the co-benefits (as extracted from GS’s registry) have been used to standardise (i.e.
illustrated in Table 3). weighted average) the value created. This is presented in Table 4.
The overall results are presented by category of projects, for the It should be noted that this is presented as an “average” vision
80% of the GS portfolio that was valued as part of this exercise. of the portfolio and hides the great diversity between projects.
The values in Table 3 have not been totalled beyond each iden- The averaging of the results per carbon credit does not reflect
tified outcome group, as the outcomes are diverse in nature and the significant spread of values that are dependent on the spe-
the underlying valuation metrics and proxies are from varied cific project characteristics, the data available and the country in
sources. The aggregation of all numbers into one single value which projects are occurring.
12Average Annual Number of TABLE 1
Credits Projects The Gold Standard Portfolio
(issued projects – as of January 2014)
Additionally, the value created over the total crediting
period (7 years for wind and 10 years for the other projects) # % # %
of the projects is presented in Table 5.
5,310,061 41% 54 34% WIND
WIND
The two major outcomes of wind projects are:
2,578,624 20% 3 2% WATER FILTER
• displacement of fossil fuel imports (fuel costs) or allow-
ing of growing fuel exports; and 1,535,881 12% 34 21% COOKSTOVES
• employment generated over the construction and opera-
tion period.
1,231,637 9% 5 3% LANDFILL GAS
It should be noted that improvements in ambient air quality
(leading to improved health impacts) have not been con- BIOGAS DIGESTERS
790,756 6% 13 8% (IMPROVED COOKING)
sidered, as they would be location specific and difficult to
assess. In addition, they would be subject to “displace- 673,785 5% 13 8% OTHER
ment” effects if fossil fuel is then used elsewhere.
The key factors or drivers leading to these outcomes are 539,699 4% 12 8% METHANE RECOVERY
fuel cost and employment.
234,790 2% 13 8% HYDRO
BALANCE OF PAYMENT
• The fuel (coal, gas, oil) displaced by renewable energy SOLAR (THERMAL-HEAT
107,940 1% 7 4% AND PV)
projects varies depending on the dominant fuel used
for electricity production in the country considered (e.g.
AFFORESTATION /
26,346 0.02% 5 3%
coal in China, or gas in Turkey). We checked that such REFORESTATION
fuels were indeed imported in significant quantities.
Differences in price drives the value calculated. 13,029,519 100% 159 100% TOTAL
• All fuel prices will vary significantly over time, driving
significant (and somewhat artificial) variations in values.
continued on page 18
13TABLE 2
Mapping of cobenefits
by project and benefit type
Biodiversity Balance of Employment Livelihood Health Impacts
Payments
AFFORESTATION Hectares of forest Agroforestry employ-
created or preserved ment (permanent and
AND REFORESTATION
temporary)
Savings in fossil fuel Construction (tempo-
WIND imports rary) and operation
(permanent)
Forest preservation: Manufacturing and Financial savings from Reduced respiratory
COOKSTOVES note that this was not distribution of efficient reduced fuel use illnesses / death
valued for lack of data cookstoves
Forest preservation: Distribution and / or Financial savings from Reduced water borne
WATER FILTERS note that this was not installation of filters reduced fuel use for diseases
valued for lack of data boiling water
Forest preservation: Building and / or in- Financial savings from Reduced respiratory
BIOGAS note that this was not stallation of digesters reduced fuel use illnesses / death
valued for lack of data
Environmental
Economic
Socioeconomic
Social
14TABLE 3
Cobenefits per year
(estimates in international $ - 2013)
Biodiversity Balance of Employment Livelihood Health Impacts
per year Payments per year per year per year
per year
$6M $1M AFFORESTATION
AND REFORESTATION
$100M $12M WIND
Unable to quantify
although significant
for some projects
$4M $143M $84M COOKSTOVES
Unable to quantify
$2M Unable to quantify
$302M WATER FILTERS
$1M $6M $25M BIOGAS
15TABLE 4
Cobenefits: per carbon credit
(estimates in international $ - 2013)
Biodiversity Balance of Employment Livelihood Health Impacts
Payments
AFFORESTATION
AND REFORESTATION $150 $27
WIND $19 $2
COOKSTOVES This was not valued
for lack of data $3 $93 $55
WATER FILTERS This was not valued
for lack of data
$1 Unable to quantify $117
BIOGAS $2 $7 $32
GOLD STANDARD
PROJECTS DELIVER
IMPACT INVESTMENT
FAR BEYOND THE
VALUE OF CARBON
REDUCTIONS.
16TABLE 5
Cobenefits: across
project crediting period
(estimates in international $ - 2013)
Biodiversity Balance of Employment Livelihood Health Impacts
Payments
$37M $249M
AFFORESTATION
AND REFORESTATION
$693M $81M WIND (*)
This was not valued
for lack of data $33M $1B $628M COOKSTOVES
This was not valued
for lack of data $21M Unable to quantify
$3B WATER FILTERS
$9M $43M $180M BIOGAS
(*) Calculated over 7 years,
although wind projects usually
have a provision for two renewal
periods for a total of 21 years.
Tables 3 to 5 illustrate the
monetary value applied to each
outcome by category of project.
These are explored in more detail
in the following paragraphs.
17EMPLOYMENT • the family size / number of people exposed to the cookstoves’
Employment has been conservatively valued based on a national smoke.
minimum salary. A Purchasing Power Parity (PPP) factor has Health impact valuation is highly dependent on the assumptions
been applied to this minimum salary, however discrepancies made between the link of air quality (or, for water filtration projects,
remain. The value of this outcome, as well as the number of water quality) and related illnesses. This varies greatly depending
people employed, will vary from project to project (and from on other factors and the vulnerability of each individual.
country to country). It has been assumed that sufficient unem-
While this could be subsequently refined through further
ployment or under-employment existed in most countries and
research, an assumption has been made that cookstoves used
regions to justify always considering employment as a benefit.
outdoors would only deliver 25% of the health benefit delivered
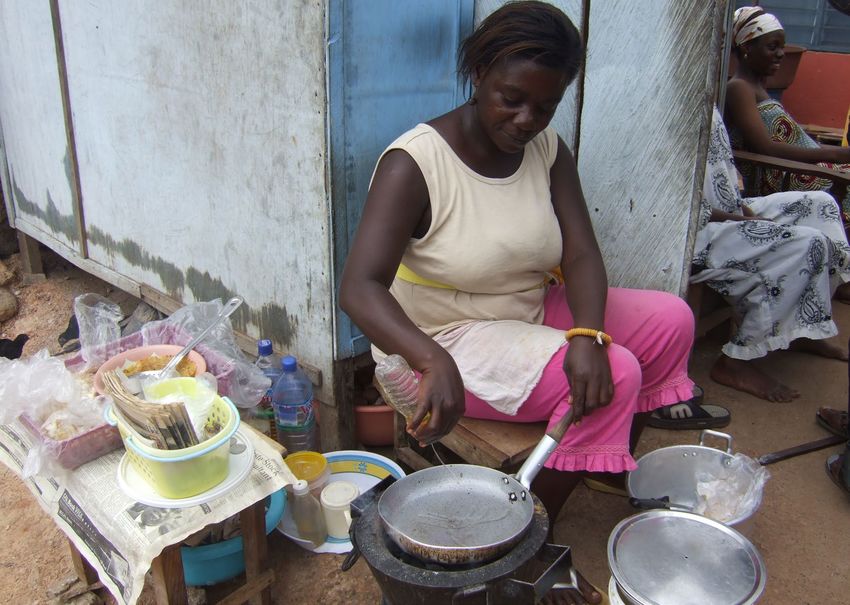
COOKSTOVES, BIOGAS AND WATER FILTRATION by improved indoor cookstoves.
The major outcomes of these projects are: Note that, for consistency, the same value of life/ health has
been applied across all projects and all countries, i.e. a life-year
• improved health (from better air quality or water quality
in Kenya has been valued at the same value as in China. We
depending on the project);
recognise that this is an ethical rather than economic choice.
• increased employment (provided to those manufacturing and
distributing the technology); and Another important caveat is that the “exposure-response” func-
• improved livelihood (through financial savings in fuel purchases). tion applied to all cookstove projects was extrapolated from one
specific African project for a typical type of cookstove. It is rec-
Biodiversity/ forest conservation outcomes associated with
ognised that each type of cookstove will bring different reduc-
these projects have not been valued because of the difficulty in
tions in air pollutants and deliver different related health benefits.
aligning the decrease in firewood collection to hectares of forest
Assessing this would however require significant in-depth
protected (only valid for some projects).
research that was beyond the scope of this project.
HEALTH Health impacts have been valued very conservatively, with a
For health impacts, two key drivers are: number of 3 people per household impacted (where families are
• whether the stove was used indoors / outdoors prior to the typically larger) and the impact of water quality solely calculated
implementation of the project; (this does not apply to water for children under 5 (whose main cause of mortality is diarrhoea),
filtration projects ) and which represents a very conservative approach as it only values
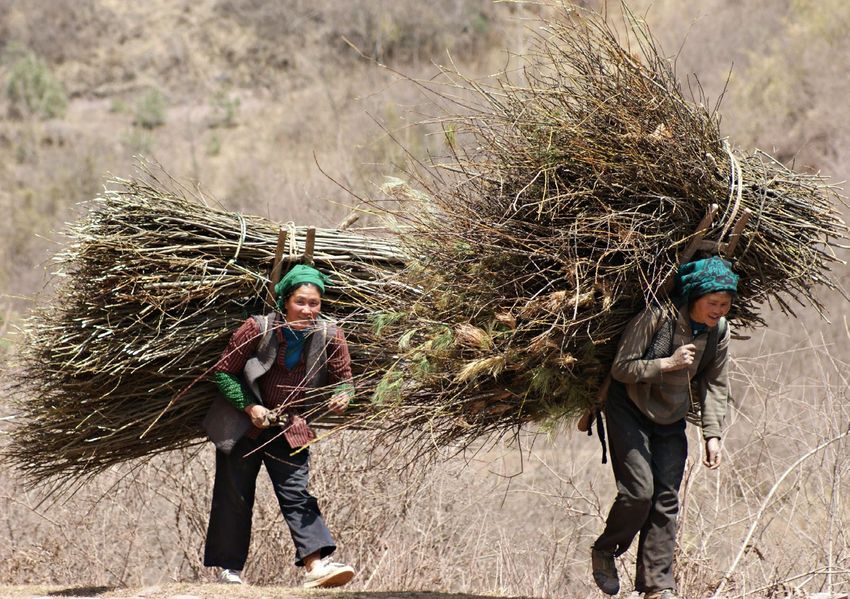
18”My time is saved and I can
now use it for other things. I
can now buy more food with
the money we used to spend on
paraffin for lighting fires. This
stove has changed my life.”
– Mama Mavis, a Xhosa grandmother
in Mapuzi, South Africa
a portion of the benefits. It is acknowledged that this could be
developed much further in subsequent iterations of the work. In
particular, while information provided by the Global Alliance for
Clean Cookstoves has been heavily relied upon, it is acknowl-
edged that it could be used even more extensively in the future
as more up-to-date and more detailed information continues to
be produced5.
EMPLOYMENT
For employment impacts, the structure of the project largely
drives the value. Hence the value of employment varies very
significantly across the projects.
5 In particular the following study, recently published, is of relevance: http://ehs.sph.berkeley.edu/
krsmith/publications/2014/ARPH%20HAP%20CRA.pdf
19value of health
benefits delivered
annually by
Gold Standard
water filter projects
2021
AFFORESTATION/ REFORESTATION
                                                                          The major outcomes are:

                                                                          • Employment, mostly on agro-forestry farms, but also in the
                                                                            management of forest conservation areas; and
                                                                          • Biodiversity, through the valuation of ecosystem services.

                                                                          As these projects produce a low number of carbon credits per
                                                                          year because of the long timeframe of the projects, the value per
                                                                          carbon credit consequently appears inflated.

                                                                          EMPLOYMENT
                                                                          The key drivers for the value of employment are:

                                                                          • the number of people employed (including temporary/sea-
                                                                            sonal staff), which seems to vary significantly from project to
                                                                            project; and
                                                                          • the value of the minimum wage (after applying PPP) in the
                                                                            country of the project.

                                                                          BIODIVERSITY
                                                                          The drivers for the value of ecosystem services are:
     FINANCIAL SAVINGS
     For financial savings, the nature of the fuel and the technology     • the number of hectares dedicated to conservation, as
     (savings obtained) drives the value. Note that the initial invest-     opposed to agroforestry, as the former have been considered
     ment required from beneficiaries (purchase of the device, in           as having a higher value. In particular, there is a significant
     some cases), has not been factored in these calculations. It is        difference between agroforestry opportunities in temperate
     recognised here that this equates to a partial valuation, which        and tropical forests; and
     may not be as conservative as it could be, but information would     • the category of the forest (or biome) restored or preserved
     have been too difficult to trace and this was considered as out-       (tropical forest, temperate forest, woodland or grassland),
     side the scope of this project.                                        ranging from $600 to $1550 per hectare for conservation.

22
• It must be noted that the presence of specific species • the design of future climate action in order to maximise the
(endemic, iconic or endemic) could potentially be considered value of public and private sector investment
a component of biodiversity valuation, but it has not been • integrated policy and project design to simultaneously
applied here, due to: address greenhouse gas mitigation, climate adaptation and
• overlaps between the valuation of ecosystem services and broader sustainable development
the valuation of specific species; and • how far a valuation approach should be developed for multi-
• the need to source specific values for each specific project. ple outcomes;
• the need of standards to underpin co-benefit valuation;
CONCLUSION • the work to be undertaken of address some of the pitfalls and
As illustrated above, by assessing monetary values of, some- limitations highlighted in this report;
times intangible, benefits, we provide a more comprehensive The Gold Standard welcomes feedback and suggestions and
picture of the value of Gold Standard certified projects. This looks forward to playing a key role as the discussion moves
evaluation of beyond carbon benefits not only enhances the forward.
economic case for strong action on climate change through well
designed market based mechanisms, it also provides insights
into the formation of social, economic and environmental value
associated with these projects.
This report’s ambition is to open a discussion around the
valuation, and value, of broader environment and development
benefits from well designed carbon projects. It aimed to pro-
pose an adaptive methodology that can be developed further if
found useful, and to highlight future monitoring requirements to
allow for a better quantitative assessment of these co-benefits,
bearing in mind that a balance needs to be struck in relation to
associated project assessment and valuation costs.
This report should also open a discussion amongst policy
makers and stakeholders around:
23CASE STUDY 1
FIREWOOD SAVING
COOKSTOVES MAMIZE
NATURE RESERVE, CHINA
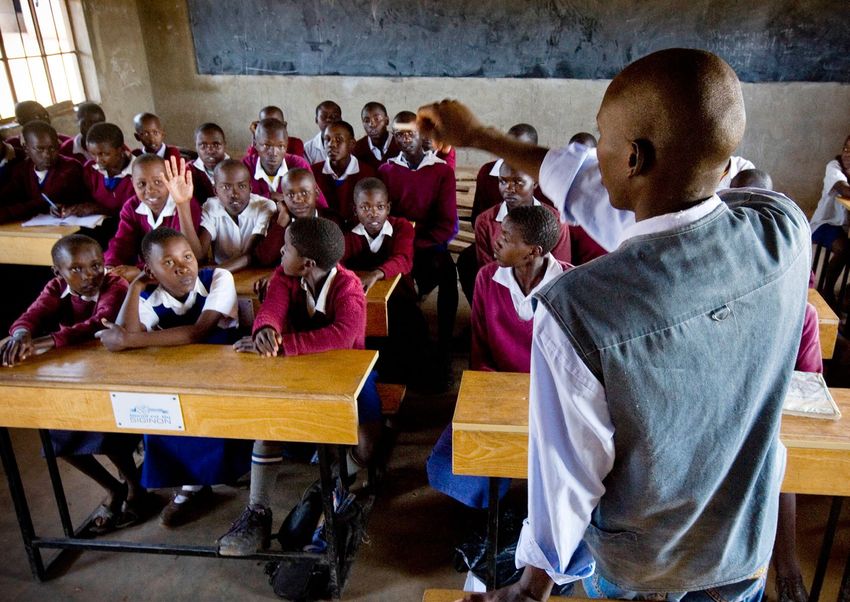
BACKGROUND AND PROJECT DESCRIPTION more deforestation. In addition to deforestation, cooking with
The Mamize Nature Reserve is located in the province of the traditional stoves causes health threatening smoke pollution,
Sichuan, in a mountainous, subtropical region of China. The especially for women and children who typically spend more
reserve is famous for its abundant biodiversity and has a repu- time in the kitchen area than men.
tation as a gene bank of animal and plant species. The reserve Due to the Mamize Nature Reserve area’s under-developed
covers 38, 800 hectares and also marks the southern edge of transportation infrastructure1, patchy electricity supply and high
the Giant Panda’s habitat. electricity prices, there is no affordable alternative to replace
At present, families living within the Gold Standard project wood as a source of heat. Without outside financial support,
boundary use firewood as the main fuel for cooking and heat- local people are not able to afford to upgrade their stoves. To
ing. Three Stone or rough Mud Stoves are the main cooking solve this challenge, WWF Switzerland has invested in the roll
instruments; no other cooking instruments are used. Due to out of a Firewood Saving Cookstoves project - that greatly
low thermal efficiency, these kinds of stoves use a considerable reduce non-renewable biomass combustion, and therefore,
amount of firewood per year, causing local people to spend a slows the deforestation rate - in return for future Gold Standard
lot of time (3 months a year) gathering firewood. As population carbon credits issued to the project.
increases, so too does the demand for firewood. This leads to
1 It is recognised that transportation infrastructure may not necessarily be desirable in a Nature
Reserve
24Firewood Saving Cookstoves, as a mature rural energy technol- A winter stockpile
ogy, which has been used for more than 30 years in China, and of firewood
is still been encouraged in rural areas. These cookstoves have
chimneys and a proper air supply system, which ensures the fuel
is fully burnt and extracts the waste gas and smoke out of the
kitchen. At the same time, thermal efficiency is maximised. As
per data from the local official energy department the stove can
save as much as 50-70% in firewood use.
SOCIAL AND ENVIRONMENTAL OUTCOMES
OF THE PROJECT
In addition to overall greenhouse gas emission reductions, the
two key direct outcomes for the local community that have
adopted the cookstoves are as follows:
1) Improvements in health
• Reduction in air pollution associated with cooking with the old
stoves and the consequent protection of human health
2) Enhanced livelihoods
• Decreased time spent on collecting firewood (from three
months to three weeks according to the project sheet)
3) Biodiversity conservation
• Easing the human impact on the Mamize Nature Reserve
(reduced deforestation)
• Conserving species diversity (both flora and fauna) by pre-
serving the natural forest
A new cookstove
gets a trial run.
25The following diagrams schematically represent the measure- ENHANCED LIVELIHOODS
ment and valuation process for the outcomes considered.
INDICATOR SCALING
IMPROVEMENTS IN HEALTH Dollar savings per household from Number of households with
reduced spending cookstoves
INDICATOR SCALING
Difference in indoor air quality Index created based on linear
Total value of savings across all households in local currency
PM2.5 relationship between indoor
AQ and death rate
FINANCIAL PROXY VALUATION
Percentage improvement in death rate calculated Value of savings adjusted for Purchasing Power Parity
by applying PM2.5 changes to index
TOTAL VALUE OF LIVELIHOOD OUTCOMES
Moderated by discounting
NUMBER OF DEATHS PREVENTED
country death rate by that of
determined by applying death rate to Dominica (country with lowest
number of households with cookstove death rate from HAP)
BIODIVERSITY CONSERVATION
FINANCIAL PROXY VALUATION
Number of deaths prevented x Statistical Value of a Life Year INDICATOR SCALING
Project hectares Reduced deforested land
TOTAL VALUE OF HEALTH OUTCOMES Reduced deforestation on land
FINANCIAL PROXY VALUATION
Ecosystem service values (DeGroot et al 2012)
TOTAL VALUE OF BIODIVERSITY OUTCOMES
26EVIDENCING THE OUTCOMES Post Firewood Saving Cookstoves:
“Obvious indoor smoke reduction.”
IMPROVEMENTS IN HEALTH
Therefore in order to quantify the potential impact of the health
The World Health Organisation Air Quality Guidelines represent
outcomes associated with Firewood Saving Cookstoves, evalua-
the most widely agreed and up-to-date assessment of the health
tions of similar projects were researched that provided evidence
effects of indoor air pollution, recommending targets for air quality
of the reduction of PM2.5 indoor concentration, as a first link to
at which the health risks are significantly reduced. The Guidelines
a reduced impact on health.
indicate that by reducing particulate matter (PM2.5) pollution from
75 to 25 micrograms per cubic metre, air quality related deaths A similar introduction of cookstoves was carried out in Yunnan
can be reduced by around 15%2. In homes where biomass fuels province by The Nature Conservancy China Program with PM2.5
and coal are used for cooking and heating, PM levels may be data collected during the monitoring process to determine
10–50 times higher than the guideline values3. A recent study by the change in Particulate matter after the new technology was
Berkeley University has reinforced the finding that there is a link adopted5. The results of this project were as follows:
between PM concentration and health impacts4. Pre Firewood Saving Cookstoves: 600 µg/m3
The introduction of Firewood Saving Cookstoves in homes aims Post Firewood Saving Cookstoves: 150 µg/m3
to significantly reduce the Particulate Matter (PM) concentra-
Assuming that the efficiency of the cookstoves installed in the
tions in the air due to their ability to funnel out the waste pollut-
Mamize project are similar to that used in the Yunnan project,
ants. The most ideal way to evidence and quantify this change
the results indicate a 75% reduction of PM2.5 levels in par-
would be to record the PM2.5 concentrations in the air pre and
ticipating homes resulting in a significant improvement in air
post the introduction of Firewood Saving Cookstoves in homes.
quality levels.
However, the monitoring requirements for this project only
Research in this space suggests a linear relationship between an
included qualitative data that described the conditions in homes:
increase in PM2.5 levels and the risk to health of those exposed.
Pre Firewood Saving Cookstoves: It has been argued more recently that this may not be so, how-
“Serious cooking-smoke pollution. Cause wide health ever, this has not as yet been quantified so for the purposes of
problems such as eye sickness.” this exercise we have based the impact of Air Quality on health
2 World Health Organization, 2005
on projects where there is a linear relationship between the two5.
3 ibid
4 http://ehs.sph.berkeley.edu/krsmith/publications/2014/ARPH%20HAP%20CRA.pdf 5 World Health Organization, 2005
27An index was created by Net Balance to identify the reduction in When applied to the households receiving cookstoves as part of
mortality in relation to the quantified decrease in indoor air qual- this project, the likely outcome is the prevention of 2.75 deaths
ity. The 600 to 150 µg/m3 decrease in the Yunnan study, would every year for the useful life of the stove (assumed to be the
thus lead to a 79% improvement in the short-term mortality or crediting period).
death rate related to Hazardous Air pollutants. This value also
allows us to calculate the number of deaths prevented per year IMPROVED LIVELIHOODS
in affected communities. This is conservatively used as a proxy Livelihoods are increased as a result of the Firewood Saving
for any negative health impact that inefficient stoves may have. Cookstoves introduction. Typically, for the same type of project, it
This is conservative because no other health impact (non fatal has been considered that the installation of new stoves in homes
diseases) is taken into account. would create employment, usually locally, as a result of the work
required for the manufacturing or installation of the cookstoves.
METHODOLOGICAL SUMMARY The second stems from the fact that family members do not have
1) A death rate due to Hazardous Air Pollutants (HAP) for partic- to spend as much time gathering firewood and can also poten-
ular countries is calculated6 tially reduce their expenditure on other fuel sources.
• Number of deaths from HAPs/country population New jobs creation
• The project proponents indicated that employment creation
2) This is then discounted by the death rate due to HAP from the
was not one of the monitored objectives for this project. While
country with the lowest Air Quality related deaths to account for
employment remains an impact, it is unlikely to be material
what would have potentially occurred regardless of the Firewood
and unlikely to directly benefit the region.
Saving Cookstove (Dominica was the country in the database
Household budget / time savings
that provided such a point of reference)7.
• The Firewood Saving Cookstoves in homes required less
3) We are thus left with an adjusted death rate that can be cooking time and firewood. Household members save time
applied to the number of households with stoves to determine by not having to go out and gather firewood from the nature
the number of deaths that would be prevented within the partici- reserve and are able to dedicate time to other tasks.
pating communities. • The monitoring reports for this project did not include quan-
titative data to assist in quantifying this outcome. We thus
6 Data sourced from Global Alliance for Clean Cook Stoves initiative, http://www.clean- had to build assumptions to estimate the value of time saving.
cookstoves.org/
These assumptions were based on a case study in another
7 ibid
28region of China, where people had to make 4 to 7 journeys VALUING OUTCOMES
a week in winter to collect between 20 to 40 kg of wood at
IMPROVED HEALTH
every journey8.
The value of statistical life is often used to estimate the benefits
• Assuming that a trip would take 2 hours (conservatively) to
of reducing the risk of death. The value of statistical life is an
collect 30kg of wood, considering that a family was found to
estimate of the monetised value society places on reducing the
use 26t of wood per year, the overall collection effort would
average number of deaths by one. The value of statistical life is
be the equivalent of 866 hours a year.
most appropriately measured by estimating how much society
• By investing in a cookstove, families would save half that time,
is willing to pay to reduce the risk of death. A related concept is
i.e. 433 hours.
the statistical value of life year (SVOLY) that can be adjusted to
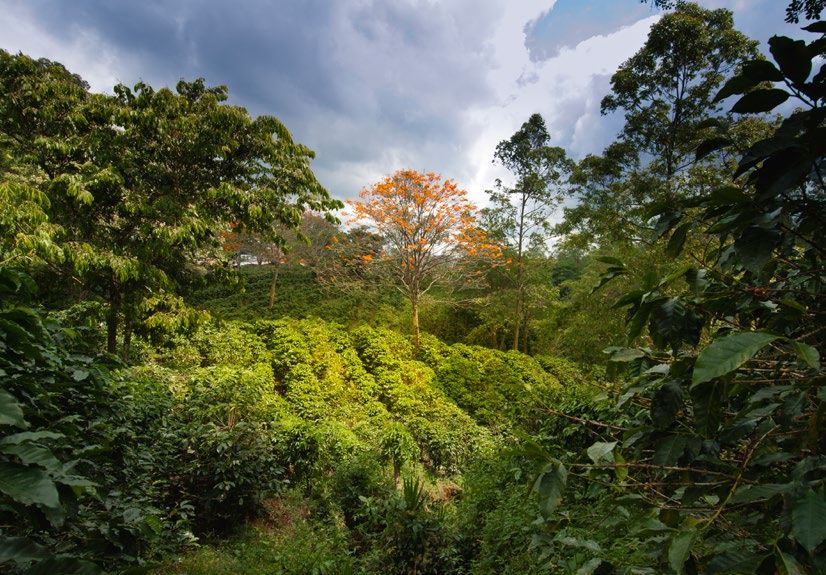
BIODIVERSITY CONSERVATION take into account the reduced quality of life related to a life with
The forest in the project area in Sichuan province is at a high injuries or diseases9.
altitude in a subtropical region, with high conservation value, as
The SVOLY can be applied to the number of deaths prevented
it is one of the three provinces where the Giant Panda can be
over the crediting period of this project resulting in a social
found. By reducing the need for firewood (by 50% to be conser-
value of $325,000 in health outcomes per year, or about 3.25
vative), the rate of degradation of the forest can be slowed down,
million dollars over the 10 years of the project’s crediting period,
as only half of the previous quantity of firewood is required.
or about $20 per carbon credit, considering an approximate
The quantity of wood used per family was estimated at 26t/year number of credits of 16,000 annually.
in the baseline (according to the Project Design Document or
PDD). If only 10.9t/year is used after installation of the stoves in IMPROVED LIVELIHOODS
1600 households (this number may increase over time), 17,440t To calculate the value of the estimated savings per household,
of wood can be saved per year in the project area. the number of hours saved was valued using the same mini-
mum wage for China, corrected using PPP, with a factor of 50%
This has been estimated to correspond to approximately 224
applied, to account for the fact that only half of the time saved
hectares of forest conserved per year. The project proponent
would be dedicated to productive tasks10.
plans are to increase the number of stoves, delivering propor-
tionally higher benefits.
9 Abelson 2007, Establishing a Monetary Value for Lives Saved: Issues and
Controversies, Working Papers in Cost benefit Analysis, Department of Finance and
Deregulation
8 http://www.id-ong.org/cn/import/Leaflet_ID_ecostove_English_display.pdf 10 Our assumption, consistent with similar other studies in developing countries
29The following livelihoods values were derived from these prevention, nutrient cycling, pollination and biological control,
assumptions: excluding climate regulation.
• Habitat services.
• Financial savings per year - $374 per family per year, $600,000
per year, $6M over 10 years and $37 per carbon credit. The value per hectare for a temperate forest protected (assum-
ing it is not used as agroforestry) is $1560 per year, resulting in
BIODIVERSITY PROTECTION
a value of $349,000 per year, or $22 per carbon credit, or $3.5M
There are many different economic valuation methods attempt-
over the 10 year crediting period.
ing to capture biodiversity value and it must be recognised that
there is no clear consensus on the best method to use. However,
the most common method for valuing biodiversity and avoiding
LIMITATIONS AND AREAS FOR
double-counting is the valuation of ecosystem services asso-
IMPROVEMENT
ciated with a fully functioning natural environment. By focusing
IMPROVED HEALTH
on ultimate “services”, double-counting and over-estimates are
• The same value of life-year (118,500 int. $, sourced from an
avoided.
Australian study and actualised into 2013 international dol-
Proxy values for ecosystem services have been derived from lars) has been applied across all countries, out of concern for
a study by de Groot et al (2012), where global estimates of the fairness (no PPP was applied)
value of ecosystems and their services have been estimated • Variation in indoor air quality, represented by PM2.5 concen-
based on a review of studies contained within the Ecosystem tration before and after implementation of the project was
Service Value Database (ESVD). Amongst the list of ecosystem sourced from a similar project in a neighbouring project. The
services itemised in the study, the following basket of ecosystem communities involved in the geographical location of the proj-
services have contributed to the proxy values : 11
ect used could have considerably different cultural practices,
• Water provisioning service. weather conditions and cooking habits that might lead to an
• All regulating services including air quality, disturbance mod- over or underestimation of the resulting health impacts. It is
eration, regulation of water flows, waste treatment, erosion thus recommended that quantitative data collection is under-
taken to monitor Air Quality levels to make comparisons of
project outcomes to WHO guidelines and thresholds.
• The reference for the “best possible” level of air quality related
11 This selection of ecosystem services is based on a review of the PDDs, or some of the
PDDs in each sub-category of projects.
deaths due to Hazardous Air Pollutants has been sourced
30from the same database as the levels for project countries. In mentioned above, and also because of the difficulty in unrav-
this case it happens to be Dominica, although no explanation elling the number of contributing factors for such an outcome.
has been sought for why that might be the case. Similar infor- • The reduced expenditure on fuel will have an impact on
mation could not be found for developed countries. economic livelihoods in different ways depending on how it
• The household size in this region is 4.6 people per family, as is used. For example, the broader economic impact might be
advised by the project proponent. This does not mean that larger depending on the assumed marginal propensity to con-
all people in the household are exposed in the same way, sume. Greater granularity on this aspect in monitoring reports
but refining this estimate would require far more time than or stakeholder consultation can enable this to be taken into
available for this study. The Berkeley study referenced above account in the future.
proposes an approach for such refinements.
BIODIVERSITY PROTECTION
ENHANCED LIVELIHOODS • Sourcing of a non-market valuation study for a forest with
• Employment numbers were not always available: to fill in the characteristics close to that observed for the Sichuan forest,
gaps, the average number of jobs created by cookstoves was including the specific value of habitat for the Giant Panda,
calculated for projects for which this information was avail- could help improve on the relevance of the value per hectare
able and applied to projects for which information was not used as a proxy. It is noted that other significant wild spe-
available. This can be improved in future monitoring reports cies also populate the region. It was not possible to precisely
providing quantitative data. match the natural habitat in the region with primary valuation
• The financial value of fuels purchased was not available to studies of similar biomes within the scope of the study and
calculate financial savings (livelihood outcome). This may this is certainly an area for potential improvements.
include cases when people gather wood and their own time • We have been however advised that according to the
is involved. The same savings as the closest project (same Assessment Report of Forest Ecological Services in China
country / region) was applied. The time value of gathering (2010)12, the forest can provide ecological services average
wood is therefore approximated by reference to the market RMB 42,600 per hectare per year, which would translate into
value of the fuel. However, obtaining a good estimate of the approximately $6,800, hence a much higher value than the
time saved and surveying the communities to understand how one we have conservatively applied.
this time saved was used would allow for better valuation.
• Outcomes such as women’s empowerment have not been
considered to avoid double counting with the financial value 12 We could not source this report.
31• 32
$143M saved
annually in fuel or
firewood collection
time = $1 billion in
livelihood benefits
over project period

                       33
CASE STUDY 2
SAYALAR DISTRICT
WIND PROJECT MANISA
PROVINCE, TURKEY
BACKGROUND AND PROJECT DESCRIPTION reliance on fossil fuel based electricity and reducing the green-
Sayalar District is located in Manisa Province in western Turkey. house gas emissions.
Manisa Province has traditionally been an agricultural centre, The project is increased the existing capacity to 54.2 MW
producing grapes, olives, tobacco, sesame and cotton. Today, installed capacity by adding 20MW in capacity (10 more wind
the Manisa Province has seen the emergence of many renew- turbines were installed) with the acceptance on December 25,
able energy projects that are helping to meet the country’s 2013. The electricity generation from the capacity addition is
electricity needs, like the Sayalar wind farm. The electricity estimated to be approximately 54,404 MWh/year and will also be
generation mix in Turkey is dominated by fossil fuels, in partic- delivered to the national grid.
ular natural gas that accounts for around 55% of the electricity
The project reduces greenhouse gas emissions by replacing
production. The demand for electricity in Turkey is growing at
electricity generation from the Turkish grid system with wind
8% every year. At present, Turkey relies on importing energy
generated electricity.
from its neighbours to meet demand.
The Sayalar wind farm is intended to contribute to the develop-
The Sayalar wind project consists of 38 wind turbines, each with
ment of the wind energy sector in Turkey, create local employ-
a capacity of 900kW and generates 116,050 MWh per year. The
ment, contribute to local economies through procurement,
generated electricity is fed into the national grid, lessening the
34promote the transfer of technology and reduce Turkey’s depen- ENHANCED LIVELIHOODS
dency on fossil fuel imports (gas).
INDICATOR SCALING
SOCIAL AND ECONOMIC OUTCOMES Number of new jobs created Depending on the number of
permanent / temporary positions
OF THE PROJECT
Material outcomes that were quantified and valued for this proj-
Total number of new jobs created
ects include:
1) Enhanced Livelihoods of the poor through creation of new
employment opportunities FINANCIAL PROXY VALUATION
Minimum wage in country adjusted for Purchasing Power Parity
• Local employment will be created during both the construc-
tion and operational phase. In Turkey the unemployment level
is 11% and hence it has been assumed that the project will TOTAL VALUE OF LIVELIHOOD OUTCOMES
have a positive impact on the local and regional employment.
2) This project is likely to result in positive macro-economic bal-
ance of payment impacts for Turkey
• Although macro-economic impacts are complex to model, an BALANCE OF PAYMENTS
increase in domestic production of energy should lead to a INDICATOR SCALING
reduction of Turkey’s reliance on imports of energy, in particu- Total electricity produced by Convert electricity produced into
renewable energy source amount of fossil fuels not required
lar natural gas.
The following diagrams schematically represent the measure-
Quantity of fossil fuels not required for electricity generation
ment and valuation process for the outcomes considered.
FINANCIAL PROXY VALUATION
Average price of fossil fuel (coal, gas, oil)
TOTAL VALUE OF BALANCE OF PAYMENT OUTCOME
35EVIDENCING OUTCOMES BALANCE OF PAYMENT IMPACTS
The evidence for this outcome is straightforward, with the aver-
IMPROVED LIVELIHOODS
age annual electricity generation of the 48 wind turbines being
Livelihoods are increased primarily through access to new and
relatively easy to predict. This provides adequate data to deter-
better quality jobs, created by the operational and construction
mine the scale of this outcome.
needs of the Sayalar wind farm. It was stated that all new job
opportunities would be made available to the local communities • The combined annual electricity generation capacity of the
as a priority, hence improving local families’ household incomes. initial wind turbine installation and the additions amount to
In addition, local employees are also trained in specific techni- 170,454 MWh.
cal and security skills for future employment opportunities. The The methodology for calculating the benefits of reduction in
construction phase of the first phase of the project saw 9 people required imports of fossil fuels is a cost avoidance valuation pro-
hired from the local community and several other employees cess, using the cost saved as a result of not purchasing fossil
hired from the region. For the operational phase, 13 local people fuel imports.
will be hired for the project, including:
• 4 electricity board operators,
VALUING OUTCOMES
• 4 security staff, IMPROVED LIVELIHOODS
• 4 technicians, and
To be conservative, Turkey’s minimum salary has been used to
• 1 electrical engineer.
value this outcome. Considering the wide range of projects in
The second part of the wind project will employ 3 more local various countries, the Geary Khamis (International dollar) was
people as operators. Thus the total number of job opportunities used to normalise the increase in wages per household due to
created through the Sayalar wind project amount to: the creation of new jobs across the project portfolio. The Geary
Khamis based minimum wage was used to calculate the min-
• 57 construction staff, and
imum wage in Turkey countries based on Purchasing Power
• 14 operational staff.
Parity (PPP)13.
Construction jobs have been considered as part of the over-
• Value created through 71 new jobs created: $200,000 per
all employment impact, with a moderating factor to take into
year, or $2.30 per carbon credit.
account their temporary character.
13 World Bank Database, http://data.worldbank.org/indicator/PA.NUS.PPPC.RF
36You can also read