The Recent Storms and Floods in the UK - February 2014
←
→
Page content transcription
If your browser does not render page correctly, please read the page content below
The Recent Storms and
Floods in the UK

February 2014

     Recent_Storms_Briefing_Final+SLR   -1–
     © Crown copyright 2008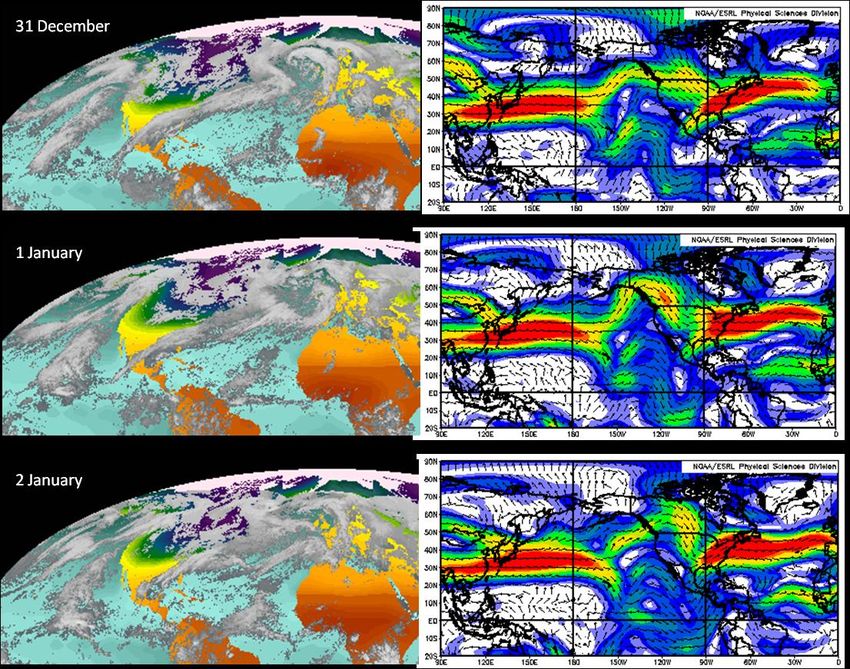
Summary
This winter the UK has been affected very severely by an exceptional run of winter
storms, culminating in serious coastal damage and widespread, persistent flooding.
This period of weather has been part of major perturbations to the Pacific and North
Atlantic jet streams driven, in part, by persistent rainfall over Indonesia and the
tropical West Pacific.
The North Atlantic jet stream has also been unusually strong; this can be linked to
exceptional wind patterns in the stratosphere with a very intense polar vortex.
This paper documents the record-breaking weather and flooding, considers the
potential drivers and discusses whether climate change contributed to the severity of
the weather and its impacts.
Although no individual storm can be regarded as exceptional, the clustering and persistence
of the storms is highly unusual. December and January were exceptionally wet. For England
and Wales this was one of, if not the most, exceptional periods of winter rainfall in at least
248 years. The two-month total (December + January) of 372.2mm for the southeast and
central southern England region is the wettest any 2-month period in the series from 1910.
During January and into February the tracks of the storms fell at a relatively low latitude,
giving severe gales along the south and west coasts and pushing the bulk of the ocean wave
energy toward the southwest of Ireland and England. Peak wave periods were exceptionally
long; each wave carried a lot of energy and was able to inflict significant damage on coastal
infrastructure.
In a series from 1883, flow rates on the River Thames remained exceptionally high for longer
than in any previous flood episode. Correspondingly, floodplain inundations were extensive
and protracted.
The severe weather in the UK coincided with exceptionally cold weather in Canada and the
USA. These extreme weather events on both sides of the Atlantic were linked to a persistent
pattern of perturbations to the jet stream over the Pacific Ocean and North America. There is
a strong association with the stormy weather experienced in the UK during December and
January and the up-stream perturbations to the jet stream over North America and the North
Pacific.
The major changes in the Pacific jet stream were driven by a persistent pattern of enhanced
rainfall over Indonesia and the tropical West Pacific associated with higher than normal
ocean temperatures in that region.
The North Atlantic jet stream has also been unusually strong; this can be linked to an
unusually strong westerly phase of the stratospheric Quasi-Biennial Oscillation (QBO), which
in turn has driven a very deep polar vortex and strong polar night jet.
As yet, there is no definitive answer on the possible contribution of climate change to the
recent storminess, rainfall amounts and the consequent flooding. This is in part due to the
highly variable nature of UK weather and climate.
Sea level along the English Channel has already risen during the 20th century due to ocean
warming and melting of glaciers. With the warming we are already committed to over the
next few decades, a further overall 11-16cm of sea level rise is likely by 2030, relative to
1990, of which at least two-thirds will be due to the effects of climate change.
Recent studies suggest an increase in the intensity of Atlantic storms that take a more
southerly track, typical of this winter’s extreme weather. Also the long-term warming of the

                                            2
© Crown copyright 2014
sub-tropical Atlantic will also act to enhance the amount of moisture being carried by storms
that take this more southerly track.
There is an increasing body of evidence that extreme daily rainfall rates are becoming more
intense, and that the rate of increase is consistent with what is expected from fundamental
physics. There is no evidence to counter the basic premise that a warmer world will lead to
more intense daily and hourly heavy rain events.
More research is urgently needed to deliver robust detection of changes in storminess and
daily/hourly rain rates. The attribution of these changes to anthropogenic global warming
requires climate models of sufficient resolution to capture storms and their associated
rainfall. Such models are now becoming available and should be deployed as soon as
possible to provide a solid evidence base for future investments in flood and coastal
defences.

                                            3
© Crown copyright 2014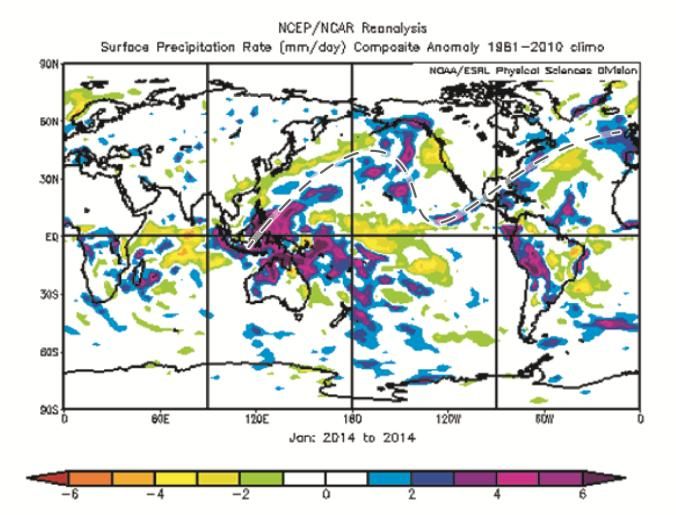
Record-breaking Weather
Throughout December, January and February 2013/14, the UK has been affected by an
exceptional run of severe winter storms, culminating in the coastal damage and widespread
flooding from January onwards. The impacts on individuals, businesses and infrastructure
have been substantial. This paper documents the statistics of these storms, how unusual
they were in the terms of past records, and considers the global context in which these
storms formed. Finally the question of whether the intensity of these storms, and their
impacts on flooding, has been influenced by climate change will be considered.
During December widespread high wind speeds were recorded across UK, as a sequence of
deep lows tracked across or to the north of the country. The storm on 4th-5th December
generated a major North Sea storm surge event, which coincided with one of the highest
tides of the year and threatened much of the east coast in a similar manner to the 1953
event. With improved coastal defences built by the environment agency and accurate early
warnings several days in advance major damage was avoided. The Environment Agency
Thames Barrier was raised to protect London from the largest tide recorded at Southend
since it became operational.
A measure of the extent and severity of the December storms can be seen in the number of
stations from the observational network that recorded maximum gust speeds greater than 50,
60, or 70 Knots (excluding stations with an altitude >=250m and four exposed offshore sites).
For each of the thresholds the number of high wind gusts in December 2013 is higher than
for any other December back to 1969 (Figure 1), and is one of the windiest calendar months
for the UK since January 1993.

               Station count of wind gusts exceeding 60 kts
 250

 200

 150

 100                                                                                          Total
  50

    0
        Dec    Dec     Dec      Dec      Dec        Dec    Dec      Dec      Dec
        1969   1974    1979     1984     1989       1994   1999     2004     2009

Figure 1: Record of the number of stations reporting wind gusts in excess of 60 kts during December.
The stormy weather continued into January with a major storm on 5th and 6th January, which
caused widespread coastal damage and flooding in southern England. With a brief respite in
January the stormy weather returned with the first week of February seeing a sequence of
very deep depressions running into the UK with very high winds and storm surges that
caused substantial damage along the south coast.

The exceptional duration of the stormy weather and the clustering of deep depressions has
been a notable feature of this winter. Rainfall records were broken in both December and
January (Figure 2). Scotland had its wettest December since records began in 1910. In
southern England, January was the wettest recorded since 1910 (Figure 3), and the statistics
suggest that this was one of, if not the most, exceptional periods for winter rainfall across

                                                4
© Crown copyright 2014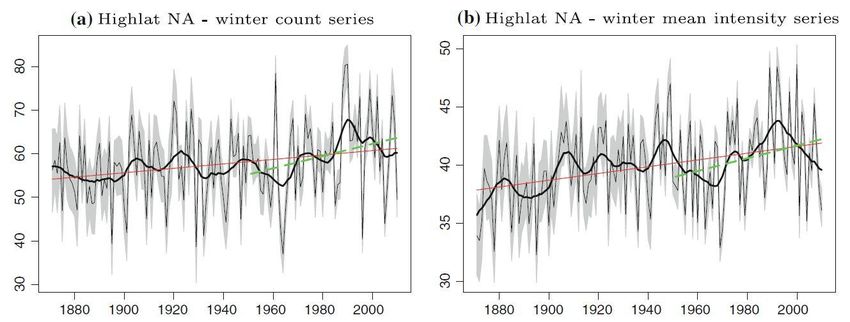
England and Wales in at least 248 years. The two-month total (December + January) of
372.2mm for the southeast and central southern England region is the wettest of any 2-
month period in the series from 1910.

Figure 2: Rainfall for December 2013 and January 2014 from the observational network, showing the
distribution of rainfall anomalies as a % of the long-term average from 1981-2010.
A particularly exceptional aspect of January 2014 has been the number of days with rain
across southern England (Figure 3, lower panel), which far exceeded anything previously
recorded for January. Overall there have been very few dry days since 12th December. This
continuous sequence of rain events led to increasing saturation of the ground so that
widespread flooding became inevitable when the major storm of 5th and 6th January arrived
over the UK. The Thames, in particular, recorded some of the highest flow rates ever
measured at this time of year. In January 2014, the Environment Agency Thames Barrier
was raised on 13 consecutive times to protect people and property as high fluvial flows and
high spring tides coincided. Rainfall continued to be well above average through January,
giving little respite for areas already affected by flooding especially in southern England, and
notably Somerset.
As already noted this winter has been exceptionally stormy. A particularly intense depression
passed to the north of UK on 24th December with Stornaway recording a mean sea level
pressure of 936mb (Figure 4). Pressures below 950mb for UK land stations are relatively
rare, and this is the lowest such value at a UK land station for many years. Based on an
analysis by Burt (2007)1 it is potentially the lowest land station pressure record since 1886.
This storm led to widespread disruption to travel and the loss of power to hundreds of
thousands of homes over the Christmas period.

1
  Burt, 2007: The Lowest of the Lows … extremes of barometric pressure in the British Isles, part 1 –
the deepest depressions. Weather, 62, 4-14 http://onlinelibrary.wiley.com/doi/10.1002/wea.20/abstract
2
 The jet stream describes ribbons of strong westerly winds high in the atmosphere, typically between
200 and 300mb that circumnavigate the northern and southern mid-latitudes. In the northern

                                               5
© Crown copyright 2014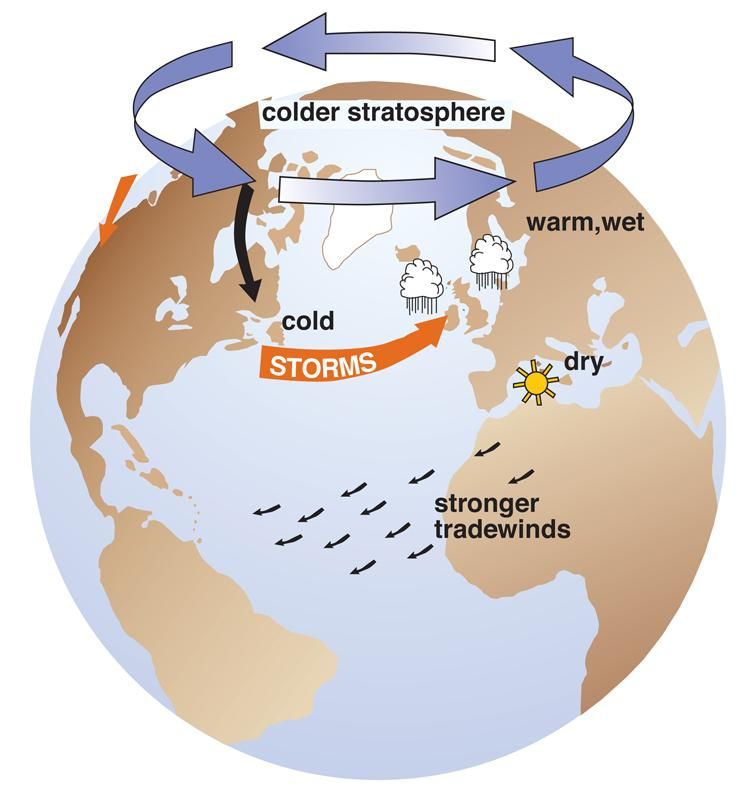
Figure 3: Time series of total
                                                                rainfall (mm) for January in
                                                                southern      England    from
                                                                records going back to 1910
                                                                (top panel), and the number of
                                                                days with rain (>1mm) in
                                                                southern      England    from
                                                                records going back to 1961
                                                                (bottom panel).

                                                              Figure 4: Surface pressure chart
                                                                         th
                                                              for 12z, 24 December showing
                                                              the formation of an intense
                                                              depression to the north of
                                                              Scotland.

This sequence of storms continued into January 2014, with a deep depression forming over
the North Atlantic on 5th January. A notable feature of this storm was the size of the
depression (Figure 5), which affected the whole North Atlantic. Storms of such size and
intensity are rare. This meant that the fetch and strength of the winds built up a huge swell
with some of highest recorded wave heights reaching the shores of Western Europe. The
west coasts of the UK were severely affected by the storm surge and the exceptionally high
waves resulting in extensive damage to sea defences. Rainfall associated with this system

                                            6
© Crown copyright 2014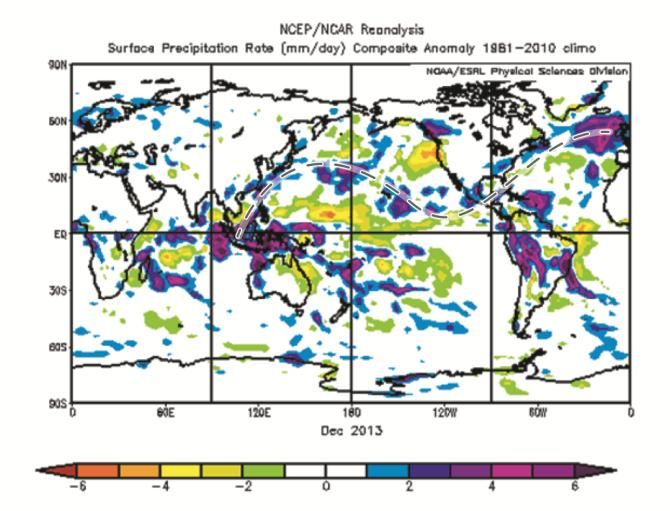
also caused extensive flooding in areas already saturated by the wet weather in the
preceding months.

                                                             Figure 5: Surface pressure charts
                                                                       th                    th
                                                             for 12z, 5 January and 00z, 6
                                                             January showing the strength and
                                                             size of the depression and its
                                                             associated frontal systems.

Throughout the development of the storm that affected the UK on 5th, 6th and 7th January, the
Met Office ocean and wave forecast models were giving very useful guidance. On the global
scale, significant wave heights in excess of 16m were predicted to the south west of the UK,
consistent with other estimates of wave heights exceeding 15m (50ft) (Figure 6, left panel).
Higher resolution forecasts using the UK 4km model showed that these waves would reach
UK shores as a strong, very long period swell (Figure 6, right panel). Consequently, each
wave carried a lot of energy and was able to inflict significant damage on coastal
infrastructure.
Storms generating waves of this height are not particularly unusual for the northeast Atlantic,
but several factors mark out the event on 6th and 7th January. The track of the storm fell at a
relatively low latitude for an event of this type, pushing the bulk of the wave energy towards
the southwest of Ireland and England. Peak wave periods were exceptionally long (even
compared with storms of similar wave height occurring in December), and enhanced the
impact of the waves at the coastline. The combination of significant wave height and peak
period is likely to mark out the storm as a one in 5-10 year event in the southwest of the UK,
based on experience of waves over the last 30 years. In terms of the coastal system as a
whole, pre-existing river and groundwater levels plus impact on coastal sediment levels of a

                                             7
© Crown copyright 2014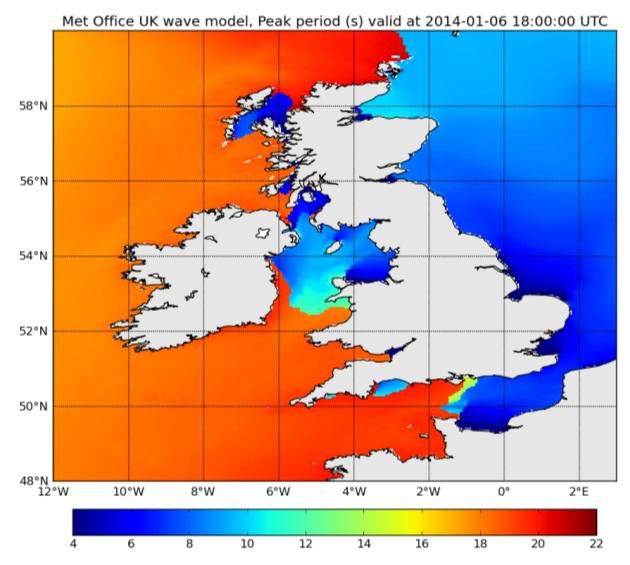
sequence of highly energetic wave events during December may make this is a far rarer
event.

                                                                                                  th
Figure 6: Significant wave heights (m) from the Met Office global wave model valid for 06z on 6
                                                                                                th
January (left panel) and peak period (seconds) between waves from the UK 4km model for 18z on 6
January.
With sea defences already weakened the storms that affected southern England on 4th and
5th February, and expected for 7th and 8th February, (Figure 7) have caused serious localised
damage to infrastructure. The strength the waves, driven onshore by the very strong winds,
and the consequent height of the storm surge produced very dangerous conditions along
southern coasts. The heavy rainfall that accompanied these systems also led to worsening
conditions in areas already affected by prolonged flooding.

                                                            Figure 7: Surface pressure chart for
                                                                   th
                                                            00z, 5 February showing the intense
                                                            depression to the south west of the UK
                                                            (left panel) and the expected chart for
                                                                   th
                                                            00z, 8 February showing the potential
                                                            for an equally severe storm (right
                                                            panel).

                                              8
© Crown copyright 2014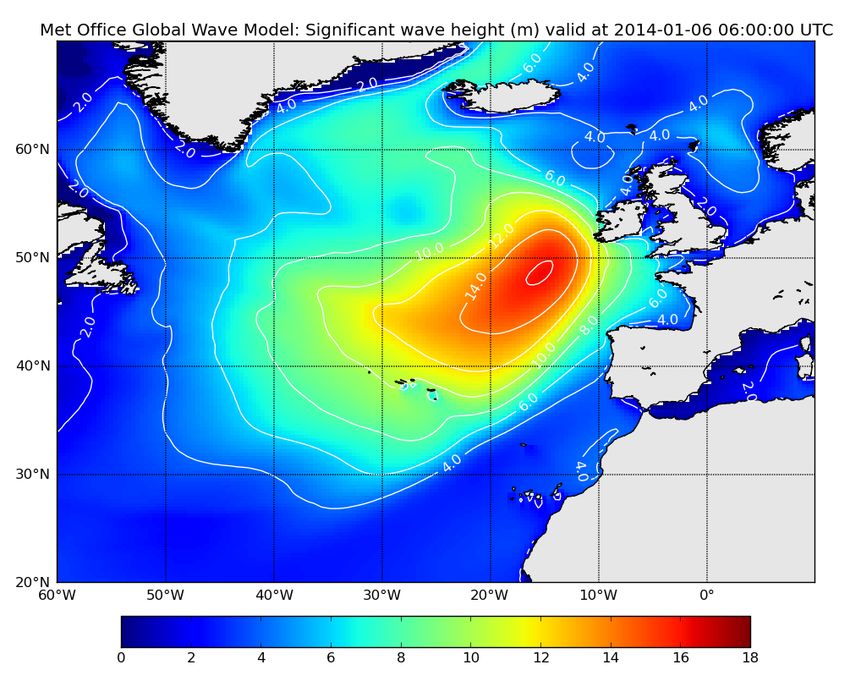
Record -breaking Flooding
The exceptional run of severe winter storms which carried with them large amounts of rain
led to very serious flooding across southern England. With catchments across most of the
UK saturated by mid-December, the full gamut of flood manifestations – tidal, pluvial (flash),
fluvial and groundwater – were experienced over the ensuing seven to eight weeks.
Initially, the focus was on tidal flooding. In the first week of December, eastern and southern
England experienced their highest storm surge since the extensive tidal flooding in January
1953. The flooding, whilst extensive, was considerably less than the 1953 event (1953: 307
deaths, 24,000 properties and 65,000 hectares compared with 2013: 0 flood related deaths,
1,400 properties and 6,800 hectares) due to the warning, response and flood defences put in
place by the Environment Agency and others since 1953.
The damage was moderate in comparison to that major disaster, but substantial evacuations
were required (e.g. in Boston, Lincolnshire) and the ingress of seawater damaged a number
of important wetlands (e.g. Blakeney, Norfolk). High tides, exacerbated by intense low
pressure systems and frequent strong south-westerly winds, continued to contribute to
coastal and estuarine flood risk well into 2014.
Thereafter, the second half of December and early January witnessed a succession of very
deep cyclonic systems. Particularly influential in the hydrological context was the system
which brought notable rainfall totals (>30 mm, with some exceptionally high totals in western
uplands) to many areas on the 23rd/24th December. This triggered flash flooding, particularly
in south-west England, and a steep increase in river flows across most of the UK. Estimated
outflows from Great Britain remained close to the highest ever recorded during late
December (Figure 8) and, subsequently, throughout most of January across large parts of
England and Wales (Figure 9).

                     3   -1
Figure 8: Outflows (m s ; black) from Great Britain in 2013, plotted against period of record (1961-
2013) daily maximum flows (blue), daily minimum flows (pink) and mean daily flows (grey)
Relative to the average, runoff rates were generally most outstanding across southern and
central England and the singular nature of this episode is well illustrated by flow patterns on
the Thames. In a series from 1883, flows at Kingston (close to the tidal limit) remained
above 275 m3 s-1 for longer than in any previous flood episode (Table 1), and continue to
exceed this threshold into early February. Correspondingly, floodplain inundations were

                                                 9
© Crown copyright 2014
extensive and protracted, owing to the succession of low pressure systems producing rainfall
over saturated ground. A preliminary analysis suggest that outflows aggregated over six
weeks were the greatest since the 1947 floods – the most extensive in England and Wales
during the 20th century.
3 -1
Figure 9: Combined flows (m s ; black) for the Thames, Severn, Trent, Yorkshire Ouse and Usk in
2013 and January 2014, plotted against period of record (1969-2013) daily maximum flows (blue),
daily minimum flows (pink) and daily mean flows (grey)
No. of consecutive Highest flow
Start Date End Date days >275 m3 s-1 (m3 s-1)
24/12/2013 31/01/2014 39* 477
12/03/1947 08/04/1947 28 714
01/02/1904 23/02/1904 23 517
18/03/1916 06/04/1916 20 373
04/12/2000 21/12/2000 18 450
20/01/1995 06/02/1995 18 385
31/01/1990 17/02/1990 18 427
17/01/1939 03/02/1939 18 369
01/12/1929 18/12/1929 18 552
30/12/1914 15/01/1915 17 585
3 -1
* 2013/14 flows remain above 275 m s at month-end
Table 1: Long duration high flow events on the Thames at Kingston (1883-2014)
In December and January, a few rivers (including the Mole, Wey and Medway, which, on the
basis of preliminary data, recorded their highest flows since the extreme floods of September
1968) registered outstanding maximum flows. However, generally, the peak flows registered
during the recent flooding were not extreme. On the Thames the highest flow in 2014 has
been exceeded during 14 earlier floods (most prior to 1950; Figure 10).
The floodplain inundations caused major disruption to transport, agriculture and restricted
sporting and recreational activities, and resulted in severe difficulties for some low-lying
hamlets (most notably in the Somerset Levels). However, given the overall volume of runoff,
the amount of property flooding at the national scale was relatively modest.
10
© Crown copyright 20143 -1
Figure 10: Naturalised daily flows (m s ; black) for the Thames at Kingston (1883-2014), compared
against peak flow in December 2013 / January 2014 (red line)
Groundwater levels were generally below the seasonal average at the end of the autumn in
2013, but as infiltration rates increased markedly through December, the recovery in
groundwater levels was dramatic in many aquifer outcrop areas – the southern Chalk in
particular. At Tilshead, on Salisbury Plain, levels rose by 20 metres in around a fortnight and
the well was artesian by late January (Figure 11). In Sussex the Chilgrove House well was
also overflowing – there have been around six similar artesian episodes in a record
extending back to 1836. As a consequence, examples of groundwater flooding, first noted in
mid-December (e.g. in Dorset and Hampshire), became increasingly common in vulnerable
areas (e.g. South Downs and Berkshire Downs) with an expectation that more widespread
flooding will occur as groundwater levels rise in the slower-responding aquifers (e.g. the
Chilterns).
Figure 11: Groundwater
levels (m aOD; black) at
Tilshead, plotted against
period of record (1966-
2013) maximum (blue),
minimum (pink) and mean
(grey) levels
Soils are likely to remain close to saturation into the early spring, continuing the risk of
floodplain inundations in response to even moderate amounts of rainfall. The lagged
response of groundwater levels to the persistent rainfall is likely to contribute to further
flooding in vulnerable aquifer areas of southern England.
11
© Crown copyright 2014Global Context of recent UK Weather
The exceptional weather experienced over the UK in December and January was part of a
hemispheric pattern of severe weather. This included exceptionally low temperatures across
Canada and the US from the mid-west to the eastern seaboard and reaching as far south as
Texas (Figure 12). The peak of this cold event occurred on the 5th and 6th January, coinciding
with the storminess over the UK. Early estimates suggest that in the US alone over 200
million people were affected with costs in excess of $5bn.
Figure 12: Surface air temperature
0
anomalies ( C) for the first week of
January 2014 compared to the long-
term climatology for 1981-2010.
These extreme weather events on both sides of the Atlantic were embedded in a persistent
pattern of perturbations to the upper tropospheric jet stream2 (Figure 13). The climatological
distribution of the winter jet streams (Figure 13, left panels) shows the well-known Asian-
Pacific jet stream, which extends across North Africa and out into the North West Pacific,
close to Japan. A second jet stream forms over the US, extending in a north-easterly
direction across the North Atlantic towards the UK. The North Atlantic jet stream acts to steer
weather systems towards the UK, but there also exists a symbiotic relationship between the
jet stream and the depressions that form on its flanks. The jet stream provides the
atmospheric conditions that are favourable for cyclogenesis (the formation of depressions),
but it also depends on the momentum from the depressions to maintain its own strength. So
it is possible on occasions to observe a strengthening of the jet stream when there is a
particularly active sequence of depressions, as was the case in December 2013 and January
2014 (Figure 13, right panels).
During December and January 2013/14 the pattern of winds over the North East Pacific and
North America was very disturbed (Figure 13, right panels). The North Pacific jet was
deflected a long way north, with a secondary branch extending southwards into the tropical
Pacific accentuating the separation of the Pacific and Atlantic jet streams. The effects of this
over North America and into the North Atlantic were profound. The deflection of the jet to the
north led to colder air being carried south over Canada and the northern US (as seen in
Figure 13) to enter the North Atlantic jet and establish a stronger than normal temperature
2
The jet stream describes ribbons of strong westerly winds high in the atmosphere, typically between
200 and 300mb that circumnavigate the northern and southern mid-latitudes. In the northern
hemisphere, in particular, the jet stream is broken up into segments by the effects of mountains, land
masses and planetary scale waves that are generated by large scale changes in tropical weather
associated, for example, with El Nino.
12
© Crown copyright 2014gradient at the entrance of the North Atlantic Jet. This acted to strengthen the jet and provide
the conditions for active cyclogenesis, which in turn led to a sequence of strong storms
across the UK throughout December and January. As Figure 13 indicates, the North Atlantic
jet was, on average, as much as 30% stronger than normal. Similar, but weaker, conditions
can be seen in the southern hemisphere, mirroring those to the north and supporting the
view that the tropics were driving at least some of what has been experienced this winter.
Figure 13: Climatological distribution of the winds in the upper troposphere at 250mb during December
and January (left panels) and the actual distribution during December 2013 and January 2014 (right
panels). Vectors show the direction of the winds and the colours indicate the strength of the winds
(m/s).
In the lower troposphere, at 850mb (Figure 14), the winds over the North Atlantic were much
stronger than normal during December and January 2013/14. Likewise the perturbed flow
over the North Pacific is also very clear with an anomalous anticyclonic system off the west
coast of North America, which has been a persistent feature of this winter’s weather. At these
lower levels in the atmosphere, the clash between the cold northerly airstream from North
America with the warm, moist airstream from the tropical Atlantic is notable (see circled
areas on Figure 14). Not only would this act to invigorate storms forming on the jet stream,
but the inflow of warm, moist air from the tropics would enhance the moisture being carried
by the storm systems and potentially lead to higher rainfall downstream over the UK.
13
© Crown copyright 2014Figure 14: Climatological distribution of the winds in the lower troposphere at 850mb during December
and January (left panels) and the actual distribution during December 2013 and January 2014 (right
panels). Vectors show the direction of the winds and the colours indicate the strength of the winds
(m/s). Red oval highlights the convergence of cold air from the north and warm air from the tropical
Atlantic at the beginning of the storm track over the North Atlantic.
It is clear from Figures 13 and 14 that there is a strong association between the stormy
weather experienced in the UK during December and January 2013/14 and the up-stream
perturbations to the jet stream over North America and the North Pacific. So what might be
the drivers of the changes over the Pacific?
It is well understood that El Nino and its cold counterpart La Nina have major effects on
weather patterns around the globe3. Indeed the changes in the jet stream over the North
Pacific, described above, are typical of what is observed during La Nina events (Figure 15),
with the jet being deflected to the north by anomalously high pressure off the western
seaboard of the US, and with a variable jet to the south along which disturbed weather forms.
The polar jet stream is then deflected a long way south over the US bringing cold air with it
3
La Nina corresponds to the cold phase of El Nino Southern Oscillation (ENSO) cycle in which sea
surface temperatures along the Peruvian coast and across the equatorial East Pacific are colder than
normal; concurrently sea surface temperatures in the West Pacific tend to be warmer than normal.
This change in the pattern of sea surface temperatures drives more rainfall and active weather
systems over the warm waters of the West Pacific and Indonesian seas, and the global effects are felt
as far as the UK through teleconnections involving changes in planetary waves and hence the position
of the jet stream.
14
© Crown copyright 2014before re-joining the southern branch of the Pacific jet stream at the start of the North Atlantic
jet stream, essentially as described in Figure 13 for December and January 2013/14.
It is reasonable therefore to argue that the weather that the UK has experienced has its roots
in the tropics. However, the current sea surface temperature anomalies (Figure 16, left
panel) suggest that neither El Nino nor La Nina were active, with temperatures in the
equatorial East Pacific Ocean being close to normal. The West Pacific remains anomalously
warm, as it has done for much of the past decade. Elsewhere in the Pacific the patterns of
sea surface temperature anomalies still display elements of the negative phase of the Pacific
Decadal Oscillation (PDO) that has contributed to the recent pause in global surface
warming4. Likewise the very warm waters in the North Pacific (Figure 16) are a result of the
systematic weakening of the Aleutian Low during the last decade, driven by the negative
phase of the PDO.
Figure 15: Schematic of the effects of La Nina on
the Pacific jet stream and on the position of the
polar jet stream over North America.
In the North Atlantic, ocean temperatures continue to be above normal near 300N which
would also contribute to a strengthened north-south temperature gradient across the storm
track, aiding the development of storms. As Figure 16 shows, the sub-tropical Atlantic is
currently warmer than the average for the last 30 years (1981-2010), but substantially
warmer than it was 30 years prior to that (1951-1980). This in itself will potentially increase
the moisture being held in the atmosphere, above the ocean, and entering the storm systems
as they moved towards the UK.
In terms of the global influences of El Nino/La Nina, it is the changes in tropical rainfall
patterns that ultimately drive the perturbations to the atmospheric circulation described by
Figure 15. So whilst the sea surface temperatures suggest neutral conditions in the tropical
East Pacific, it seems that tropical rainfall patterns in December and January are consistent
with a La Nina signal, with higher than normal rainfall over the West Pacific, Indonesia and
the eastern Indian Ocean throughout December and January (Figure 17). Bearing in mind
that the average rainfall in this region is between 8 and 12 mm/day, these anomalies in
rainfall are substantial. This distribution of rainfall across the tropical Pacific is consistent with
the warmer than normal sea surface temperatures in the tropical West Pacific (Figure 16, left
panel).
4
See: http://www.metoffice.gov.uk/media/pdf/q/0/Paper2_recent_pause_in_global_warming.PDF and
http://www.metoffice.gov.uk/media/pdf/1/8/decadal_forecast_2014-2018_jan2014.pdf
15
© Crown copyright 2014Figure 16: Global sea surface temperature anomalies for December 2013 against the most recent
climatology for 1981-2010 (left panel) and against the past climatology for 1951-1980.
As well as the above normal rainfall over Indonesia, Figure 17 also highlights the sequence
of disturbances entering the tropical East Pacific as part of the southern branch of the Pacific
jet stream described by Figure 15 and evident in Figure 13. Even in these monthly mean
fields it is possible to see the continuity between the disturbed weather over the tropical East
Pacific and the run of depressions that brought heavy rain to the UK throughout the winter.
Figure 17: Monthly average precipitation anomalies (mm/day) for December 2013 (left panel) and
January 2014 (right panel). The dashed line highlights the sequence of disturbances along the
southern branch of the Pacific jet and into the North Atlantic jet stream.
Taking all the evidence from the winds and the rainfall, a notable feature of this winter’s
storms is the unusual reach of the North Atlantic jet stream back into the East Pacific and the
continuous feed of disturbances from the tropical Pacific into the storm track. The
disturbances in the tropical East Pacific come, themselves, from the North Pacific, and are
16
© Crown copyright 2014able to propagate into the tropics because of the westerly winds in the upper troposphere
over the East Pacific (Figure 13); they themselves are part of the response of the winds to
the enhanced rainfall over Indonesia. Known as the westerly duct, this is an important
conduit through which the tropics and extratropics are able to interact5; in La Nina-like
conditions, as experienced this winter, the duct is stronger than normal and the propagation
of disturbances from the North Pacific more significant.
As is evident in Figure 13, the ‘buckling’ of the jet stream over the Pacific and North America
became much more pronounced during January 2014, as the precipitation anomaly over
Indonesia and the West Pacific strengthened (Figure 17). A notable feature of this
anomalous area of tropical precipitation is its northwards extent into the winter hemisphere
where it is able to interact with the North Pacific jet and generate Rossby waves6 that
propagate along the jet and act to reinforce the huge meander of the jet stream off the west
coast of North America. At the same time, Rossby waves propagate along the southern
branch of the jet stream and enter the tropical East Pacific through the westerly duct,
creating weather disturbances that can then get caught up in the entrance region of the
Atlantic jet stream.
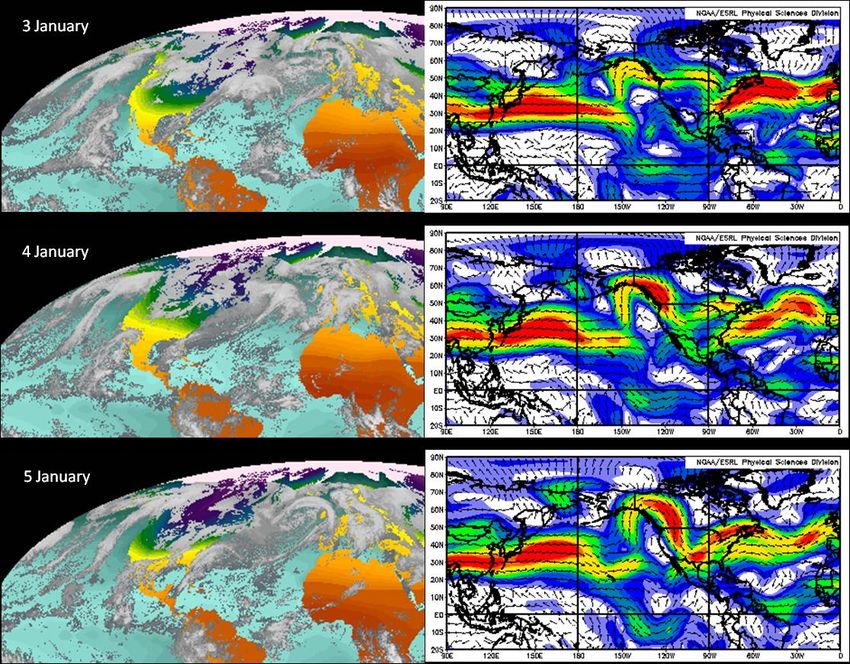
These Rossby wave interactions are very complex but appear to be fundamental to
understanding this winter’s weather. The influence of the Pacific is very clear in the days
preceding the major storm of 5/6th January. Figure 18 contains a sequence of maps from 31st
December to 5th January showing satellite infrared observations of cloudiness on the left and
250mb winds on the right. The wave disturbances entering the tropical East Pacific westerly
duct can be clearly seen in the wind fields throughout the period. These waves move into the
entrance region of the North Atlantic jet which reaches unusually far west into the tropical
Pacific. At the same time it is evident that waves are also entering the North Atlantic jet from
the north via the polar jet. The sequence of satellite imagery of cloudiness shows how these
waves translate into the development of the major cyclone over the North Atlantic by 5th
January.
What Figure 18 also demonstrates very nicely is that the jet stream is highly variable day by
day. It acts as a guide along which the Rossby waves propagate and is also strongly
influenced by those waves. Early in the sequence shown in Figure 18 the jet stream over the
North Atlantic is strong but as the major storm develops on 4th and 5th January the jet stream
weakens as the storm takes momentum from it. Understanding these complex interactions
between atmospheric waves and the jet stream is at the heart of understanding and
forecasting our weather.
5
Slingo, 1998: Extratropical forcing of tropical convection in a northern winter simulation with the
UGAMP GCM. Quarterly Journal of the Royal Meteorological Society, 124, 27–51,
DOI: 10.1002/qj.49712454503
6
Atmospheric Rossby waves describe the large scale meanders in the jet stream, of the type seen in
Figure 7, and are due to the variation in the Coriolis force as air moves north and south. The waves
were first identified 1939 by Carl-Gustaf Arvid Rossby and are fundamental to understanding the
global circulation and its natural variability. It has been known for some time that variations in tropical
heating associated with anomalous rainfall acts as a source of Rossby waves (e.g. Jin and Hoskins
1994). Furthermore, theory says that Rossby waves can only propagate where the ambient flow is
westerly. This is why the westerly duct in the tropical East Pacific is critical in bringing wave energy
into the deep tropics where it can activate weather systems and feed the Atlantic jet as described in
this paper.
17
© Crown copyright 2014st
Figure 18: Sequence of infrared satellite images and upper tropospheric winds at 250mb from 31
th
December to 5 January.
Aside from the Pacific Ocean there are other facets of the global circulation which may have
contributed to the stormy weather. Over recent years some major advances in understanding
18
© Crown copyright 2014the influence of higher levels in the atmosphere – the stratosphere – on weather patterns in
the troposphere have been achieved. Examples include last year’s very cold spring7, and the
influence of the minimum of the 11-year solar cycle on the cold winter of 2009/108. This
winter’s weather also appears to have been influenced by the stratosphere.
Above the troposphere, westerly winter winds in the polar night jet stream9 were very strong
during December and January. The polar night jet exceeded twice its normal strength at
times during the winter, reaching speeds in excess of 100ms-1 in the upper stratosphere. A
strengthening of the polar night jet often precedes periods of a strong Atlantic jet stream
below and a positive North Atlantic Oscillation pattern, as was seen during the whole
December to January period and consistent with the increased winter storminess this year.
Although internal fluctuations in the strength of the polar night jet cannot be excluded, there
has also been an external factor in the current winter, again in the tropics, that has helped to
precondition the system for a strong polar night jet. In the tropical stratosphere the winds
circulate around the globe from west to east in some years and from east to west in others.
This cycling of the tropical winds occurs roughly every two years - hence its name, the
Quasi-Biennial Oscillation (QBO). Although it may seem remote from the North Atlantic,
historical records show that when the QBO winds are westerly, this increases the chance of
the positive phase of the North Atlantic Oscillation and a strong jet stream10. The QBO has
been in an unusually strong westerly phase throughout this winter, and this factor was cited
in the Met Office October long-range outlook for the November to January period, which
pointed out the risk of increased storminess in early winter this year.
Figure 19: Climatological distribution of geopotential height (m) in the lower stratosphere at 70mb for
December to January (left panel) and the actual distribution during December to January 2013/14.
7
See http://www.metoffice.gov.uk/research/news/cold-spring-2013
8
Ineson et al. 2011: Solar forcing of winter climate variability in the Northern Hemisphere. Nature
Geoscience 4, 753–757 doi:10.1038/ngeo1282
9
Polar night jet describes the strong winds that form around the polar vortex in the upper atmosphere,
due to the strong thermal gradient created by the large cooling over the pole during the polar night.
10
Ebdon, 1975: The quasi-biennial oscillation and its association with tropospheric circulation
patterns. Meteorological Magazine, 104, 282 – 297.
Baldwin et al. 2001: The Quasi-Biennial Oscillation. Reviews of Geophysics, 39, 179-229.
19
© Crown copyright 2014With respect to the extreme cold temperatures over Canada and the US there has been a lot
of additional debate about the influence of the polar vortex. The polar vortex refers to the
persistent large-scale low pressure area situated above the North Pole in the stratosphere
during winter. It is known that when the polar vortex breaks down, the eastern US, and
indeed Western Europe, are often cold. This was the case in March 201311, when a
substantial breakdown of the polar vortex occurred and the negative phase of the Arctic
Oscillation was established, bringing exceptionally cold temperatures over the UK.
In terms of the recent extreme cold event over Canada and the US, the evidence suggests
that the polar vortex has been stronger than normal, consistent with the increased winds in
the polar night jet; the structure of the vortex has also been stretched with the core of the
vortex extending southwards over Canada (Figure 19). The extent to which this temporary
deformation of the polar vortex played a role in the recent extreme cold temperatures over
North America is unclear at present. In terms of the UK weather, the stronger than normal
polar vortex throughout the winter is an indication of a less variable and colder stratosphere
than normal and a strong polar night jet. This predisposes the circulation towards the positive
phase of the Arctic Oscillation with more stormy weather conditions over the North Atlantic
(Figure 20).
In conclusion, the evidence suggests that the Pacific Ocean has been a major driver of this
winter’s severe weather, whilst the strong polar vortex and its influence on the Arctic
Oscillation, potentially influenced by the unusually strong westerly phase of the QBO, has
also been an important contributor to the very strong North Atlantic jet stream.
Figure 20: Schematic of the positive phase of
the Arctic Oscillation, highlighting the links to the
circulation of the stratosphere.
11
See http://www.metoffice.gov.uk/research/news/cold-spring-2013
20
© Crown copyright 2014Has climate change been a contributing factor?
It is natural, with the scale of the impacts of recent stormy weather that this question is
asked, and there are three aspects that need to be considered. The first relates to the impact
of sea level rise on coastal flooding; the second relates to storminess (i.e. the number and/or
strength of the storms); and the third relates to rainfall. For rainfall this refers not only to
seasonal or monthly means, but also to the intensity and frequency of daily, and even hourly,
heavy rain events.
Sea level along the English Channel has already risen by about 12cm during the 20th
century12; this is over and above the increases associated with sinking of the southern part of
the UK due to isostatic adjustment13 from the last Ice Age. With the warming we are already
committed to over the next few decades, a further overall 11-16cm of sea level rise is likely
by 2030, relative to 1990, of which at least two-thirds will be due to the effects of climate
change14. We are very confident that sea level will continue to rise over coming decades as
the planet continues to warm, and these numbers represent our current best estimate for the
UK. Clearly sea level rise from whatever source has to be factored into discussions about
resilience to coastal and river inundations.
In seeking to answer questions about the impact of climate change on severe weather, there
are two distinct steps to be taken. The first is to detect a change in either the frequency or
intensity of storminess or rainfall events that is more than just the natural variability in UK
weather. UK weather is notoriously volatile and so detection is particularly challenging.
Severe storms have always affected the UK and are documented in many historical records.
The intensity of recent storms is unusual, as the climatological records discussed earlier
indicate, but not necessarily unprecedented.
A comprehensive study of trends in storminess, for the period 1871-2010 from an ensemble
of reanalyses by Wang et al. (2013)15 provides some important insights. They show a robust
signal of increasing numbers of strong winter cyclones and with increasing intensity for the
high latitude North Atlantic (Figure 21), covering the region to the north of the UK and
including Iceland. This is associated with a reduction in storminess further south and
supports a wide body of evidence for a poleward shift of the Atlantic storm track.
However, their analysis of changes in storminess further south over the mid-latitude North
Atlantic – the path of the recent storms – suggests a more complex signal. Although the
number of strong winter cyclones has not increased since 1871, the mean intensity has.
Notably, for very strong cyclones, the mean intensity has increased significantly. A more
comprehensive study of storms affecting the UK is needed to explore these findings in more
detail, but the current evidence does suggest an increase in storminess.
12
Wahl et al. 2013: Observed mean sea level changes around the North Sea coastline from 1800 to
present. Earth-Science Reviews, 124, 51–67.
13
Isostatic rebound refers to the rise of land masses that were depressed by the weight of ice during
the last glacial maximum. For the UK this is seen in increasing land heights over Scotland and
northern England and falling land heights (sinking) over southern regions. See Bradley et al. 2008:
Glacial isostatic adjustment of the British Isles: New constraints from GPS measurements of crustal
motion. Geophysical Journal International, doi:10.1111/j.1365-246x.2008.04033.x.
14
www.ukcip.org.uk/wordpress/wp-content/PDFs/UKCIP_sea-level.pdf
15
Wang et al. 2012: Trends and low frequency variability of extra-tropical cyclone activity in the
ensemble of twentieth century reanalysis. Climate Dynamics, 40, 2775-2800.
21
© Crown copyright 20142
Figure 21: Ensemble average series of the winter cyclone count (per 1,000,000 km ) and mean
2
intensity (10-5 hPa/km ) averaged over the high latitudes of the North Atlantic. Thick black curves are
11-year Gaussian filtered series. The grey shading indicates the 95% confidence interval of the
ensemble spread. Red lines are the 1871-2010 linear trend and the dashed green lines are the 1951-
2010 linear trend. From Wang et al. 2012.
The persistence of the recent storminess is unusual, and although clustering of storms is
quite common, the continued run of deep depressions, through December, January and on
into February, is not. It is this continued run of storms that has created the exceptional
flooding conditions experienced in the Somerset Levels, for example.
The persistence of the weather patterns affecting both the UK and also the US, where
abnormally cold conditions have continued to affect the eastern and southern states through
January, has raised questions about whether the jet stream is making greater excursions,
north and south, and whether these waves in the jet stream are becoming more locked in
one position16. This is a critical question because it raises the possibility that disruption of our
usual weather patterns may be how climate change may manifest itself. The Met Office is
now actively researching the best way to detect changes in the dynamics of the jet stream.
Beyond the clustering of storms there is also the question of whether there is a detectable
change in the amount of rain that the storms are carrying. Again this is a very difficult area
because UK rainfall is highly variable in space and time. Changes in monthly, seasonal or
annual mean amounts are difficult to detect so far, as the time series in Figure 3
demonstrates.
However, there is now some emerging evidence that, over the UK, daily heavy rain events
may be more frequent (Figure 22). What in the 1960s and 1970s might have been a 1 in 125
day event is now more likely to be a 1 in 85 day event. This supports other evidence that UK
rainfall is increasing in intensity17. This increase in the frequency/intensity of extreme daily
16
Francis and Vavrus, 2012: Evidence linking Arctic amplification to extreme weather in mid-latitudes.
Geophysical Research Letters, DOI: 10.1029/2012GL051000;
Petoukhov et al. 2013: Quasiresonant amplification of planetary waves and recent Northern
Hemisphere weather extremes. Proceedings of the National Academy of Sciences (PNAS), doi:
10.1073/pnas.1222000110.
17
Jones et al., 2012: An assessment of changes in seasonal and annual extreme rainfall in the UK
between 1961 and 2009. International Journal of Climatology, 33, 1178-1194;
Maraun et al. 2008: United Kingdom daily precipitation intensity: improved early data, error estimates
and an update from 2000 to 2006. International Journal of Climatology, 28, 833-842
22
© Crown copyright 2014rainfall events, as the planet warms and the atmosphere can hold more water, has been
discussed in the literature for a number of years18, and robust evidence for this is
increasingly seen around the world19.
Figure 22: Time series of the annual
frequency of what climate averages tell
us should be roughly 1 in 100 day heavy
rainfall events in each year. Over time,
this gives a view of the frequency of
‘extreme’ rainfall.
Furthermore, where there are sufficiently long records of hourly rainfall data, it has been
shown that rain rates potentially increase with temperature at rates that exceed the simple
thermodynamic Clausius-Clapeyron relationship (6-7% increase in humidity for 10C rise in
temperature) between temperature and humidity22 (Figure 23). This can be understood
through the dynamic amplification of rain-bearing systems, where the induced circulation
drives greater convergence of moisture into the system and hence heavier rainfall.
Figure 23: Percentiles of observed maximum
1 hour rainfall intensity (mm/hour) on a
logarithmic scale as a function of
temperature for a 99-year record from De
Bilt, The Netherlands. Solid colour lines are
the different percentiles. Grey bands, plotted
only for the 99 and 99.9th percentile, are
90% confidence intervals. Dotted lines are
the exponential relations given by 0.5 (light
grey), 1 (black) and 2 (dark red) times the
Clausius–Clapeyron relation. From Lenderink
and Van Meigaard 2008.
18
Allan and Soden, 2008: Atmospheric Warming and the Amplification of Precipitation Extremes,
Science, 321, 1481-1484, doi:10.1126/science.1160787.
19
Goswami et al., 2006: Increasing Trend of Extreme Rain Events over India in a Warming
Environmental Science, 314, 1442-1445, DOI: 10.1126/science.1132027;
Lei et al., 2011: Exploring the Interplay between Natural Decadal Variability and Anthropogenic
Climate Change in Summer Rainfall over China. Part I: Observational Evidence. J. Climate, 24, 4584–
4599, doi: http://dx.doi.org/10.1175/2010JCLI3794.1
22
Lenderink and Van Meijgaard 2008: Increase in hourly precipitation extremes beyond expectations
from temperature changes. Nature Geoscience, 1, 511–514. doi:10.1038/ngeo262
23
© Crown copyright 2014The example shown in Figure 23 is from a 99-year record of quality controlled hourly
precipitation observations at De Bilt in the Netherlands, and is therefore potentially
representative of the UK. A detailed study of UK stations with long hourly rainfall records is
urgently needed to corroborate this evidence.
Following on from the issues of detecting changes in storminess and rainfall discussed
above, the process of then attributing even some aspects of those changes to anthropogenic
climate change remains challenging. Attribution is fundamental to making the case for
climate change. It is already able to provide robust and statistically significant statements
about global and even continental temperature change23. The attribution of changes in mean
rainfall, regional climate and weather extremes is much more challenging.
The attribution method depends fundamentally on climate models in order to separate out
the effects of human-induced climate change from natural variability. Basically the models
are used as a laboratory to perform the experiment of what the climate would have been like
without anthropogenic greenhouse gases. By comparing model simulations with and without
anthropogenic greenhouse gases it is possible to identify where changes in the climate can
only be reproduced when the effects of anthropogenic greenhouse gas increases are
invoked.
For this comparison to be reliable and to provide a robust evidence-base for decision-
making, it is essential that the models are fit for the purpose. It is for this reason that model
evaluation is a critical part of the IPCC process. In terms of the global temperature record,
climate models are able to simulate the evolution of the observed record since 1860 with
considerable skill and the difference between the simulations with and without anthropogenic
greenhouse gases is statistically significant. It is this result that enabled the IPCC18 to state
that ‘It is extremely likely (95-100% certain) that human activities caused more than half of
the observed increase in global mean surface temperature from 1951 to 2010.’
It follows that to perform climate change attribution of the recent storminess and heavy
rainfall requires a climate modeling system that is able to simulate these weather systems
and their potential drivers. A limitation until recently has been model resolution (horizontal
and vertical). It is only now that the climate models are reaching a level of detail and skill that
is necessary to address the issues raised by recent events. This was demonstrated in a
seminal paper on the attribution of extreme events by US and UK scientists in 201324.
Over the last 3 years there have been major advances in Met Office capabilities in simulating
weather and climate variability25; for example, the climate model (HadGEM3) is now able to
simulate the frequency of atmospheric blocking in the Atlantic that agrees with observations.
These advances have come primarily through increased horizontal resolution (from typically
150km in the atmosphere and 10 in the ocean, to 60km and 1/40 respectively) and increased
vertical resolution (from 38 levels in the atmosphere and 40 levels in the ocean, to 85 levels
and 75 levels respectively). This has facilitated substantial progress to be made in simulating
23
See http://www.climatechange2013.org/images/report/WG1AR5_Chapter10_FINAL.pdf
24
Peterson et al. 2013: Explaining extreme events of 2013 from a climate perspective. Bulletin of the
American Met. Soc., 94, S1 – S74.
25
Scaife et al. 2011: Improved Atlantic winter blocking in a climate model, Geophysics Research
Letters, 38, DOI: 10.1029/2011GL049573;
Ineson and Scaife 2009: The role of the stratosphere in the European climate response to El Niño.
Nature Geoscience, 2, 32 - 36
Ineson et al. 2011: Solar forcing of winter climate variability in the Northern Hemisphere. Nature
Geoscience, 4, 753–757
24
© Crown copyright 2014and understanding the processes that determine the natural variability of the climate system
(such as the North Atlantic Oscillation (NAO) and El Nino/La Nina and its global influences),
and its response to factors such as solar variability and declining Arctic sea ice.
With a credible modeling system in place it should now be possible to perform scientifically
robust assessments of changes in storminess, the degree to which they are related to natural
variability and the degree to which there is a contribution from human-induced climate
change. These studies are a high priority, although they are very computationally-intensive
and require simulation of many decades of the climate to ensure a statistically significant
result.
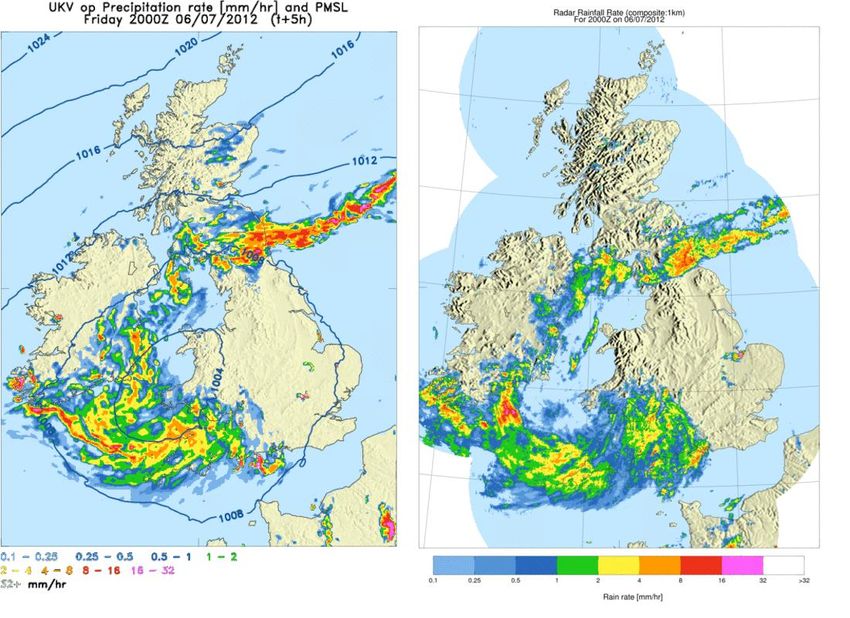
Extreme daily/hourly rainfall remains much more challenging because of the local nature of
these events. However, recent advances in modeling at the kilometre scale for UK weather
forecasting have opened up new opportunities. This model (UKV) with a grid scale of 1.5km
has delivered a step change in simulating the morphology of rainfall events, with intensity
and duration statistics that agree with radar observations (Figure 24). The utility of the UKV
model to deliver climate change impacts, related to extreme rainfall at the local and regional
scale, is already being explored and the results are very promising. This forms part of the
Met Office long-term strategy to deliver an integrated approach to risk-based assessments of
hazardous weather at the regional and local level, on all timescales, from hours to decades26.
So what can be said about rainfall in the meantime? There is an increasing body of evidence
that shows that extreme daily rainfall rates are becoming more intense, and that the rate of
increase is consistent with what is expected from fundamental physics. Although formal
attribution is still challenging, it is possible to identify a contribution from climate change for
some major flooding events, as the recent paper by Peterson et al. (2013)19 on the attribution
of extremes showed. It is worth emphasizing that there is no evidence to counter the basic
premise that a warmer world will lead to more intense daily and hourly heavy rain events.
Figure 24: Example of a 5-
hour forecast from the 1.5km
UKV model versus the radar
observations for the extreme
th
flooding event of 6/7 July
2012. Colours show
instantaneous rain rate in
mm/hour.
In terms of the impacts of changing weather and climate patterns, the cluster of drought and
flood events through the early years of the 21st century and the recent runoff and recharge
patterns, are near to the extreme range of historical variability. They therefore also raise the
26
See http://www.metoffice.gov.uk/media/pdf/a/t/Science_strategy-1.pdf
25
© Crown copyright 2014question that they may reflect anthropogenic climate change. It is important to note,
however, that differing flood types may be expected to respond differently to increasing
temperatures. Tidal flood risk is increasing as sea levels rise but the outlook is more complex
in relation to fluvial flooding.
Published studies have observed increased river flows in the winter half-year27 and a
tendency for higher flows to occur more frequently28, and this has been reinforced in recent
years. Importantly, however, such a trend may not be accompanied by any increase in
magnitude of major flood events. In the UK, no positive trend in water-year maxima was
found in the 130-year series for the Thames29.
Enhanced groundwater flood risk may be expected if average winter rainfall in the UK
increases. Flash flooding, which can be exacerbated by land management and land use
practices (particularly the extension of impermeable areas), may also increase if the recent
intensification in rainfall translates into an enduring trend.
In terms of the storms and floods of winter 2013/2014, it is not possible, yet, to give a
definitive answer on whether climate change has been a contributor or not. The
climatological context discussed earlier was unusual, with the Atlantic jet stream being more
intense and reaching further back into the tropical East Pacific than normal. Those factors in
themselves would allow warmer and moister air to enter the storm systems. It is also the
case that the sub-tropical Atlantic is now warmer than it was several decades ago and that
too would act to enhance the moisture content of the storms.
More research is urgently needed to deliver robust detection of changes in storminess and
daily/hourly rain rates. The attribution of these changes to anthropogenic global warming
requires climate models of sufficient resolution to capture storms and their associated
rainfall. Such models are now becoming available and should be deployed as soon as
possible to provide a solid evidence base for future investments in flood and coastal
defences.
27
Hannaford and Buys 2012: Trends in seasonal river flow regimes in the UK. Journal of Hydrology,
475, 158-174
28
Hannaford and Marsh 2008: High-flow and flood trends in a network of undisturbed catchments in
the UK. International Journal of Climatology, 28, 1325-1338
29
Marsh and Harvey 2012: The Thames flood series: a lack of trend in flood magnitude and a decline
in maximum levels. Hydrology Research, 43, 203-214
26
© Crown copyright 2014Paper authored by:
Met Office:
Julia Slingo
Stephen Belcher
Adam Scaife
Mark McCarthy
Andy Saulter
Kirsty McBeath
CEH:
Alan Jenkins
Chris Huntingford
Terry Marsh
Jamie Hannaford
Simon Parry
27
© Crown copyright 2014You can also read