The Relationship of the Asian Summer Monsoon to the Tropical Upper Troposphere and Lower Stratosphere
←
→
Page content transcription
If your browser does not render page correctly, please read the page content below
The Relationship of the Asian Summer
Monsoon to the Tropical Upper Troposphere
         and Lower Stratosphere
                                K. Mohanakumar

                   Department of Atmospheric Sciences
         Cochin University of Science and Technology
                    Lakeside Campus, Cochin 682016, INDIA
                 E-mail:- kmk@cusat.ac.in OR kmkcusat@gmail.com

Presented in the Fifth SPARC General Assembly at Queenstown, New Zealand during January 12-17, 2014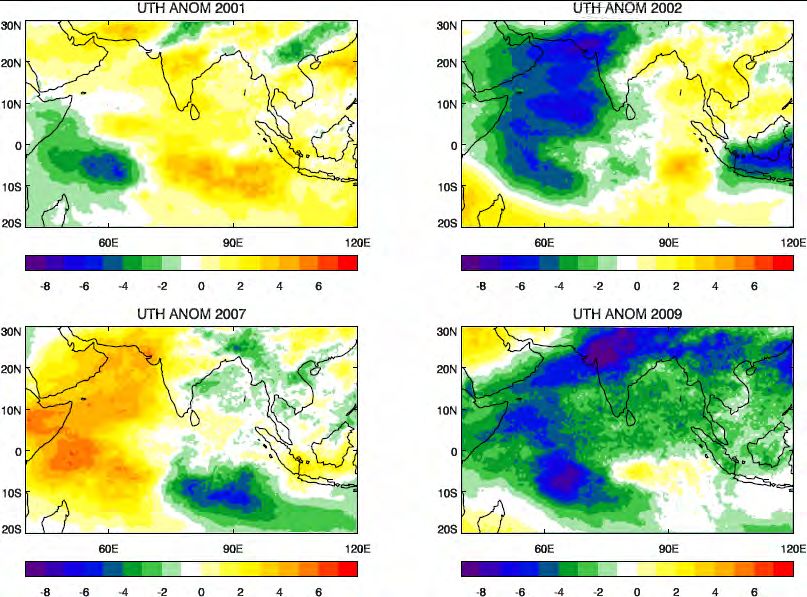
Outline

1. Asian Summer Monsoon – A Source of
 Moisture in the Lower Stratosphere.
2. Stratospheric QBO and its Influence on
  Summer Monsoon Rainfall over India
3. Effect of Global Warming on Indian Summer
  Monsoon Circulation.
ASIAN SUMMER MONSOON

Asian Summer Monsoon is a spectacular manifestation of regional
scale anomalies of the general circulation of the atmosphere.

The basic origin of the
Asian Summer Monsoon
(ASM) lies in the
differential heating of the
land and the sea during the
summer season.

The interesting feature of
the ASM circulation is the
development of the South
Asian anticyclone in the
Upper Troposphere over
Tibetan Plateau                 Asian Summer Monsoon Circulation Pattern
                              (www.tropmet.res.in/~kolli/mol/Links/index.html
Water Vapor in the UTLS over Asian summer Monsoon

The main sources of lower-
stratospheric water vapour are
the areas of deep convection in
the tropics, especially over Asian
Summer Monsoon region.

Upper tropospheric water vapor in
the monsoon region is strongly
coherent with deep convection,
both spatially and temporally.

The wetter air intrudes into the
tropical lowermost stratosphere
(LS) over the convective region
(70-180ºE, 15-35ºN) and extends
to the extra-tropical LS along the
isentropic surfaces below 380 K
around the Asian subtropical jet.
                                            Source: MetEd, UCAR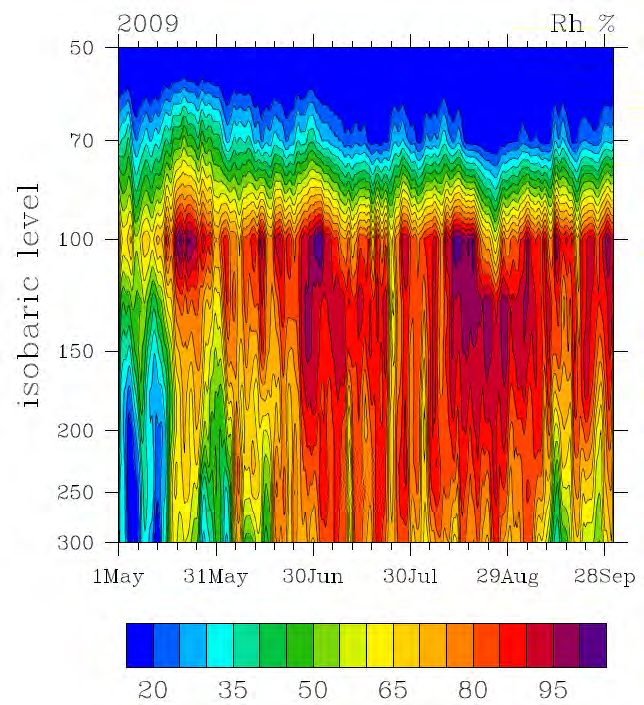
Regions of Intense Convection
Transport Pathways

                  Confinement by
                    anticyclone
             (Transport to stratosphere)

              Transport above 200 hPa
              by large-scale circulation
             (Overshooting convection)

                Convective transport
              (Main outflow near 200 hPa)

                        Park et al, JGR, 2009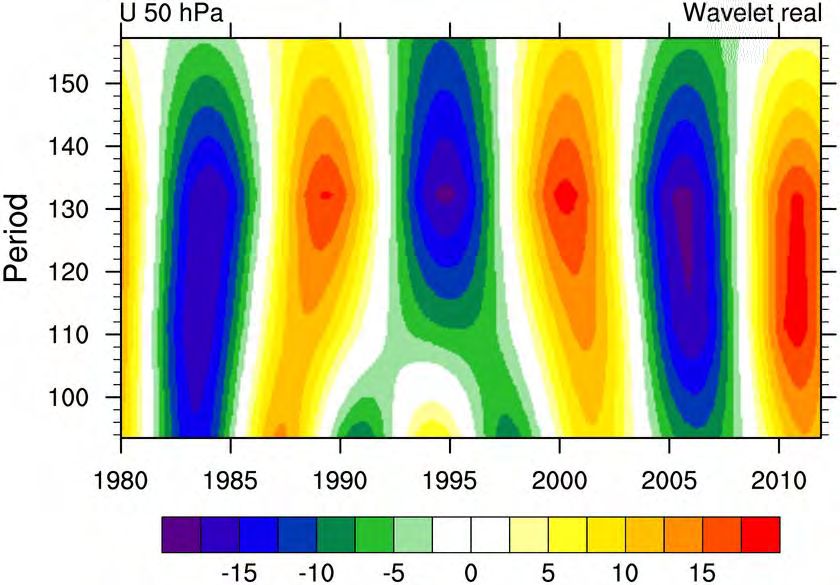
Distribution of Relative Humidity in the UTLS Region
           During a Normal Monsoon Year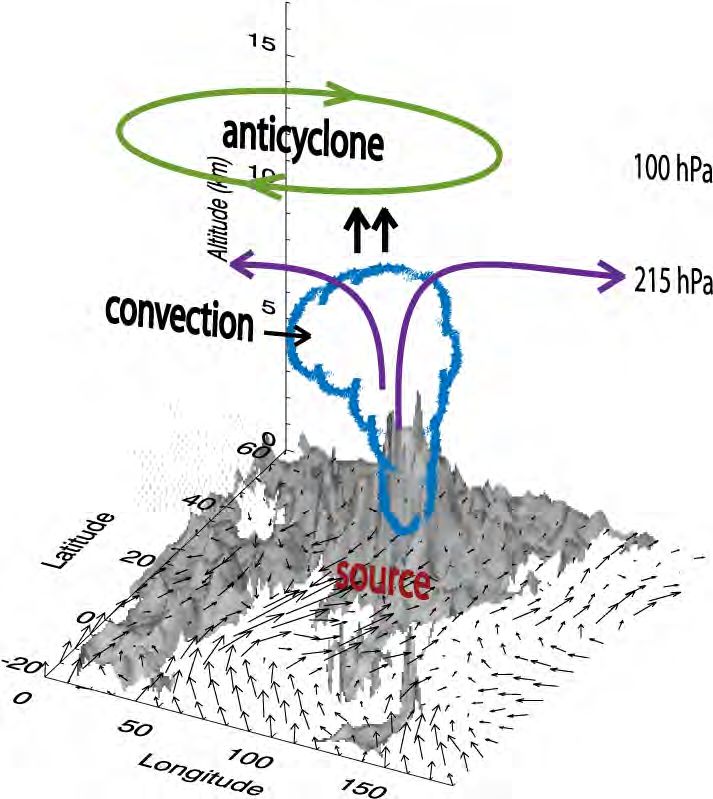
Distribution of Relative Humidity in the UTLS Region
            During a Weak Monsoon Year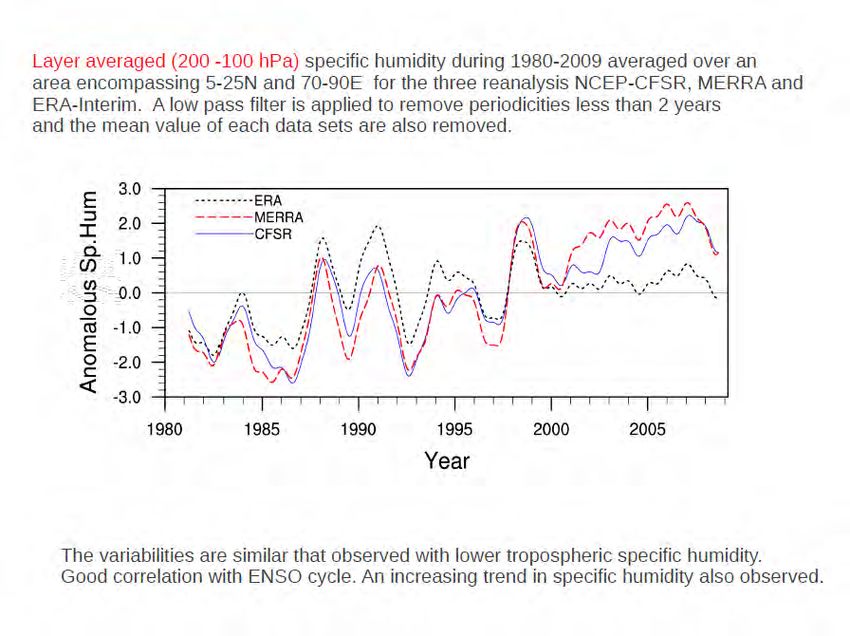
Upper Tropospheric Humidity Anomaly
During Strong and Weak Monsoon Years
Integrated Water Vapour from Surface to 300 hPa
(Lower Troposphere) over Monsoon region
Monthly mean specific humidity data filtered for periodicities less than
two years.
Strong interannaul variability is seen, especially ENSO influence.
The year following strong El Nino shows increase in water vapour.
Over the 30 year period, an increasing trend is observed in water vapour.Layer mean (100 – 30 hPa) Specific Humidity Anomaly
(Lower Stratosphere) over Monsoon region
Water vapour in the Lower stratosphere is decreasing from 1990In brief:
Moisture Transport
in to the Lower Stratosphere
HIGH LOW
PRE-MONSOON
GOOD MONSOON
POST MONSOON
NORMAL MONSOON
WEAK MONSOON
MONSOON BREAK MONSOON ACTIVEBiennial Periodicity of Summer Monsoon Rainfall
The interannual
variability of monsoon
rainfall over Asian
region shows a biennial
tendency
Strong and spatially persistent prominent peaks of 2-3 year
oscillations are observed in the monsoon rainfall pattern, referred
to as Tropospheric Biennial Oscillation (TBO).
The rainfall TBO appears as a part of the coupled Ocean-
Atmosphere system of the monsoon regionTROPOSPHERIC BIENNIAL OSCILLATION (TBO)
•TBO is the tendency of
South Asian monsoon rainfall to
‘flip-flop’ in successive years
•TBO is associated with
variations in the tropical
atmospheric circulation and SST
over the tropical oceans.
•Atmospheric convection
associated with the TBO over
the Asian–Australian monsoon
sector exhibits a characteristic
A strong TBO year
spatial structure and
monsoon season pattern
seasonality.
(Meehl et al, 2003)Intrusion of Stratospheric QBO to Troposphere Zonal wind at TBO cycle (MONSOON)
Monthly mean Zonal wind in the Lower Stratosphere Intrusion of westerlies in to the lower altitudes Weakening of easterlies after 1995 Zonal wind at 100 hPa level shows weakening of TEJ
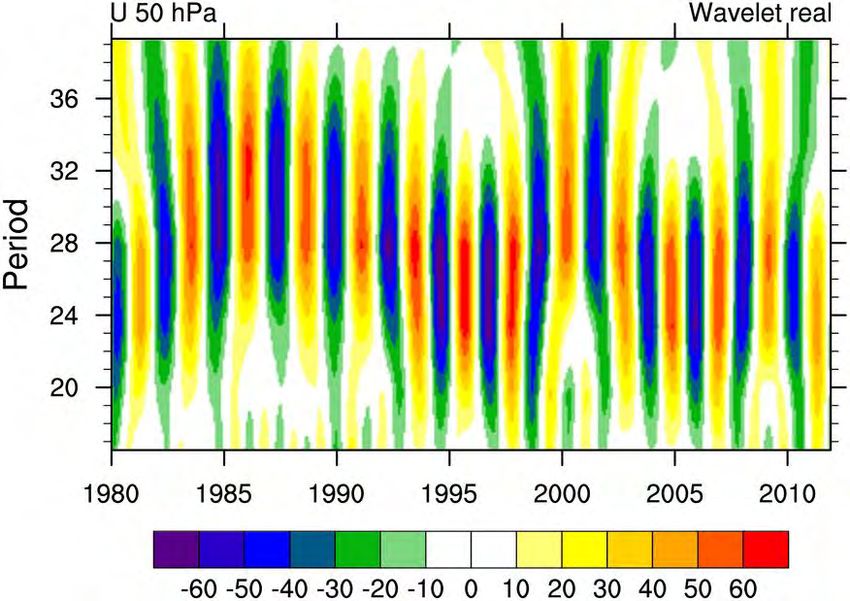
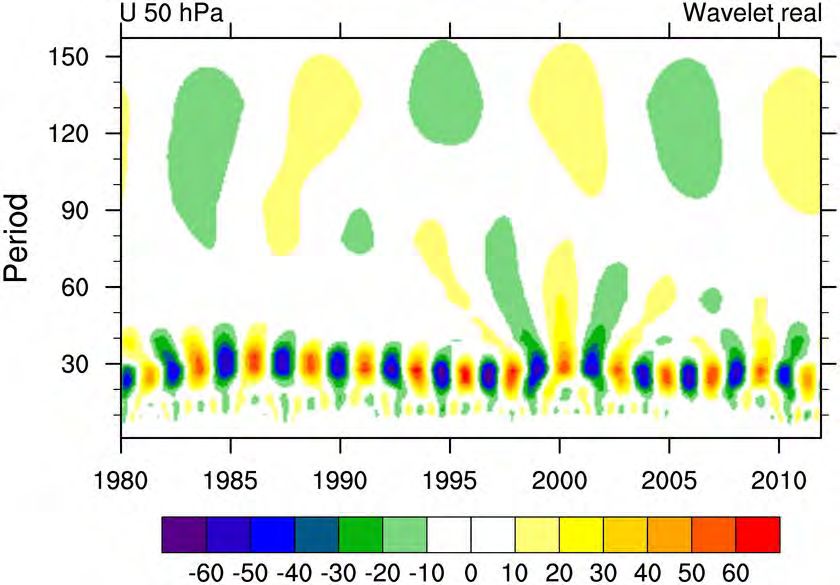
Wavelet analysis of monthly mean zonal wind averaged over
Monsoon Region zooming only to QBO periodicities
Wavelet Analysis of the monthly mean zonal wind at 50 hPa is averaged
over 5S-5N latitude and whole longitudes.
QBO (~30 months) and solar cycle (~ 130 months) signals are dominant
Wavelet Analysis for the monthly mean zonal wind at 50 hPa, averaged
over 5S-5N latitude and whole longitudes, Zooming 11-Year Solar Cycle
Vertical Zonal Wind Pattern During QBO West and
QBO East Phases Composites over Monsoon region

        QBO WEST                    QBO EAST

MONSOON-Active                MONSOON-Weak
Vertical Distribution of Zonal Wind During the Westerly
and Easterly Phases of Stratospheric QBO
E
W
TEJ
LLJComposite Difference in rainfall between East and West Phases of Stratospheric QBO
In brief:
West Phase of QBO Enhances LLJ
Increases Cloud stratification
Widespread rainfall
Small Cloud droplets
Longer duration of rainfall
East Phase of QBO Weakening of LLJ
Convective Activity dominates
Large cloud droplets
Heavy rainfall in localised regions
Short spellsZonal Wind Distribution in the Troposphere and
Stratosphere over Asian Summer Monsoon
QBO East QBO West
TEJ
LLJMonsoon Low Level Jetstream
The Somali jet occurs during the
summer over northern Madagascar
and off the coast of Somali.
The jet is most intense from June
to August with average monthly
maximum speeds of 18 ms-1 even
though daily speeds can reach the
order of 50 m s-1.
Maximum wind speed near the
northern tip of Madagascar and
Key features are: off the Somali coast.
A split in the axis of the jet over the Arabian Sea, the northern branch
intersecting the west coast of India near 17°N, while the southerly branch
moves eastward just south of India
The jet remains relatively steady from June to September before moving
southward to the southern Indian Ocean during the winter.Weakening of LLJ Seasonal mean (JJAS) zonal wind at 850 hPa averaged over Indian region (10-20N,70-90E) for the period 1980-2009. . Low pass filter is applied to remove periodicities less than three years. A decreasing wind speed is observed after 1995.
Tropical Easterly Jet (TEJ) Stream

 TEJ is an inherent feature of
 the Asian summer monsoon.

It is a belt of strong easterly
winds, which is a part of the
southern periphery of an upper
tropospheric anticyclone.

The easterly jet is observed
between 200 and 100 hPa and
has speeds often exceeding 100
knots.
The TEJ can be traced in the upper troposphere right up to the west coast
of Africa.
The location of the easterly jet moves north and south in phase with
the northward and southward movement of the monsoon trough
WEAKENING OF TROPICAL EASTERLY JETSTREAM

Decadal Mean June-September Zonal Wind at 150 hPa   Abish et al, J. Climate, 2014
Temperature Change at 200 hPa [(2000-’09) – (1950-’59)]

                                                               Recent studies (Abish et al,
                                                               2014)reported that the TEJ in
                                                               the UT region over the Asian
                                                               Summer Monsoon is
                                                               weakening.

                                                                       The Weakening of TEJ is due
                                                                       to due to the decreasing
                                                                       trend in the UT temperature
G and H denotes Subtropical Cooling and F represent Equatorial warming gradient over the Monsoon
                                                                       region.
 The UT over the equatorial Indian Ocean has warmed due to enhanced deep moist
 convection associated with the rapid warming of the Equatorial Indian Ocean.

 At the same time a cooling of in the UT region is seen over Tibetan Plateau

 This causes a decrease in meridional temperature gradient in the UT region, which
 results the weakening of TEJ                                   (Abish et al, 2014)
Inter-annual variations: Tropical Tropopause
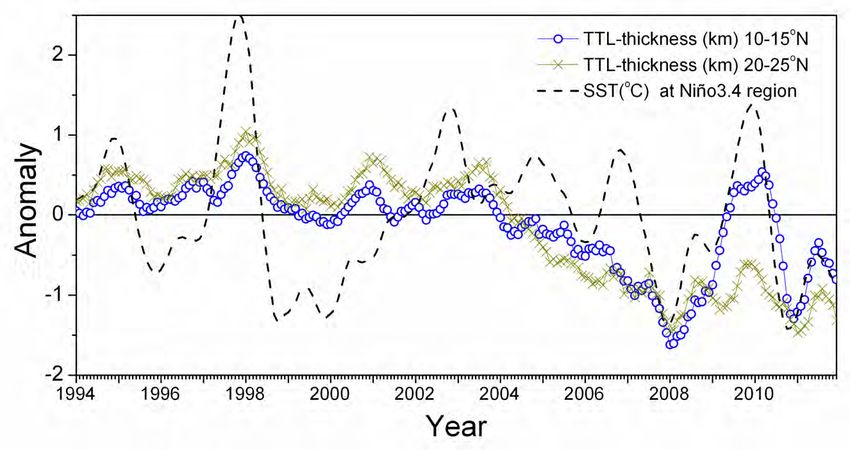
Tropical Tropopause: Relationship with ENSO
Anomaly of TTL-thickness and SST
Strong La Niña
Strong La Niña
Strong La Niña
Strong El Nino
Strong El Nino
TTL-thickness and SST anomalies show a good correspondence, most notably the crests during 1997-
1998 and 2009-2010 are associated with strong El Niño events and troughs during 2007-2008 and
2010-2011 are associated with La Niña events
Sunilkumar et al., Climate Dynamics, 2013Association Between SST and Temperatures
in the UTLS Region
An earlier study (Saini et al, 2011) using chemistry-
climate model demonstrates that the (SST) trends
are driving the zonal asymmetry in upper
tropospheric and lower stratospheric temperature
trends in tropics.
Warming SSTs in the Indian Ocean and in the warm
pool region have led to enhanced moist heating in the
upper troposphere that extends into the lower
stratosphere.
The anomalous circulation has led to zonal structure
in the ozone and water vapor trends near the
tropopause, and subsequently to less water vapor
entering the stratosphere.
Saini et al, Journal of Climate 2011The Indian summer monsoon rainfall averaged over the whole country is found to be stable over the last century, without any significant long-term trend, but is dominated by high interannual variability. This variability is generally attributed to the slowly varying surface boundary forcings of sea surface temperature, soil moisture, snow cover, and the circulation features of the upper troposphere and the mid-troposphere.
Possible Mechanism
                               Cooling in the Upper
  Rapid Warming of          Troposphere in subtropics
Equatorial Indian Ocean         including Tibetan
                                   Anticyclone

    Enhancement of
Equatorial Convection and
   Warming of Upper         Decrease in Temperature
      Troposphere            Gradient in the Upper
                                 Troposphere

                              Weakening of TEJ

  Weakening of LLJ          Weakening of Monsoon
                              Hadley Circulation
Summary Asian Summer Monsoon shows a source of water vapour to the lower stratosphere with large scale spatial and temporal variabilitiy. Stratospheric QBO seems to be modulating the monsoon circulation, by enhancing the monsoon low level jet during its westerly phase Due to the rapid warming of the Equatorial Indian Ocean and the Upper Tropospheric cooling in the Tibetan anticyclone region causes a decrease in the strength of Tropical Easterly Jetstream in the Upper Troposphere, causes a change in the Monsoon rainfall pattern.
THANK YOU
• Additional Slides
• Relationship water vapor transport from
  Indian monsoon and that over East Asia
• Water vapor transport from Indian monsoon is
  inverse to that over East Asia.
• More (less) Indian monsoon water vapor transport
  corresponds to less (more) water vapor transport
  over East Asia.
• The stronger (weaker) the Indian summer
  monsoon water vapor transport, the weaker
  (stronger) the western Pacific subtropical high in
  its southwestern part, which leads to less (more)
  water vapor transport to East Asia.
                            Zhang Renhe, Adv. Atmos. Sci., vol.18, 2001
In Active Monsoon Rainfall season, widespread rainfall, continue for longer duration, consistent rainfall, with smaller drop sizes and coming mainly from Stratoscumulus clouds. Westerly monsoon low level jet and the upper tropospheric TEJ circulation become intense and shifts northward over the Indian Subcontinent. Due to the strong horizontal circulation, the convective type of clouds are transformed into stratified clouds, which provides widespread rainfall without regional torrential/ heavy rainfall events. During the westerly phases of QBO, the LLJ become enhanced, which provide widespread rainfall.
• In weak monsoon years, rainfall is highly localised,
  short duration, heavy rainfall for short spells, with
  large raindrops, mainly from convective type of
  clouds.

• During this period, the LLJ in the lower troposphere
  and TEJ in the upper troposphere becomes weaker
  and shifts southward.

• As a result, high surface temperature with larger
  moisture content will generates intense convective
  thunder clouds, which penetrates into the lower
  stratosphere.
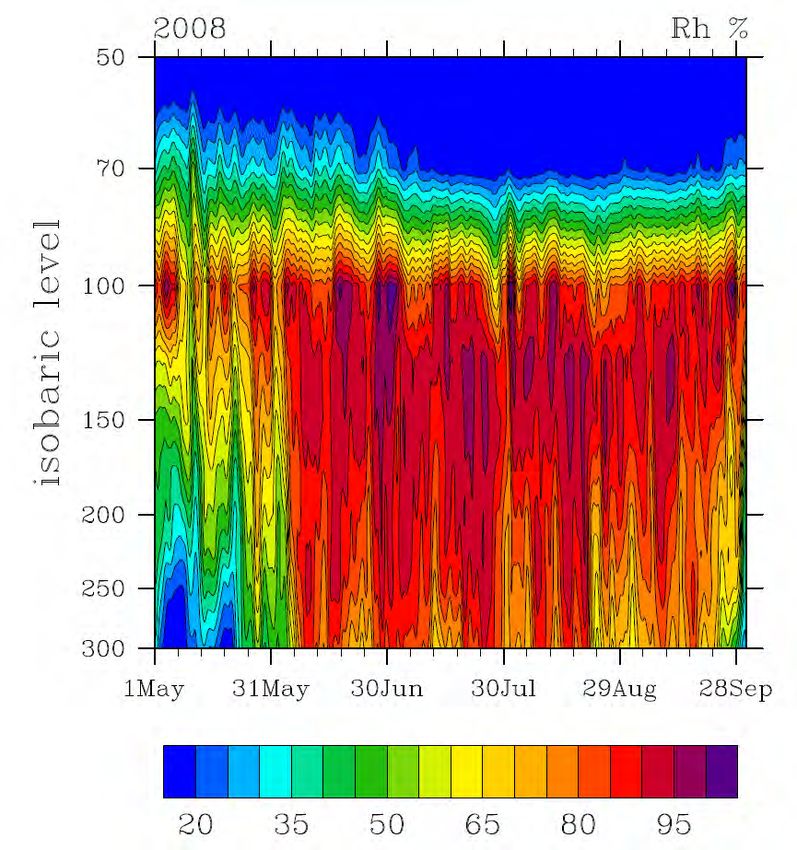
In the lower stratosphere, RH is seen to be more in the months of
May & June, the period before the monsoon sets fully over India.
Higher concentratio of RH can been in the first two months, and
shows a gradul decrease in the remaining years.

In stratospheric levels, a regular periodicity of RH changes
can be seen.

RH in certain periods show larger values in the upper
stratosphere for a short period, which repeats nearly 35--40
days. This phenomena can be verified with the 30-40 day
oscillations in the lower troposphere.

In some years, we can se see that lower stratospheric water
vaour decreases. Abrupt decrease in RH is visible in some
years.
All-India monsoon rainfall has not shown any
    increasing or decreasing trend so far
FLOOD YEARS: During the period 1871-2009, there were 19 major flood years, defined as years with AISMR in excess of one standard deviation above the mean (i.e., anomaly exceeding +10%; blue bars above): 1874, 1878, 1892, 1893, 1894, 1910, 1916, 1917, 1933, 1942, 1947, 1956, 1959, 1961, 1970, 1975, 1983, 1988, 1994. DROUGHT YEARS: During the period 1871-2009, there were 24 major drought years, defined as years with AISMR less than one standard deviation below the mean (i.e., anomaly below -10%; red bars above): 1873, 1877, 1899, 1901, 1904, 1905, 1911, 1918, 1920, 1941, 1951, 1965, 1966, 1968, 1972, 1974, 1979, 1982, 1985, 1986, 1987, 2002, 2004, 2009. It is interesting to note that there have been alternating periods extending to 3-4 decades with less and more frequent weak monsoons over India. For example, the 44-year period 1921-64 witnessed just three drought years; during such epochs, the monsoon was found to be less correlated with the ENSO. During the other periods like that of 1965-87 which had as many as 10 drought years out of 23, the monsoon was found to be strongly linked to the ENSO (Parthasarathy et al., 1991).
How the LLJ and TEJ Suppresses Convective Clouds During Monsoon?

                            TEJ

   LLJ
El Niño La Niña
Weak Mod Strong Weak Mod Strong
1952 1951 1957 1950 1955 1973
1953 1964 1965 1954 1970 1975
1958 1968 1972 1956 1998 1988
1969 1986 1982 1964 2007 1999
1976 1987 1997 1967 2010
1977 1991 1971
2004 1994 1974
2006 2002 1983
2009 1984
1995
2000
2005
2008
2011 Stratospheric water vapor showed an increase of about 0.5 parts per million by volume (ppmv) during the 1990s. After 2000, a sudden drop of 0.4 ppmv was observed, and this decrease has persisted in 2009. High resolution model computations shows that the increase in stratospheric water vapor in the 1990s led to about a 30% increase in the amount of global warming observed during that decade, and the decrease of 0.4 ppmv since 2000 led to a 25% reduction between 2000 - 2009. (Source: Jeff Masters, 2010)
Seasonal variability of water vapour in the
           Lower Stratosphere

                           Pre- and Post
                           Monsoon seasons
                           show an
                           increasing trend
                           in Moisture

                           No clear trend in
                           water vapor is
                           seen during the
                           Monsoon season.
Monthly Mean Temperature in the Lower Stratosphere
over Monsoon Region
Temperature in the LS region is decreasingYou can also read