The Relative Carbon Footprint of Cities
←
→
Page content transcription
If your browser does not render page correctly, please read the page content below
The Relative Carbon Footprint of
                           Cities

                    Nicola da Schio,
UNEP Addis Ababa (Ethiopia), urbanist@nicoladaschio.com

          Kathrine Fagerlund Brekke,
 ICLEI-Local Governments for Sustainability (Bonn,
         Germany), brekke.k.f@gmail.com

     Working papers du Programme
           Villes & Territoires
                       wppoleville@gmail.com
            http://blogs.sciences-po.fr/recherche-villes/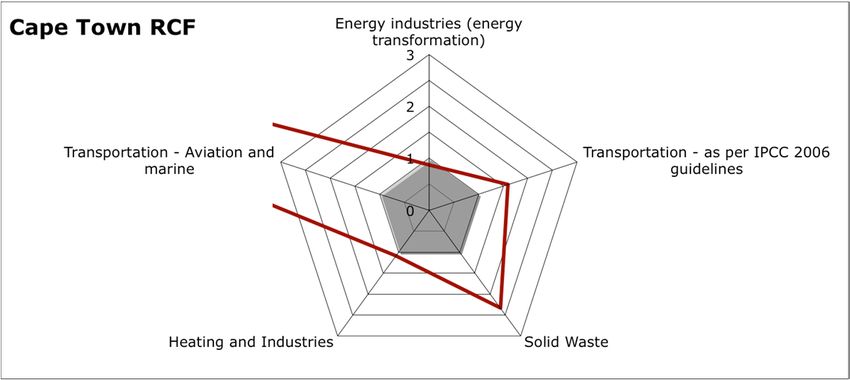
Cahiers de recherche du Programme Villes & territoires n° 2013-02
Da Schio, N. and Fagerlund Brekke, K. (2013). “The relative carbon footprint of cities”.

Abstract:

      The contribution of cities to climate change is significant, but cities are not all the same. City rankings and
comparisons should take into account that differences in the Carbon Footprint of cities can be related to different
stages of economic development, geographical conditions, social or political factors, or specific public policies –
that all shape and are shaped by national contexts. The Relative Carbon Footprint is a measure that takes these
factors into account and can be a useful a tool for both national and local urban policy makers for the
identification of strategic emissions sectors. For policy makers at the national level, the Relative Carbon
Footprint offers concrete insights on the conditions under which particular cities are a driver of national GHG
emissions or are a solution for reducing them, by highlighting the particularities of a specific urban system vis-à-
vis its national counterpart. At the city level, the RCF enables vertically integrated policy making for a city by
considering it within its national context, and provides indications on how to draw environmental priorities based
on feasibility and expected returns. In particular, the findings of our research focused on São Paulo and Cape
Town draw attention to three dimensions of influence on the Relative Carbon Footprint: the ways that energy is
produced and supplied at the city and country level (the energy matrix), the average levels of income, and the
structure of the economy of the city and the country.

Information on the authors:

Nicola da Schio holds a Master’s Degree in Urban Governance from Sciences Po Paris (Master programme
Governing the Large Metropolis), and is currently working for UNEP in Addis Ababa, Ethiopia. His research is
focused     on   urban   environmental    issues    and    on   the   governance      of   the   urban    commons.
[www.nicoladaschio.com, urbanist@nicoladaschio.com]

Kathrine Fagerlund Brekke holds a Master’s Degree in Urban Governance from Sciences Po Paris (Master
programme Governing the Large Metropolis),, and is currently working as an urban research analyst at the
world secretariat of ICLEI-Local Governments for Sustainability in Bonn, Germany. Her academic work is
focused on socio-economic, environmental and governance issues in cities mainly in Africa and Latin America.
[brekke.k.f@gmail.com]

Readers wishing to cite this document are asked to use the following form of words:

Da Schio, Nicola and Fagerlund Brekke, Kathrine (2013). “The relative carbon footprint of cities”, Working
papers du Programme Villes & territoires, 2013-02, Paris, Sciences Po

For an on-line version of this working paper and others in the series, please visit our website at:
http://blogs.sciences-po.fr/recherche-villes/

                                  Sciences Po – Programme Villes et Territoires
                                  27 rue Saint-Guillaume, 75337 Paris Cedex 07
                  Tel. : 01 45 49 50 50 / Fax. : 01 42 22 31 26 / mail : wppoleville@gmail.com
                                   http://blogs.sciences-po.fr/recherche-villes/
Cahiers de recherche du Programme Villes & territoires n° 2013-02
Da Schio, N. and Fagerlund Brekke, K. (2013). “The relative carbon footprint of cities”.
1. Introduction1
There are wide debates about whether cities are a form of human settlement that amplify or reduce the
anthropogenic impact on the environment, and whether they are to blame for climate change or not. Some cities
may be, while others not – and understanding this distinction is of key strategic importance for transformation
towards sustainable and low carbon futures. To distinguish between cities that are drivers of climate change in
their countries and other cities who help reduce their country’s per capita emissions, we must relate the measures
of a city’s environmental impact to the corresponding averages of the country in which it is located. With this goal
in mind, the present study introduces a new measure to be of use for urban climate policy making: the Relative
Carbon Footprint (RCF), given by the ratio of a city’s carbon footprint over its country’s national average.
Comparing cities worldwide based on their absolute carbon footprint does not take into account the
geographical context, the stage of economic development, the political context and other preconditions that are
shaped by a city’s national as well as local context. Regardless of its absolute level of carbon emissions, however,
a low Relative Carbon Footprint tells us that a city deserves attention from scholars and urban stakeholders as it
represents a virtuous model of a city with low carbon emissions when the national average is higher. Further, in
order to make policy relevant observations, we need exact tools for measuring the environmental impact and
carbon footprint from specific sectors, such as transportation or residential heating. We give examples here of the
potential of analysing the RCFs for specific sectors, given the limited data currently available to us, and encourage
the continued development of detailed GHG inventories. At the country level, such a tool helps drafting policy
recommendations by addressing the specificity of a city's contribution to carbon emissions given its position within
the national context.
Exploring the RCF further helps us to identify which economic, social or physical dimensions of the city to
look at in order to understand why a city performs better or worse than the country it is located in. To develop our
argument and test the potential of the RCF for pointing out areas that present certain obstacles or potentials for
climate change reduction, we will make use of two explorative and contrasted case studies: São Paulo, Brazil, and
Cape Town, South Africa. This will allow us to identify and discuss the importance of specific policies, national
contexts and relevant governance dynamics that play a role in determining the relative performance of cities, to
raise questions and suggest hypotheses to be explored further in future studies.
1
This is a further developed version of a paper presented by Nicola da Schio in Rio de Janeiro on the occasion of the
2012 UN Conference on Sustainable Development, at the side event organized by the International Society for
Ecological Economics: “ISEE 2012 - Ecological Economics and Rio+20: Challenges and Contributions for a Green
Economy”.
3/27Cahiers de recherche du Programme Villes & territoires n° 2013-02
Da Schio, N. and Fagerlund Brekke, K. (2013). “The relative carbon footprint of cities”.
2. Material and methods
2.1. The carbon footprint: existing knowledge and debates
Cities are complex social and ecological systems that interact with the rest of the world. Cities are nodes
where flows of people, energy, goods, as well as immaterial flows of ideas, money and modes of life converge. All
these activities have direct and indirect impacts on the environment, including in and outflows of solid, liquid and
gaseous matters. Different measures have been created to account for these flows2. One of them is the carbon
footprint, which measures the quantity of greenhouse gases (GHG) emitted into the atmosphere3. The carbon
footprint is surely neither the only nor the single most important dimension of a city’s impact on the environment.
However, we have adopted it as the unit of analysis for this study, as it represents one of the most significant “out-
flows” from a city with worldwide consequences. Furthermore, the level of GHG emissions, for which data are
increasingly available for cities as well as countries, can be taken as a “common currency” to which most
anthropogenic contributions to climate change are converted, allowing for quantitative analysis and correlation to
other variables.
One way of presenting a city’s carbon footprint is the compilation of GHG inventories. Hoornweg et al.4 have
recently put together what is today one of the broadest lists of comparable GHG inventories of the world’s cities,
and their respective countries. This list represents the starting point of the present research. To this date, no
consensus has been reached on any one method for allocating GHG emissions to cities, due mainly to the issue
of determining of the boundaries of analysis, as GHG emissions can either be attributed to the spatial location of
the actual release (production-based GHG inventories), or to the location of the activity that led to the GHG
release (consumption-based GHG inventories)5. An alternative methodology, albeit not very common, is to base
the attribution of the emissions on the place of residence of the individuals responsible for them6. The present
study is limited by a “production perspective”7 being based on GHG inventories that include the emissions taking
place within the city boundary and those deriving from the production of waste and of energy consumed within the
city, even if they are released elsewhere, as per ICLEI’s International Local Government GHG Emissions Analysis
Protocol8.
2
See for instance Decker et al., 2000; and Wackernagel et al., 2006:104.
3
According to the survey of the literature developed by Wiedmann and Minx on the different uses of the expression it is
broadly accepted that “carbon footprint stands for a certain amount of gaseous emissions that are relevant to climate
change and associated with human production or consumption activities” (Wiedmann, and Minx, 2008:2).
4
Hoornweg et al., 2011.
5
Vandeweghe and Kennedy, 2007.
6
See for instance Brown et al., 2008.
7
While it includes the emissions deriving from the production of goods and services that take place in a city (the only
exception being energy and waste), it does not take into account the emissions from goods and services which are
consumed inside the city but come from outside (from a “distant elsewhere” according to Rees words, 1992:121). The
use of the production perspective in this study is entirely due to data availability, and a comparison between the
different approaches goes beyond the purposes of this study. For an overview on the debate see, among others,
Dodman, 2009a; Kates et al., 1998; Ramaswami et al., 2008; Satterthwaite, 2008a.
8
See Kennedy et al., 2010.
4/27Cahiers de recherche du Programme Villes & territoires n° 2013-02
Da Schio, N. and Fagerlund Brekke, K. (2013). “The relative carbon footprint of cities”.
Looking over the literature on this theme, one of the main debates is about whether urban areas generate
higher or lower per capita emissions than suburban or rural areas. Cities are often blamed for being major
contributors to global warming through the high level of GHG emissions for which they are responsible9. The
higher level of income and the concentration of economic and social activities that characterises cities lead directly
to higher levels of energy consumption and waste generation10. However, there are also questions of population
density to take into account, and in other circumstances cities are considered to be the solution for reducing the
anthropogenic impact on the environment, as “incubators of green innovation”11, or the “greatest invention to make
us greener”12.
A different debate concerns the comparison between cities. The fact that one city has lower or higher GHG
emissions than others, mostly depends on the amount of energy consumed by the local urban activities, including
the energy used to produce electricity and the energy that is directly employed to power machines and cars, and
to heat buildings. The literature tends to explain the different performances by looking at the physical
characteristics of the city (e.g. density, building design, average temperature), or by looking at to their socio-
economic profile (e.g. income level, cultural dimension, public policy and legislation)13.
2.2. The “Relative Carbon Footprint”
As mentioned above, previous research has illustrated the peculiarity of the urban form and its potential of
magnifying or reducing the human impact on the environment. Other research has explored the variety existing
among different cities and their carbon footprint. The present study suggests a different entry point, which goes
further and combines these two perspectives. Starting from the urban GHG inventories, the unit of analysis is a
city’s Relative Carbon Footprint (RCF) defined as the ratio between a city’s level of GHG emissions per capita and
the respective national average of its host country:
Relative Carbon Footprint (RCF) =
City per capita GHG emissions (tCO2e14) / Country per capita GHG emissions (tCO2e)
Studying the RCF implies a preliminary analysis of a city’s of GHG emissions vis-à-vis the national average,
and then a comparison between cities in these terms. This perspective allows ranking different cities of the world,
while taking into consideration their national context and the potential of their specific urban profile. This goes
beyond the mere analysis of the peculiarities of the urban reality, and “localises” the analysis on specific cases. On
the other hand, it also allows measuring the potential of transforming one specific urban reality, given its economic
and geographical preconditions and the national political context in which it is embedded.
9
Clinton Climate Initiative, n.d.
10
On this topic see, among others, Dodman, 2009b:6; Glaeser, 2011; Mehaffy, 2012; UNEP, 2011; Kamal-Chaoui and
Robert, 2009; and Bai, 2002.
11
UNEP, 2011a: 464.
12
Glaeser, 2011.
13
Newman and Kenworthy 1989; Dodman, 2009b; Rickwood et al., 2008; Glaeser and Kahn, 2010; UN-Habitat, 2011;
OECD, 2010; Satterthwaite, 2008a; Walker, 2007; Glaeser and Kahn, 2008.
14
“concentration of CO2 that would cause the same amount of radiative forcing as a given mixture of CO2 and other
GHG” – IPCC, 2001.
5/27Cahiers de recherche du Programme Villes & territoires n° 2013-02
Da Schio, N. and Fagerlund Brekke, K. (2013). “The relative carbon footprint of cities”.
The RCF is a particularly relevant tool in a historical moment that sees the share of the global urban
population rapidly increasing, together with an expanding level of consumption. Understanding the conditions to
lowering or augmenting the national average becomes crucial in order to shape how these future cities will be. The
study of cities’ RCF, and the comparison between cities according to this value, can be useful to enable vertically
integrated policy making for a city’s environmental issues, which is considered in its local and national dimension.
At the national level, the RCF offers concrete insights on the conditions under which particular cities are a driver of
the national GHG emissions or are a solution for reducing them. At the local level, the RCF provides indications
towards the issues that need to be prioritised for achieving environmental goals, based on the feasibility of certain
policies and the expected returns given the national context. Local stakeholders, in fact, will find it useful to learn
from other cities and from their achievements vis-à-vis their national context, regardless of their absolute carbon
footprint, which might depend on the stage of economic development or the geographic location.
2.3. An overview of cities’ RCF worldwide
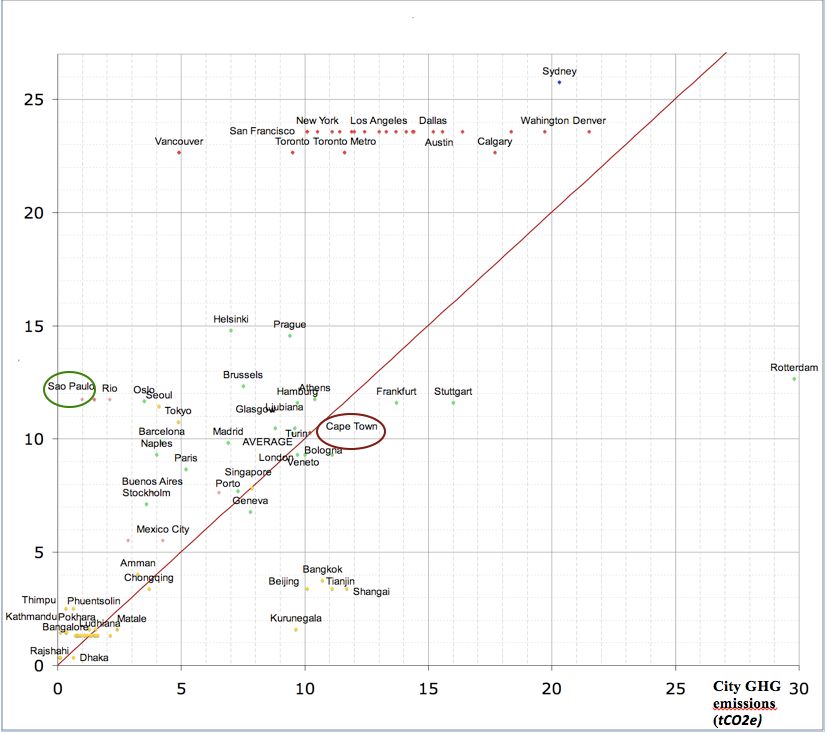
To give an overview of the RCF worldwide, the graph below (Figure 1) is an elaboration of the data from
Hoornweg et al. (2011:5-6)15. The horizontal axis reports the level of GHG emissions measured at the city level,
and the vertical axis reports the level of GHG emissions for the country in which the city is located. The graph thus
gives an immediate picture of the cities’ carbon footprints in relation to the national one, as cities to the left of the
bisector (red line) have a smaller carbon footprint than their countries, and vice-versa. We will be analysing São
Paulo and Cape Town precisely to understand why the two are located on one and the other side of the bisector.
2.4. Methodology
To begin answering the question of why certain cities let out higher levels of GHG emissions than the
national average in their country (i.e. RCF>1), while in others emission-levels are lower (i.e. RCFCahiers de recherche du Programme Villes & territoires n° 2013-02
Da Schio, N. and Fagerlund Brekke, K. (2013). “The relative carbon footprint of cities”.
Qualifying these indications – in order to later explain them – required a first analysis of the physical and socio-
economic profile of the cities as opposed to the average of their host countries. To be clear, we are not comparing
cities and countries, rather examining the local per capita CF to explain why it is different from the national, making
use of our two case studies. This is not a comparative study between São Paulo and Cape Town. The approach,
rather, has been to use the two explorative case studies as a means to present the potential of the RCF in pointing
out areas that present certain obstacles or potentials for climate change reduction, to raise questions and suggest
hypotheses to be explored further in future studies.
Figure 1 - Overview of Cities’ and Countries’ Carbon Footprint. Created by authors, using data from Hoornweg et
al., 2011.
The analysis of country and city profiles also serves as a preliminary step to look more closely at the cities
in these relative terms. When looking at the inventories of São Paulo and Cape Town, we sought to identify a
pattern for where the RCFs of the two cities differ or show similarities, and found that the discrepancies and
commonalities in their sectorial RCFs could be grouped in three dimensions, which will be presented below. In
order explain the different values of the two cities’ RCFs, a deeper analysis of these dimensions was undertaken
looking into the direct or indirect mechanisms by which they affect the RCF. A subsequent analysis of national
and city-level policies related to each dimension, and the main actors and governance dynamics involved, was
used in order to explain the current state of the sectorial RCFs and why São Paulo’s CF is below the Brazilian
7/27Cahiers de recherche du Programme Villes & territoires n° 2013-02
Da Schio, N. and Fagerlund Brekke, K. (2013). “The relative carbon footprint of cities”.
average, and Cape Town’s above the South African. This also allows the identification of dormant potentials or
obstacles for policy-makers to improve the RCF of São Paulo and Cape Town respectively.
3. Applying the RCF to two cities
In order to get closer to the drivers of the RCFs we will now look more closely at the RCF of São Paulo
whose per capita GHG emissions are lower than the national level (RCF=0.125), and of Cape Town, whose per
capita emissions are higher than the national level (RCF = 1.030). The motivations of the choice of these two cities
are diverse and concern the availability and the comparability of data on GHG emissions at the national and city
level, as well as the decision to look at two cities that hold similar demographic and economic positions in their
countries (at least in comparison to the other cities of the list), while they present different RCFs18.
3.1. São Paulo’s Relative Carbon Footprint
The per capita level of emissions of São Paulo equals 1.47 tons of CO2e per year, as opposed to the
national level of Brazil, which is 11.76 tCO2e/pc, for a RCF value of 0.125. Breaking down the overall GHG
inventory (Appendix A), the difference between the city and country per capita GHG emissions is largely explained
by looking at the value of emissions deriving from agriculture, forestry and land use. GHG emissions from these
categories account for almost 80% of the Brazilian total GHG emissions, while they are negligible in São Paulo.
The reason is to be found in the profile and range of economic activities of the city and of the country: forest
activities and agriculture (including livestock) are important components of the national geography and economy,
but they are almost absent in the city of São Paulo, as in many other urban municipalities. These two categories
represent an important but not sufficient explanation of why São Paulo has a per capita level of GHG emissions
that is lower than Brazil. Even if these two categories were not included, the per capita carbon footprint of São
Paulo would still be smaller than the Brazilian (i.e. RCFCahiers de recherche du Programme Villes & territoires n° 2013-02
Da Schio, N. and Fagerlund Brekke, K. (2013). “The relative carbon footprint of cities”.
at the national level20. Finally the energy for agricultural activities accounts for 0.0003 tC02e in São Paulo vs. 0.08
tCO2e at the national level, once again, due to the fact that in São Paulo the agricultural sector is almost absent21.
There are, however, also sectors that produce a higher per capita carbon footprint in São Paolo relative to
the national average, although they are not significant enough to outweigh the elements explained above. The
building sector, for instance, accounts for 0.12 tCO2e/capita in São Paulo and for 0.10 in Brazil. In this case, the
difference might be attributed to different income levels (higher in São Paulo) leading to higher energy
consumption, or to a different average number of dwellers per residential unit (3.43 person/unit in São Paulo vs.
3.75 in Brazil in 2000)22. Also, the per capita emissions deriving from the transport-related energy consumption are
higher in the city than in the country (0.79 and 0.73 tC02e respectively). This is probably due to the much higher
rate of car ownership in the city (520 per 1000 inhabitants) than in the country (131 per 1000 inhabitants)23. Finally,
emissions related to the waste disposal sector are 1.4 times higher in São Paulo than the national value (0.35 vs.
0.25 tCO2e/capita), probably because of the larger generation of waste (1.4 vs. 0.9 kg per day/capita)24. At the
country level, moreover, it is estimated that 32.83% of the waste was recovered in 2000, as opposed to the city,
where virtually all waste was sent to landfills25.
The graph below (Figure 2) shows the composition of São Paulo’s RCF, marked by the green line. The grey
area represents the values RCF1). This,
we may note, is only the case in a few sectors.
20
SVMA, 2005, for São Paulo; and MME, 2003, for Brazil.
21
As the ‘fugitive emissions’ were not calculated at the city level, an estimation has been made based on the national
value. For this reason, the total value result to be different than the city GHG inventory. In this section, the comparison
is carried on only for what concerns the ‘fuel combustion’ sub-category.
22
IBGE, 2010.
23
SVMA, 2005, for São Paulo; and databank.worldbank.org, 2012, for Brazil.
24
UNEP and PMSP 2004, for São Paulo; and stats.oecd.org, 2012, for Brazil.
25
Data from UNEP 2003, for São Paulo; and stats.oecd.org, 2012, for Brazil.
9/27Cahiers de recherche du Programme Villes & territoires n° 2013-02
Da Schio, N. and Fagerlund Brekke, K. (2013). “The relative carbon footprint of cities”.
Figure 2: São Paulo Relative Carbon Footprint
3.2. Cape Town’s Relative Carbon Footprint26
Cape Town’s GHG emissions amount to 10.21 tons of CO2e per capita, which is equal to 103% of the
national level (9.91 tCO2e/capita)27. A careful analysis of the data, however, reveals that the two inventories
include slightly different categories, and interpreting this mismatch in different ways might lead to different results.
For this reason it is necessary to distinguish which sectors are directly comparable, and which are not. For
instance, certain sectors were not included in the inventory of Cape Town28. This does not change the overall
result (RFC>1), since, if these values were accounted for in the city’s inventory, the difference between the total
city and country level emissions would have been even greater. At the same time, the ‘marine and aviation’
category was calculated with different methodologies for the city’s and the country’s inventories29. Considering the
role of the city as a national and international transportation hub, moreover, it is likely that the per capita level of
GHG emissions related to this sector would in any case be higher than the national level. It has to be noted, that
even if none of the non-comparable sectors were included in either one of the inventories, the per capita footprint
of Cape Town would still be higher than the national one, i.e. 6.4 and 6.02 tCO2e/capita respectively30.
26
The details of Cape Town and South Africa’s GHG emissions are in Appendix B. Except when specified otherwise,
the data on South Africa come from the national GHG inventory, DEAT, 2009. Data on Cape Town the city’s GHG
inventory presented in three papers by Kennedy et al. (2009a; 2009b; 2010).
27
Comparing Cape Town’s to South Africa’s carbon footprint is a difficult task, as the GHG inventories report slightly
different variables. It has been therefore necessary to calculate again the respective values and draw a new set of
variables, by aggregating or disaggregating the data available.
28
These include: industrial processes and product use, agriculture, forestry and land use, petroleum extraction,
wastewater handling, fugitive emissions from fuels.
29
The IPCC 2006 guidelines, applied to compile the South African national inventory, recommend including, as a
memo, item GHG emissions from international aviation, including take-offs and landing and international water-borne
navigation. At the same time, the Cape Town inventory has been calculated on the basis of the total fuel loaded locally
into planes and ships “in order to include impacts from the movement of people and goods to and from the ten cities”
(Kennedy et al. 2010:4833).
30
Nonetheless, Cape Town is an environmental reference for South African cities having adopted the first local climate
action plan of the country. See, amongst others, Cartwright et al. (2012).
10/27Cahiers de recherche du Programme Villes & territoires n° 2013-02
Da Schio, N. and Fagerlund Brekke, K. (2013). “The relative carbon footprint of cities”.
As it is the case for São Paulo, carefully analysing the sectorial RCFs can help identify why Cape Town’s
per capita emissions are higher than South Africa’s. The category including buildings heating and energy for
industries, for instance, accounts for 1.15 tCO2e/capita in Cape Town and 1.07 in the whole South Africa. This is
due to a 1.7 times higher level of energy consumption in Cape Town than in South Africa, possibly due to a
difference in average incomes. The higher income of Cape Town lifts up the GHG emissions in the transportation
sector too, as it is related to a higher car ownership rate, twice as high as the national rate31, and corresponding
gasoline consumption 1.8 times as high32. This difference is likely to also reflect the fact that Cape Town suffers
from a very low degree of connectivity, making private cars by large the preferred means of transportation33.
Finally, it is difficult to compare the waste-related GHG emissions, as the two inventories have used different
methodologies34. However, it is likely that the footprint is indeed significantly higher in Cape Town, provided that
the city generates more than twice as much waste per capita than the average South African35.
The production and consumption of electricity represents the only sector where the city’s footprint is lower
than the national one (3.38 tC02e/per capita for Cape Town and 3.88 tC02e for South Africa). The difference –
Cape Town’s levels only corresponding to 87% of the South African level – is due to lower levels of energy
consumption in Cape Town. This might appear surprising, when considering that average incomes are higher in
Cape Town than nationally. Nevertheless it may be explained by the fact that countrywide, 60% of the national
electricity supply is consumed by the industrial sector36, which in Cape Town is relatively small (17% of the GDP
according to the OECD 2008), as opposed to the national level where the sector accounts for 30% of the GDP.
Another possible factor of the low per capita consumption might be the underinvestment in the electricity supply,
which has not kept the pace with demand, leading to occasional supply shortages37.
As for São Paulo, the graph below (Figure 3) shows the composition of Cape Town’s RCF, marked by the
red line. Again, the RCF surpasses 1 in the waste and transportation sectors, but we also clearly see the
importance of the “marine and aviation” sector, as described above.
31
City of Cape Town 2009, for Cape Town; and databank.worldbank.org 2012, for South Africa.
32
Kennedy et al. 2009a, for Cape Town; and databank.worldbank.org, for South Africa.
33
OECD, 2008.
34
The national inventory has been calculated using a First Order Decay (FOD) model, as described by the IPCC 2006
guidelines. Conversely, Kennedy et al. used the Total Yield Gas approach (IPCC, 1996).
35
Kennedy et al., 2010.
36
ABB Group, 2011.
37
OECD, 2008.
11/27Cahiers de recherche du Programme Villes & territoires n° 2013-02
Da Schio, N. and Fagerlund Brekke, K. (2013). “The relative carbon footprint of cities”.
Figure 3: Cape Town Relative Carbon Footprint
3.3. The RCF in three critical dimensions
The first analysis conducted above of the GHG inventory of a city and of the country in which it is located,
represents the preliminary step to understanding its RCF. The result of this analysis, in fact, allows the comparison
of a city and its RCF to other cities. The table below (Table 1) presents the RCFs of São Paulo and Cape Town
broken down by emissions sectors.
The most interesting result of the study of São Paulo and Cape Town’s RCFs is the identification of the
dimensions of a city that are necessary to explore in order to understand a city’s RCF. In both cases, in fact, all
differences between city and country can be regrouped into three macro dimensions: the energy matrix, the
income level, and the range of economic activities. The analysis of these three dimensions, e.g. the related
policies, stakeholders, and governance dynamics, will help understanding why São Paulo and Cape Town have
different RCFs.
First, we find that the sectors for which both cities are seen in Table 1 to have a low RCF (1) can be related to income-levels
and consumption patterns; i.e. certain similarities between São Paulo and Cape Town RCF are found in the
transportation sector, waste, and sub-sectors of energy (e.g. residential buildings, space heating). Higher
emissions from these sectors seem to be related to the level of per capita income, which in both cities is higher
than the national average. Although these factors alone do not explain the difference in the RCF between the two
cities, it is nonetheless interesting to examine more closely whether their policy and governance structures create
different challenges for lowering income-related RCFs.
12/27Cahiers de recherche du Programme Villes & territoires n° 2013-02
Da Schio, N. and Fagerlund Brekke, K. (2013). “The relative carbon footprint of cities”.
Table 1: Proposed clustering of the sectorial RCFs of São Paulo and Cape Town
Dimension São Paulo’s RFC by sector Cape Town’s RCF by sector*
Energy Matrix Electricity 0.481 Electricity 0.871
Fugitive Emissions 0.444 Heating and industries 1.085
Energy for Industries 0.111
Income Level Transportation 1.082 Transportation (excl. aviation..) 1.6
Waste 1.4
Solid Waste 2.333
Residential buildings 1.2
Heating and Industries 1.085
Economic Energy for Industries 0.111 Transport Aviation & Marine 14.111
Activities
Heating and industries 1.085
Agriculture /husbandry 0.002
Energy use in agriculture 0.004
LULUCF 0.001
*Certain sectors are repeated, as they might relate to several different dimensions, e.g. Cape Town’s Heating and
Industries sector. Source: elaborated by authors.
All other differences in GHG inventories relate to differences in economic activities at the city and at the
country level, i.e. the structure of the local economies vis-à-vis their national counterparts. For the case of São
Paulo, this is evident when looking at sectors such as “agriculture/husbandry” or LULUCF, which largely explain
the gap between the local and national carbon footprint. The different emissions from the ‘marine and aviation’
sector produce an opposite result in Cape Town. The range of economic activities, yet, also explains other smaller
differences, such as those found in the industrial profile of both cities and countries.
The most interesting result of the study of São Paulo and Cape Town’s RCFs is the identification of the
dimensions of a city that are necessary to explore in order to understand a city’s RCF. In both cases, in fact, all
differences between city and country can be regrouped into three macro dimensions: the energy matrix, the
income level, and the range of economic activities. The analysis of these three dimensions, e.g. the related
policies, stakeholders, and governance dynamics, will help understanding why São Paulo and Cape Town have
different RCFs.
First, we find that the sectors for which both cities are seen in Table 1 to have a low RCF (Cahiers de recherche du Programme Villes & territoires n° 2013-02
Da Schio, N. and Fagerlund Brekke, K. (2013). “The relative carbon footprint of cities”.
Secondly, we find that the sectors for which both cities’ RCFs are high (>1) can be related to income-levels
and consumption patterns; i.e. certain similarities between São Paulo and Cape Town RCF are found in the
transportation sector, waste, and sub-sectors of energy (e.g. residential buildings, space heating). Higher
emissions from these sectors seem to be related to the level of per capita income, which in both cities is higher
than the national average. Although these factors alone do not explain the difference in the RCF between the two
cities, it is nonetheless interesting to examine more closely whether their policy and governance structures create
different challenges for lowering income-related RCFs.
All other differences in GHG inventories relate to differences in economic activities at the city and at the
country level, i.e. the structure of the local economies vis-à-vis their national counterparts. For the case of São
Paulo, this is evident when looking at sectors such as “agriculture/husbandry” or LULUCF, which largely explain
the gap between the local and national carbon footprint. The different emissions from the ‘marine and aviation’
sector produce an opposite result in Cape Town. The range of economic activities, yet, also explains other smaller
differences, such as those found in the industrial profile of both cities and countries.
4. Policies and governance in São Paulo and Cape Town
There is not a single answer explaining the different RCF values in the two cities, and the analysis of the
difference between each of the components of the national and the local inventories sheds light on where to look
in order to understand why this happens. As mentioned above, the most critical dimensions to examine are the
carbon intensity of the energy matrix; the level of per capita income and what is directly influenced by it; and the
structure of the economy. Comparable indicators and detailed data on these sectors become crucial to explain
cities’ Relative Carbon Footprint with precision and to identify virtuous city models. Understanding the policy
dynamics underlying these dimensions in a given city allows us to highlight the conditions and the possibilities for
shaping a city’s RCF. The following sections present the analysis of the policy and governance dynamics that
might contribute in shaping the characteristics of the two cities, for what concerns these three dimensions.
4.1. Energy Matrix
We have explained above how the carbon intensity of a city’s and a country’s energy matrix contributes to
determine the RCF of the two cities: in the case of São Paulo, the electricity consumed in the region presents an
emission factor that is lower than the national average. Cape Town, on the other hand, sources its electricity from
South Africa’s national grid, meaning that its electricity matrix has the same carbon intensity as the national
average. Yet, it is still relevant to look at Cape Town’s energy matrix where it differs between the city and the
country, i.e. in industrial production and for space heating purposes.
São Paulo’s performance is due to the system through which electricity is produced, transmitted and
distributed nationwide – the national grid Sistema Interligado Nacional (SIN), which covers almost the totality of the
country, and is composed of four regional subsystems that are interconnected in order to allow the exchange of
14/27Cahiers de recherche du Programme Villes & territoires n° 2013-02
Da Schio, N. and Fagerlund Brekke, K. (2013). “The relative carbon footprint of cities”.
38
energy between regions and balance temporary abundances or scarcities of energy . The energy matrix of São
Paulo’s subsystem (South-east/Centre-east), is much cleaner than the Brazilian average (emitting 33.46
39
tCO2e/GWH against the 74.73 tCO2e/GWH for Brazil ), directly affecting the value of São Paulo’s RCF. The
national government plays the central role in the management of electricity and constitutionally has exclusive
40
competence over sources, generation, transmission, distribution and pricing of energy . In particular, policies are
elaborated and overseen by the Ministry of Mines and Energy, supported by the National Council for Energy
Policy, while all the regulation and monitoring of the national grid falls is carried out by the National Electricity
41
Agency (ANEEL) . The extensive production of hydroelectricity in the region in and around São Paulo, has its
origin in authorizations given by the national government at the end of the 19th century to the Canadian company
São Paulo Tramway, Light and Power Company (Light São Paulo), which responsible for immense works along
the River Tietê – although it may have been encouraged or shaped by the São Paulo State government and other
local stakeholders. Sub-national governments have very limited possibilities to shape the city’s energy matrix and
can only influence the production and the consumption of energy through indirect solutions. The municipality of
42
São Paulo, for instance, implemented a law in 2007 to promote the use of solar water heating in the city . Such
installations do not produce energy, but simply use solar energy to heat water, and thus are not subjected to
43
national legislation and supervision .
In Cape Town, and in South Africa as a whole, the production of electricity, heat and energy for industries is
44
highly GHG intensive, due to the large use of coal, highly available and relatively cheap . The city – as mentioned
above – sources its electricity from the national grid meaning its energy matrix is approximately identical to South
Africa’s. The country has one dominant energy provider, Eskom, a state owned entity responsible for supplying
95% of the electricity in the country. While Eskom does not have exclusive generation rights, it “has a practical
45
monopoly on bulk electricity” in the whole country , the remainder coming from small inputs from local authorities.
In Cape Town, however, the share of electricity produced (or procured) by the local government is likely to
increase, with a direct impact on the carbon intensity of the electricity matrix. In fact, the need of making the city
more energy independent while lowering its level of GHG emissions has pushed the municipality to promote locally
produced renewable energy. To do so, the city has adopted the first local climate action plan of the country
(targets include 10% Renewable and Cleaner Energy Supply by 2020, and all growth in electricity demand to be
38
ANEEL 2009:30.
39
SVMA, 2005, for São Paulo; and MME, 2003, for Brazil.
40
Setzer, 2009.
41
ANEEL, 2009:34.
42
Lei nº 14.459, municipal legislation passed in June 2007 by which all new buildings in the municipality must have
solar energy installations for water heating.
43
ICLEI and IRENA, 2013.
44
Ward and Walsh 2010:3.
45
GCIS, 2008:391-392.
15/27Cahiers de recherche du Programme Villes & territoires n° 2013-02
Da Schio, N. and Fagerlund Brekke, K. (2013). “The relative carbon footprint of cities”.
met by cleaner/renewable sources) and facilitates the procurement of renewable energy (e.g. see Darling Wind
46
Farm Initiative) .
4.2. Income per capita
One of the most evident dimensions driving the GHG emissions of a city or a country is economic growth
and the average income-level of its population via the consumption patterns and resource demands enabled by
higher incomes. The high RCFs of São Paulo and Cape Town in income-level related sectors such as waste,
transportation and residential energy use are not surprising then, since both cities have average incomes more
than 3.5 times higher than their respective national averages. However, the GHG effects of higher income-levels in
47
urban areas can be magnified or neutralised by the way cities are designed, planned and governed , thus
“decoupling” increased incomes and living standards from increased GHG emissions.
The link between income-levels and GHG emissions is clearly seen in the generation and treatment of
48
waste, a sector that in São Paulo accounted for 23.7% of the total carbon footprint of the city . The City of São
Paulo, however, took action to reduce the pollutants in the waste treatment stage: the Bandeirantes Landfill Gas to
Energy Project, started operating in 2004 to collect landfill gas in order to destroy volatile organic compounds and
49
use the methane collected as a clean energy source . According to the projections made at the activation of the
project, per capita emissions from the waste sector in São Paulo should today be below the national level (98.6%
50
by 2009) , implying a current RCFCahiers de recherche du Programme Villes & territoires n° 2013-02
Da Schio, N. and Fagerlund Brekke, K. (2013). “The relative carbon footprint of cities”.
São Paulo’s RCF from the transportation sector is barely above 1, at 1.082, whereas Cape Town’s per
55
capita transportation emissions are 160% that of South Africa’s (RCF 1.6) . In both cities, this is mostly due to
56
road transportation and the predominance of journeys in private automobiles rather than public transportation . In
both countries local governments are in charge of transportation policies. Therefore, a lessening of the local CF
(and of the RCF) from transportation only seems likely if local policy-makers took strong positions and actions. For
instance, in its Comprehensive Integrated Transport Plan: 2013-2018 the City of Cape Town has set the objective
57
of having “50% of homes within 5 min of quality public transport by 2018” . In São Paulo, conversely, planned
metro extensions are highly unambitious and hugely delayed. In a policy environment where an automobile culture
and elite attitudes are ever dominant, transformation may require federal government incentives that, for example,
58
“stipulate public transportation density in the directive plans of urban development” . In both cities, changing
59
attitudes can also use the potential contribution by the private sector , e.g. encouraging diesel-run or electric
engines in Cape Town’s wide spread private collective minibus taxis.
The RCFs of our two cities are well above 1 in the emission categories “energy consumption in residential
buildings” in São Paulo (1.200), and “heating” in Cape Town (1.085)60. Through wide policy action both cities could
utilize their economies of scale and become even more energy efficient, which would reduce their RCF. Examples
61
include scaling up projects like São Paulo’s policy for solar water heaters , energy efficient lighting in public
spaces and buildings, and finally if local governments use their legislative capacity in matters of land use and real
estate development as a means to shape the characteristics of the built environment and the consequent energy
62
consumption emissions are likely to fall .
4.3. Structure of the economy
The analysis of São Paulo and of Cape Town shows that an important reason why they have different RCFs
is to be found in the structure of their economy, i.e. on whether the activities characterising the local economy are
more or less GHG intensive than the national average. Such a statement, yet, carries a certain degree of
ambiguity. A low RCF might be due to the development of local economic activities, which are genuinely climate
55
In 2005, as per IPCC 2006 guidelines, excluding marine and aviation.
56
The difference between the two cities’ transport related RFCs is probably connected to São Paulo having a very high
population density (7,216/km2), and Cape Town a much lower density (1,700/km2) as well as a more fragmented urban
form.
57
City of Cape Town, 2012: 9.
58
Gambogi Boson, 2011:134.
59
Gambogi Boson, 2011:134; and Winkler et al., 2006.
60
The category used for comparing Cape Town and South Africa in the GHG emission inventories, “heating and
industries”, comprises primarily emissions from the combustion of fossil fuels for heating purposes in buildings (e.g.,
space heating, water heating and cooking) in residential, including commercial and industrial buildings since Cape
Towns inventory only presents the sum of these as a whole.
61
ICLEI & IRENA, 2013; Winkler et al., 2006.
62
Glaeser and Kahn, 2008.
17/27Cahiers de recherche du Programme Villes & territoires n° 2013-02
Da Schio, N. and Fagerlund Brekke, K. (2013). “The relative carbon footprint of cities”.
friendly, or simply due to the fact that carbon intensive activities are located outside of the city all the while
providing it with a constant flow of vital products and materials (e.g. meat or wood). Conversely, a high RCF could
be due to a local economy characterised by large production of carbon intensive goods and services for local use,
or to the fulfilment of functions serving the whole national economy (e.g. logistic services). The GHG inventories
available for São Paulo and for Cape Town do not allow us to provide a clear answer, since they are ‘production-
based’ inventories and only capture a fraction of the economic process63. Such inventories only focus on the
production of goods and services and partially on their disposal, neglecting other stages including consumption
and extraction of resources. This necessitates a careful analysis of both local economies as opposed to the
average of their respective countries.
The range of economic activities currently carried out in São Paulo presents very different characteristics
than the national average. The city’s low carbon footprint is due to the fact that the service sector is highly
predominant, contributing to 75,4% of the city’s total value added (VA). This is followed by the industrial sector
(24.6% of total VA), and an almost entirely absent primary sector64. In Brazil, conversely, the high-emitting
industrial and primary sectors present a higher weight in the economy (27.8% and 7.4% of total VA respectively)65.
The primary sector, in particular, presents tremendously high GHG emissions, due to the continuous clearance of
large portions of forested land to provide space for soy, coffee and sugar cane farms, and one of the largest
livestock herds of the world66. A look at São Paulo’s history shows how the city has got rid of the carbon intensive
sectors that characterise the national economy. São Paulo first grew around a prosperous agricultural sector,
producing large quantities of coffee for exportation. The international crisis of the 1930s made the exports fall and
the city transformed its economy in a massive process of industrialisation to supply both internal and regional
markets67. In the past three decades the city’s economy has developed even further by moving industrial
production outside the municipal boundaries, shifting the central urban economy towards the service sector and
making it one of the most important financial centres of Latin America.
In the case of Cape Town the implications of the different economic activities for the RCF are less evident
than in São Paulo. The city’s logistics cluster, for instance, is particularly prosperous (in 2006 approximately 23.3%
of South Africa’s total cargo has gone through Cape Towns ports and airports). Thanks to its geographical position
and history, Cape Town is a major node for the national and international transportation of agricultural food
products, refined oil and steel. The large use of fossil fuel in this sector contributes to increase the city’s emissions
from transport as opposed to the national one, and therefore to increase Cape Town’s RCF. Conversely, this
element is partially outweighed by other carbon intensive sectors being underrepresented in the city’s economic
structure when compared to the national average (e.g. mining and industrial sector)68.
63
For discussion on these themes see, among others, DODMAN, 2009a and KATES et al., 1998.
64
Municipality of São Paulo website, 2012.
65
World Bank Databank, 2012.
66
globserver.com, 2012; De Faccio Carvalho, 2006.
67
Deák, 2001.
68
for Cape Town: Western Cape Government, 2006:8; for South Africa: World Bank Databank, 2012, data for 2004.
18/27Cahiers de recherche du Programme Villes & territoires n° 2013-02
Da Schio, N. and Fagerlund Brekke, K. (2013). “The relative carbon footprint of cities”.
Both São Paulo and Cape Town, while having a vibrant local economy, are deeply embedded in the
national and global economies. Both cities constantly extract resources from the whole country and beyond, and
benefit from activities that take place (and release GHG) outside the city boundaries. At the same time, they
supply goods and services consumed by the local residents as well as the outside world. While these
circumstances make it impossible to unambiguously allocate São Paulo’s and Cape Town’s emissions, the study
of the RCF provides a useful tool. The study of RCFs does not aim to place the responsibility for climate change
onto a city or a country. Rather, it helps identifying priorities for integrated policy making. By suggesting that the
carbon intensive activities are located outside the city, a RCF1 value indicates that it is a
behavioural change of local producers that might have important implications for the carbon emissions of the city
and that of its whole region of economic interaction.
5. Conclusion
Cities are increasingly where demographic, social, economic, cultural, and public policy trends are
determined. As for their role in climate change, this study has contributed towards identifying the conditions under
which cities may provide solutions for reducing their country’s total GHG emissions. We have introduced the
Relative Carbon Footprint (RCF) as a new way of ranking and comparing cities that takes into account their
preconditions for decreasing their carbon footprint, i.e. the economic, social, geographic, and political factors that
are shared and shaped by a city’s national context. Having calculated the RCFs of all cities with currently available
and comparable GHG inventories, we chose the municipalities of São Paulo and Cape Town as our explorative
case studies. Comparing the sectorial contributions to the RCF of São Paulo and to the RCF of Cape Town
brought us to our analysis of the policy conditions in three dimensions found to influence the cities’ GHG
emissions: the sources, or “matrix”, of the city’s energy supply; the level of income per capita and related
consumption behaviours; and the structure of the local economy vis-à-vis the national economy.
First, we saw that the carbon-intensity of the energy matrix will be determined by the systems through which
energy is produced, transmitted and distributed nationwide. Even in the cases when the issue lies outside the
immediate sphere of urban policy making, however, it remains an important indicator to consider. If the energy
matrix already presents a low carbon-intensity, investments and policies targeting energy efficiency are unlikely to
have high returns in terms of GHG reduction and could probably be more beneficial if targeted elsewhere. Further,
the presence of powerful private companies and lobbies is among the factors that shape the capability and will of
policy-makers to encourage low-carbon solutions for their city’s energy supply (through regulations, taxes,
subsidies, state owned enterprises etc.).
Secondly, both cities have higher than national average incomes, as well as higher GHG emissions from
the sectors directly related to income, i.e. waste, transportation, and buildings’ heating. This highlights how the
identification of a strategy for decoupling economic growth and people’s well-being from resource depletion and
69
In this sense, an interesting example is São Paulo’s “Programa Madeira é Legal” (Legal Wood Program), which
promotes the use of certified wood in the city (ICLEI, 2009b).
19/27Cahiers de recherche du Programme Villes & territoires n° 2013-02
Da Schio, N. and Fagerlund Brekke, K. (2013). “The relative carbon footprint of cities”.
environmental degradation (in this case through GHG emissions) has not yet fully occurred and needs to be of
paramount political priority. We see in both São Paulo and Cape Town that local governments have significantly
decreased waste related emissions in the treatment stage. But since there now exist numerous technological
solutions for limiting emissions already from the stage of waste generation, it becomes a political issue whether
policymakers take up the battle to change citizens’ behaviours. Similarly, the RCF confirms findings that road
transportation is one area where cities can improve their record vis-à-vis their national averages, and where there
is the population density to support widespread collective public transportation, and the economies of scale to
introduce new technologies. Further studies might find similarities between the two cities and countries, in terms of
resistance to such progressive transportation policy, that are in part explained by elitist political cultures, including
clientelism and class or race politics. Finally, for transformation in the residential energy and heating sector, there
is a lack of a certain consciousness in different governmental departments regarding the potential of ‘green
growth’ policies and the encouragement of energy-efficient construction and private retrofitting, and the cities do
not yet have significant business coalitions of green industries to pressure for support from policy-makers.
Thirdly, an important difference between São Paulo and Cape Town was found by looking at the carbon
footprints of their economies: while both cities are economically successful vis-à-vis their respective country
averages, São Paulo also seems to be a virtuous case of environmental performance. However, both cities
constantly extract resources from the whole country and beyond and benefit from activities that take place (and
release GHGs) outside their city boundaries. At the same time, they supply goods and services consumed by the
local residents as well as the outside world. It so happens that São Paulo has expelled its high-carbon economic
activities and carries out low-carbon functions for the city and the country, while in Cape Town the case is rather
the opposite. Thus, by looking at specific sectors and dynamics such as the stage of economic development in
comparative terms (i.e. relative to a country average), the RCF sheds light on the actual potentials of a specific
urban reality.
The analysis of these three dimensions shows the importance of both local and national contexts and
institutions for policy responses. When it comes to determining how greater importance might be given to the
urgency of transforming cities with low carbon solutions, political cultures matter. Explaining and identifying
virtuous examples of climate action and transformation of cities will therefore require further studies focussed on
the rationality of stakeholders, entering into their political calculus and understanding local and national urban
regimes and coalitions. Finally, the approach that has been used here, i.e. analysing the indicator of one
determinant of a city’s carbon footprint as opposed to the average in the country the city is located in, can be
developed with regard to other indicators of environmental status. The analysis of more indicators at the city level
relative to the national level helps assess the potential of one specific urban form and organisation over others,
while also allowing a new ranking of cities countrywide and worldwide.
20/27You can also read