The Research Monitor March Quarter 2017 - Shaw and Partners
←
→
Page content transcription
If your browser does not render page correctly, please read the page content below

The Research Monitor
March Quarter 2017

With the compliments of your adviser

 Content
 December Quarter 2016 Performance                             Page 3
 Meet the Research Team                                        Page 4
 Large Cap Model Portfolio                                     Page 6
 Hybrid Income Model Portfolio                                 Page 8
 Our Preferred Stocks 		                                       Page 10
     amaysim Australia (AYS)
     BHP Billiton (BHP)
     Bluglass (BLG)
     Centuria Capital (CNI)
     Henderson Group (HGG)
     Mirvac Group (MGR)
     National Veterinary Care (NVL)
     OZ Minerals (OZL)
     QBE Insurance (QBE)
     Xenith IP Group (XIP)

 Shaw and Partners
 Shaw and Partners is one of Australia’s preeminent investment and wealth management firms.

 With a national presence and $10 billion of assets under advice, Shaw and Partners offers the intimacy of a boutique
 investment firm with the resources and scale of a major financial group. We are privately owned and client focused,
 having helped our clients manage and grow their financial assets for more than 25 years. Our emphasis on integrity
 and stringent compliance standards has enabled us to achieve very high levels of client satisfaction, while unlocking
 opportunities of significant value.

 Backed by fresh thinking, robust research and some of the nation’s best investment and wealth experts, our business
 is well positioned to meet the needs of our clients. Shaw and Partners offers access to an extensive team of private
 client advisers, institutional sales and trading specialists, market leading research analysts and strategic corporate
 advisers. By working closely with our clients, we have forged long-term relationships. Whether you are a private
 investor, high net worth individual, charity, institution or corporate client, our focus is simple: listen to you then act
 according to your objectives.

 We welcome you to Shaw and Partners. Your partners in building and preserving wealth.

 2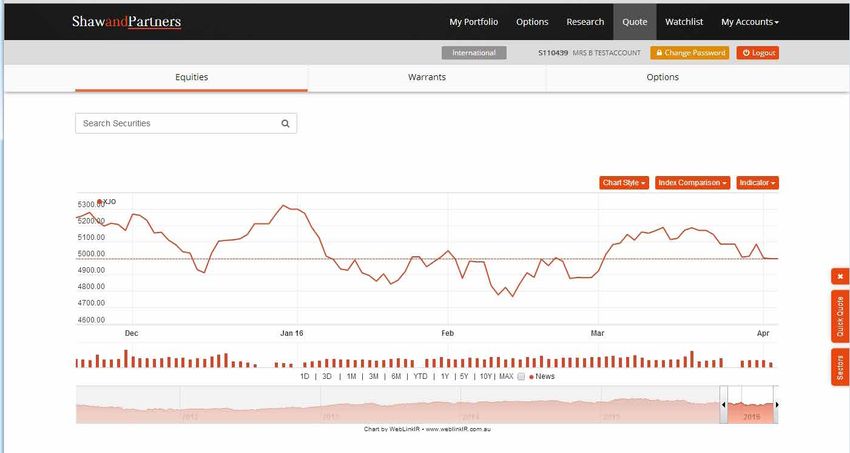
December Quarter 2016
Performance
The Australian Share Market, as measured by the S&P/ASX300 Index, rose by 4.0%
on a price basis and 4.9% on an accumulation basis during the December Quarter,
mirroring the gains of the previous quarter.

The key feature of the quarter was the surprise market                                remainder of all other stocks in the ASX300 comprised
behaviour around the US Presidential Election. Most                                   zero returns when combined together.
market commentators had figured that a Clinton victory
would be good for markets and a Trump victory would be                                Analysis of the top performers from a market perspective
bad, based mostly on an assessment of known versus                                    in the December quarter shows that a “bar-bell” approach
unknown. The expectation of a pick-up in government                                   of holding banks and resources stocks performed
spending in the United States, a higher level of economic                             particularly well.
growth, rising inflation and therefore higher interest rates                          Moving in the other direction were the Health Care and
is being built into share prices.                                                     Pharmaceutical sectors which both retreated over 8%
At a sector level, Banks and Insurance stocks were                                    for the quarter. CSL was amongst the worst performers,
the belles of the ball, up 13.8% and 16.0% inclusive                                  down 6.8%, alongside Ramsay Healthcare (RHC) down
of dividends for the quarter. The Capital Goods and                                   14.6%. The move in the 10 year bond rate from 1.91%
Utility sectors also performed well, up 10.9% and 9.2%                                to 2.70% over the quarter kept pressure on Infrastructure
respectively, including dividends. In fact, all of the returns                        stocks with Transurban (TCL) down 9.8% and Sydney
of the market for the December quarter were from six                                  Airport (SYD) down 14.4%.
stocks. CBA, WBC, BHP, ANZ, NAB and QBE. The

                                                                                                              Retailing            Media
                                               Transportation                  Utilities                       -3.5%               2.9%
                                                   -3.7%                        9.2%                          24.18bn             19.93bn
                                                  66.07bn                      42.65bn
              Materials
                7.4%                                                                                   Software & Services      Capital Goods
              280.94bn                                                                                       -2.4%                 10.9%
                                                                                                            25.45bn               20.75bn

                                                  Energy                   Pharma, Biotech
                                                   7.4%                    & Life Sciences                   Insurance         Food Beverage
                                                 76.14bn                        -8.9%                          16.0%             & Tobacco
                                                                               50.21bn                        61.94bn              -2.3%
                                                                                                                                  26.35bn

                                                Telecomm                  Health Care Equipment                   Insurance      Consumer
                                                 Services                       & Services                          16.0%         Services
               Banks                                                              -8.6%                            61.94bn         -2.1%
                                                  -4.2%
               13.8%                                                             63.84bn                                          58.05bn
                                                 80.41bn
              451.28bn

                                                                                                 Diversified Financials
                                                       Real Estate                                                            Food & Staples
                                                                                                          4.6%
                                                         -0.5%                                                                   Retailing
                                                                                                       84.57bn
                                                        138.26bn                                                                  -1.2%

Heat map legend: Size of box: market cap of sector. Colour of box: Quarterly performance (green positive, red negative).
Source: Shaw and Partners
                                                                                                                                                3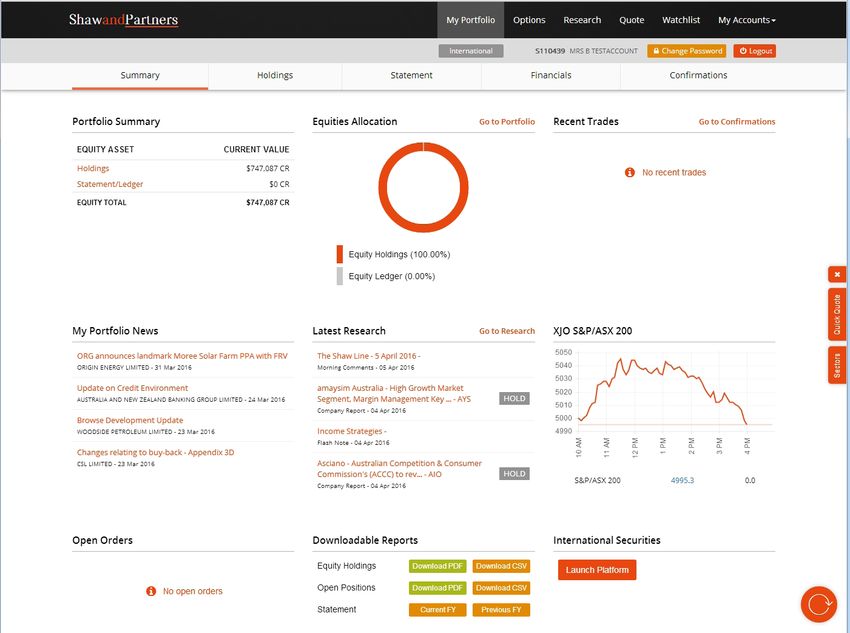
Meet the Research Team
Shaw and Partners provides coverage on more than 100 ASX listed companies which
are predominantly within the S&P/ASX200 benchmark index. A team of six research
analysts cover companies across Banks, Insurance, Telecoms, Diversified Financials,
Infrastructure, Transport, Utilities, Technology & Online, Contractors, Retailers, Life
Sciences, Travel, Metals & Mining and Real Estate sectors.

               Martin Crabb, Head of Research
               Research Management, Equity Strategy

               Martin joined Shaw in April 2011 as Head of Research. Martin is responsible for overall
               management of the research team as well as equity strategy and coverage of Diversified Financial
               Services companies. Prior to joining Shaw, Martin was an Executive Director with Macquarie
               Group where he worked for over 20 years in roles spanning institutional stockbroking, wealth
               management, research and portfolio management. Martin holds a Bachelor of Arts in Economics
               and Mathematics from the University of Melbourne, with postgraduate studies in Applied Finance.
               Martin is a Responsible Executive (ASIC).
               Coverage: BLA, EQT, FID, HFA, HGG, HHL, HUB, IFL, KAM, MFG, MGP, OFX, PAC, PPT, WBA, XIP.

               Danny Younis, Senior Analyst
               Technology / Developers & Contractors / Retailers

               Danny joined Shaw and Partners in April 2010 and covers the Industrials sector with specific focus on
               Technology, Contractors / Mining Services, and Retailers. Danny has had over 15 years’ experience
               in financial markets and stockbroking and commenced his career with CCZ Statton Equities and
               worked previously with Aegis Equities, Westpac, Commonwealth Bank and StoneBridge Group as
               Head of Research. Danny graduated with a Bachelor of Science from the University of Sydney with
               majors in Biology (Genetics) and the History & Philosophy of Science. Danny has also completed
               FINSIA’s Graduate Diploma of Applied Finance and Investment (GDipAppFin).
               Coverage: ALQ, CAR, CGL, CIM, DOW, ISD, MND, NCK, ORI, OVH, PPL, REA, SEK, SSG, UGL, WES, WOR,
               WOW, ZML.

               Darren Vincent, Senior Analyst
               Commercial Services, Life Sciences, Travel & Leisure

               Darren joined Shaw and Partners in September 2012 as a Small Company specialist. Darren has
               worked in equity markets for over 20 years, having previously worked at Credit Suisse and also
               with BNP Paribas and ANZ Stockbroking. During that time Darren has covered a wide variety of
               small industrial companies and has been recognised by his clients for his work, winning the 2010
               East Coles Small Company Analyst of the Year and placing second in the 2011 Wall Street Journal
               Asia’s Best Analysts Awards (Industrial Goods & Services). Darren holds a Bachelor of Economics
               from the Australian National University.
               Coverage: AHX, BLG, BNO, BRG, CV1, EHE, EVT, FLT, GUD, GXL, MDC, NAN, NVL, OSP, REG, RMD, SAI,
               WEB.

4
David Spotswood, Senior Analyst
Financial Services, Telecommunications

David joined Shaw in February 2012 as Senior Analyst covering the Banks, Diversified Financials,
Insurance, Media and Telecommunications companies. David has over 20 years’ experience in
the financial services industry. David previously worked as Research Officer and Economist with
the Commonwealth Treasury & Department of Finance, Research Associate with John A. Nolan
& Associates, Senior Investment Manager (Australian Equities) with HSBC Asset Management,
Investment Manager (Australian equities) Credit Suisse Asset Management, Australian Equities
Manager with Warakirri Asset Management and Institutional Research Adviser with Select Equities.
David holds a Bachelor of Economics from Flinders University and Master of Commerce with 1st
Class Honours from the University of Melbourne.
Coverage: AMP, ANZ, ASX, AYS, BEN, BOQ, CBA, CGF, CYB, IAG, MPL, MQG, MYS, NAB, NHF, QBE, SDF,
SUN, TLS, TPM, VOC, WBC.

Peter O’Connor, Senior Analyst
Metals and Mining

Peter joined Shaw and Partners in January 2015 as Senior Analyst. Peter is an experienced equities
analyst specialising in Metals and Mining sectors. Peter was most recently Managing Director, Head
of Asian Metals & Mining Team, Co-head of Global team - Equities Research at Merrill Lynch/Bank
of America. Prior to this Peter held positions as Head of Australian Metals and Mining at Deutsche
Bank, Head of Global Metals and Mining at Credit Suisse and Equities Research, Metals and Mining
at Macquarie Bank. Prior to his time as an equities research analyst, Peter held operational roles
with Rio Tinto for five years and BHP Billiton for five years. Peter has a Bachelor of Engineering
(Mining) from the University of New South Wales (First Class Honours and the University Medal).
Coverage: AWC, BHP, EVN, FMG, IGO, ILU, NCM, NST, OZL, RIO, S32, SFR, WHC, WSA.

Peter Zuk, Senior Analyst
Real Estate

Peter joined Shaw and Partners in October 2015 as Senior Analyst. Peter has over 17 years of
real estate industry experience that includes roles within financial markets, direct industry and
advisory. Previously, Peter worked as an equities analyst at Goldman Sachs where he covered the
Real Estate sector. Prior to this, he held roles at Goodman Group and KPMG where he focused on
REITs, developers and contractors. Peter has a Masters of Commerce Degree from the University
of New South Wales and is also a Chartered Accountant.
Coverage: ABP, BWP, CMA, CNI, DXS, FET, GMG, GPT, GTY, LLC, MGR, SCG, SGP, VCX.

                                                                                                5
Large Cap Model Portfolio
We update our Australian Large Cap Model Portfolio              Large Cap Model Portfolio @ 30 December 2016
following another period of outperformance, which
despite some difficulties in the Telecommunications             BHP    BHP Billiton                       8.5%
sector, saw the majority of our stock calls add                 NAB    National Australia Bank            8.1%
value. We continue to see markets as fully valued,              WBC    Westpac Banking Corp               7.8%
the macro picture muddled, and maintain a focus
                                                                CBA    Commonwealth Bank                  7.4%
on stock selection.
                                                                LLC    LendLease Group                    4.9%
Our portfolio is up 6.5% for the month, 9.4% for the            SUN    Suncorp Group                      4.7%
quarter and 13.8% for the year – ahead of the index
                                                                ORG    Origin Energy                      4.6%
during all time periods. A combination of sector selection
(no exposure to healthcare and consumer staples, plenty         ANZ    ANZ Banking Group                  4.5%
of real estate and insurance) as well as stock specific         MQG    Macquarie Group                    4.2%
performance (Iluka Resources (ILU), Suncorp Group               AMC    Amcor                              4.2%
(SUN) and REA Group (REA) as examples) contributed to
strong relative returns.                                        CYB    CYBG Plc                           4.1%
                                                                RIO    Rio Tinto                          3.9%
The S&P/ASX100 Index is trading on 17.8 times trailing
12 months earnings, an historically high level. This is fine    REA    REA Group                          3.3%
if the outlook for earnings growth is good. Consensus           MGR    Mirvac Group                       3.2%
estimates are for 11.9% growth over the next 12 months,         TLS    Telstra Corporation                3.1%
followed by 3.7% and 7.3% in the following two years.
                                                                WOW    Woolworths                         3.0%
The outlook for interest rates, Chinese growth, domestic
residential real estate, global inflation and political risk,   CGF    Challenger                         2.9%
however, are all turning into headwinds for the Australian      ILU    Iluka Resources                    2.7%
equity market.
                                                                QBE    QBE Insurance                      2.4%
We make no changes to our model portfolio this                  QAN    Qantas Airways                     2.4%
month. Our largest active positions are overweights to
                                                                FLT    Flight Centre Travel Group         2.1%
LendLease (LLC), CYBG PLC (CYB), Origin Energy (ORG)
and Suncorp Group (SUN) as well as underweights to              PPT    Perpetual                          2.0%
Wesfarmers (WES), CSL and Commonwealth Bank                     NST    Northern Star Resources            2.0%
(CBA).                                                                 Total                            100.0%
From a sector perspective, we remain overweight Materials
(+5.7%), Banks (+1.9%), Diversified Financials (+5.8%),
Insurance (+3.2%), Real Estate (+2.1%) and Media
(+2.6%). Our largest underweights are to Healthcare
(-3.5%), Pharmaceuticals (-3.2%), Utilities (-2.8%) and
Food and Staples Retailing (-2.4%).

6
Large Cap Model Portfolio now available on
                                                                                                                      Shaw Managed Accounts (see page 18)

Recommendation                                                                                              Portfolio Attribution
The strong run up in prices in the past quarter of 2016                                                     December was a good month for performance. Despite
has pushed valuations on Australian stocks to precarious                                                    a number of stocks trading ex-dividend, the portfolio
levels. Whilst gains in share prices are possible from                                                      performed strongly in a price sense, thanks to positive
current levels over the next year, we see dividend yields                                                   momentum in a number of our larger positions, notably
as providing the bulk of the return from equities. Yield                                                    the banking sector (ANZ up 8.8%, NAB up 6.2%). The
sensitive sectors have been bid up again in recognition of                                                  “overweight Iluka, underweight Fortescue” position alone
this, despite the headwind from rising long term interest                                                   added over 30bps to performance for the month, showing
rates. We suggest a neutral to underweight position to                                                      the impact of large relative moves in the resources sector.
Australian equities in a balanced portfolio setting.

To obtain the latest Shaw Model Portfolio report, please
contact your Shaw adviser.

 Portfolio Performance (Accumulation Basis)

                                                     Portfolio                     Fifty Leaders                        ASX/S&P300 Accumulation

 1.80

 1.70

 1.60

 1.50

 1.40

 1.30

 1.20

 1.10

 1.00

 0.90

 0.80
                 Oct 11

                                                     Oct 12

                                                                                         Oct 13

                                                                                                                             Oct 14

                                                                                                                                                                 Oct 15

                                                                                                                                                                                                     Oct 16
        Jul 11

                                            Jul 12

                                                                                Jul 13

                                                                                                                    Jul 14

                                                                                                                                                        Jul 15

                                                                                                                                                                                            Jul 16
                                   Apr 12

                                                                       Apr 13

                                                                                                           Apr 14

                                                                                                                                               Apr 15

                                                                                                                                                                                   Apr 16
                          Jan 12

                                                              Jan 13

                                                                                                  Jan 14

                                                                                                                                      Jan 15

                                                                                                                                                                          Jan 16

Source: Shaw and Partners

                                                                                                                                                                                                              7
Hybrid Income Model Portfolio
The Income Strategies team consists of specialised strategists dedicated to
interpreting the debt and preference share markets. With a focus on structuring
and managing listed and hybrid portfolios and blending with equities, the
team aims to maximise income, whilst simultaneously minimising the risk of
drawdown/permanent loss of capital, providing clients with thoughtful analysis
and investment opportunities.

                                                            Investment Strategy
                                                            The Shaw ASX Hybrid Income Portfolio aims to
                                                            provide investors with exposure to a highly transparent
                                                            portfolio of ASX listed debt and preference securities
                  Cameron Duncan                            that offer diversification benefits to both Australian
                  Co-Head, Income Strategies                Equities and cash/term deposit investor’s allocations.

                                                            There is a growing universe of listed assets spanning
Cameron has 30 years experience across financial            Senior Debt, Subordinated Debt, Convertible Preference
markets, including over 16 years at Macquarie Group in      Shares, Convertible Notes and Income Securities (debt
                                                            and equity). While these “Hybrid” securities each have
listed debt and hybrid advisory, syndication, proprietary
                                                            their own characteristics, research and subsequent
trading and portfolio risk management. Cameron has
                                                            implementation and monitoring allows for strategies to
a Bachelor of Economics degree from the University of
                                                            extract risk adjusted return from this sector that aims to
Sydney and has completed the Diploma of Financial           enhance a core portfolio of Australian Equities and cash.
Planning & RG146.

                                                            Investment Objectives
                                                            The objective of the Shaw Hybrid Income Portfolio is to
                                                            provide a sustainable level of income whilst seeking to
                                                            preserve capital. The target total portfolio return (gross) of
                                                            the portfolio is 3% above the RBA cash rate. This return
                  Steve Anagnos                             will be generated from a combination of cash (interest
                  Co-Head, Income Strategies                payments and dividends), franking credits and capital
                                                            growth (realised and unrealised) from an active portfolio
                                                            strategy.
Steve has 25 years experience across financial markets
and investment management in a range of Senior roles        Risk tolerance: The portfolio aims to limit the risk of
                                                            capital loss through security diversification and active
at Citigroup, Bank of America Merrill Lynch, CBA and
                                                            portfolio management. It is suitable for investors that have
Strategic Capital Management. Steve’s focus has been
                                                            a 3 year + investment horizon that can tolerate secondary
in designing and implementing portfolio strategies using
                                                            market pricing and liquidity risks through the life of the
listed debt, hybrids and equity derivatives. Steve has a    securities, up to the respective first call/maturity date of
Bachelor of Economics degree and Master of Applied          each security.
Finance degree from Macquarie University.

8
Hybrid Income Model Portfolio now available on
Shaw Managed Accounts (see page 18)
Portfolio Holdings @ 30 December 2016 – Top 5 Portfolio Highlights
ASX Code Issuer Security Type During the month of December, the portfolio generated
ANZPG ANZ Capital Note IV a Total Return (Gross) of +1.75%. 11 securities traded
ex distribution during the month, resulting in a gross
WBCPF Westpac Capital Note III
income return for the month of 1.00% and 1.05% for
MQGPB Macquarie Group Capital Note 2 the quarter.
WBCPG Westpac Capital Note IV
The total portfolio return has exceeded its return
NABPC Nat Aust Bank Capital Note objectives based on the 1 month, 3 month, and 12
month periods. The total portfolio return for the quarter
was 3.72%, higher than its return objective, 9.60% for
Portfolio Characteristics the 12 month period and 8.94% p.a since inception
Expected Yield to Call/Maturity (including franking): 5.1% (Sep 2015).
Expected Gross Running Yield (including franking) 5.3% The Total Income Return (Gross) was 1.00% for the
Expected Cash Running Yield (not including franking) 4.0% month and for the quarter was +1.05%, whilst the
commensurate income return since inception (Sep
Expected Years to Maturity 4.7
2015) is +6.0% p.a.
Number of Securities 17
The main contributors to performance during the
Floating Rate exposure 100%
month were NABHA (+3.9%), IAGPD (+3.8%), and
Fixed Rate Exposure 0.0% IANG (+3.7%).
There were no detractors to performance this month.
Markets Returns The smallest positive returns came from NABPA (nil
return), MBLPA (nil return) and ANZPC (+0.3%).
Return 1 Month 3 Month 1 Year
ASX200 Accumulation 4.38% 5.19% 11.81% A total of 11 securities traded ex-distribution in
December.
RBA Cash Rate 0.13% 0.38% 1.77%
During the month the portfolio took an allocation of
IAGPD and re-invested part of the proceeds from the
Portfolio Performance ORGHA redemption into NABPA and MBLPA. The
portfolio is currently holding c.5.5% cash in order to
Return 1 Month 3 Month 1 Year
take advantage of any weakness in prices and/or new
Income Return (Gross) 1.00% 1.05% 5.56% issuance early into 2017.
Capital Return 0.75% 2.67% 4.04%
The main driver of performance during month is the
Total Portfolio Return (Gross) 1.75% 3.72% 9.60% continued response to rising global and Australian
Portfolio Return Objective 0.40% 1.17% 4.97% bond and swap rates against the backdrop of a
Excess Return v Objective 1.35% 2.50% 4.63%
1.5% cash rate. In addition the recent and upcoming
redemptions in the hybrid market have resulted in
secondary market buying as holders re-invest the
proceeds of redemptions.
9
Our Preferred Stocks
amaysim Australia (AYS)                                        Mirvac Group (MGR)
amaysim Australia (AYS) operates as a mobile service           Mirvac Group (MGR) engages in the investment and
provider. It offers the choice of an automatic or manual       management of office, retail and industrial assets and the
pre-pay option and a post-pay billing system, giving them      development business to both residential and commercial
the freedom to customise their recharges and payments          projects. The company operates through the following
to suit them.                                                  segments: Office & Industrial, Retail, Residential and
                                                               Corporate & other.
BHP Billiton (BHP)
BHP Billiton (BHP) is a diversified natural resources          National Veterinary Care (NVL)
company. BHP is among the world’s largest producers of         National Veterinary Care (NVL) engages in the provision
commodities along with substantial interests in oil and gas.   of veterinary services. It provides pet care services and
BHP’s principal business lines are mineral exploration and     pet care plans.
production, as well as petroleum exploration, production
and refining. BHP’s assets, operations and interests           OZ Minerals (OZL)
are separated into four business units, Petroleum and          OZ Minerals (OZL) engages in the mining of copper,
Potash, Copper, Iron ore and Coal.                             gold, and silver; and exploration and development
                                                               of mining projects. It operates through the following
BluGlass (BLG)                                                 segments: Prominent Hill, Carrapateena, Exploration and
BluGlass (BLG) engages in the development and                  Development, and Corporate.
commercialization of semiconductor material gallium
nitride. The company develops semiconductor processes          QBE Insurance Group (QBE)
and equipment for the manufacture of high efficiency           QBE Insurance Group (QBE) is a general insurance and
devices such as next generation lighting technology,           reinsurance company. Its underwrites commercial and
light emitting diodes and concentrated. Its proprietary        personal line classes of business, including property, motor
technology, remote plasma chemical vapour deposition           and motor casualty, agriculture and bloodstock, liability,
manufactures semiconductor materials for high efficiency       marine, energy and aviation, workers compensation,
devices such as LEDs and concentrated solar cells for          financial and credit, professional indemnity, accident
utility scale solar.                                           and health, and others. It operates its business through
                                                               the following segments: North American Operations,
Centuria Capital Group (CNI)                                   European Operations, Australian and New Zealand
Centuria Capital Group (CNI) is a listed diversified           Operations, Emerging Markets, and Equator Re.
funds manager. It operates through five segments:
Reverse Mortgages, Investment Bonds, Property Funds            Xenith IP Group (XIP)
Management, Insurance and Corporate.                           Xenith IP Group (XIP) is a holding company, which engages
                                                               in the provision of intellectual property (IP) services and
Henderson Group Plc (HGG)                                      advice. Its services include identification, registration,
Henderson Group Plc (HGG) is a global asset management         management, commercialisation, and enforcement of IP
company, which is focused on delivering investment             rights for a spectrum of clients in Australia, New Zealand,
performance and service to the clients. It manages             and the rest of the world.
investment products for institutional and retail investors,
in European equities, global equities, global fixed income,
multi-asset and alternatives including private equity and
property.

10
amaysim Australia (AYS)                                                                     BHP Billiton (BHP)
Recommendation                                     BUY                                      Recommendation                                    BUY
Risk                                               HIGH                                     Risk                                              MEDIUM
Share Price (as at 16 January 2017) $2.00                                                   Share Price (as at 16 January 2017) $26.77
Target Price                                       $2.27                                    Target Price                                      $33.00
Analyst                                            David Spotswood                          Analyst                                           Peter O’Connor

 Share Price Chart                                                                          Share Price Chart
 130.0                                                                                     200.0
 120.0             AYS           ASX                                                                          BHP          ASX
                                                                                           180.0
 110.0
 100.0                                                                                     160.0
  90.0
                                                                                           140.0
  80.0
  70.0                                                                                     120.0
  60.0
                                                                                           100.0
  50.0
  40.0                                                                                      80.0
     Jan-16      Mar-16      May-16       Jul-16        Sep-16         Nov-16     Jan-17       Jan-16      Mar-16      May-16        Jul-16        Sep-16     Nov-16     Jan-17

 Source: FactSet, Shaw and Partners                                                         Source: FactSet, Shaw and Partners

                                             1 mth                3 mth          12 mth                                                  1 mth               3 mth      12 mth
 Relative Performance*                           1.6%            (15.3%)        (49.4%)     Relative Performance*                           2.4%            12.0%       58.9%
 * Relative Performance is compared to the S&P/ASX 200 Index                                * Relative Performance is compared to the S&P/ASX 200 Index

Building a Strategic Asset                                                                 Top Pick
§ We believe AYS is building a valuable strategic asset: with                              § Portfolio diversity – BHP’s “four pillars” – copper, oil, iron
  over 1m subs, and about to launch a new product (NBN),                                     ore and metallurgical coal – span a broad spectrum of the
  which could get hundreds of thousands of subs and this may                                 commodity markets including commodites which are either
  prove an attractive asset for others.                                                      forecast to move higher in the near/medium term (oil and
§ The outlook for the company is sound, with good subscriber                                 copper) or currently enjoying bouyant conditions (iron ore and
  growth, falling churn rates, stable gross margin, and flat                                 met coal).
  operating costs. The negative coming out of the update was                               § Latent capacity - low capital intensity and therefore high
  the fall in Average Revenue Per User (ARPU). Whether this                                  return incremental growth options exist across BHP’s portfolio
  is transitory or not, will depend on mobile plan pricing and                               ranging from (i) copper – Escondida grade/mill upside ~50%,
  further data inclusions. These have been stable for 9-12                                   (ii) iron ore - ~5-10% upside inline with market growth, (iii)
  months now.                                                                                met coal - ~10% capacity upside plus replacing existing
§ NBN: AYS are targeting an early CY2017 launch. Online, low                                 production with new, lower cost production and (iv) Oil – US
  cost model like AYS mobile. Have access to ~600k homes.                                    onshore oil and gas is significantly leveraged to any uptick in
  If convert 10% of mobile subs to broadband, could add                                      the US oil/gas price.
  anywhere from 10%-25% to earnings. We assume nothing in                                  § FCF deployment – BHP’s portfolio diversity and growth
  our numbers.                                                                               options underpin BHPs free cash Flow outlook with three year
§ Gross Margins: We maintain our gross margin assumptions                                    average expectations (~$6bn) and “spot” a very large ~($9bn
  of 32.6% for FY17, however, due to falling ARPU our gross                                  pa). This will deliver BHP a range of cashflow deployment
  margin per sub falls from $7.98 to $7.55. We assume gross                                  options from balance sheet deleveraging (first step), growth
  margins of 31.5% in FY18 and FY19.                                                         of latent capacity and capital management – both hiking
                                                                                             dividends to the high end of the 40-60% payout ratio range
§ 2017 Guidance: Low double digit revenue growth, Gross
                                                                                             and potentially share buy backs in the medium term.
  Margins 32%-33%, costs flat ~$50m. 1H17 Subs growth
  58-60k.

 Forecasts                                                                                  Forecasts
 YE 30 June (AUD)                     2016 (A)           2017 (E)               2018 (E)    YE 30 June (USD)                     2016 (A)           2017 (E)           2018 (E)
 Earnings cps                            12.0               14.8                   16.2     Earnings cps                            21.5              119.9               93.7
 Dividends cps                            5.2               10.4                   11.4     Dividends cps (AUD)                     43.9               79.7               62.5
 PE x                                    14.0               13.5                   12.4     PE x                                    64.5               15.6               21.2
 Yield %                                  3.1                5.2                    5.7     Yield %                                  2.3                3.0                2.4
 Franking %                                 0                      0                 25     Franking %                               100                    100            100

                                                                                                                                                                              11
Bluglass (BLG) Centuria Capital Group (CNI)
Recommendation BUY Recommendation BUY
Risk HIGH Risk MEDIUM
Share Price (as at 16 January 2017) $0.25 Share Price (as at 16 January 2017) $1.10
Target Price $0.65 Target Price $1.52
Analyst Darren Vincent Analyst Peter Zuk
Share Price Chart Share Price Chart
800.0 120.0
BLG ASX CNI ASX
700.0
115.0
600.0
110.0
500.0
400.0 105.0
300.0
100.0
200.0
95.0
100.0
0.0 90.0
Jan-16 Mar-16 May-16 Jul-16 Sep-16 Nov-16 Jan-17 Jan-16 Mar-16 May-16 Jul-16 Sep-16 Nov-16 Jan-17
Source: FactSet, Shaw and Partners Source: FactSet, Shaw and Partners
1 mth 3 mth 12 mth 1 mth 3 mth 12 mth
Relative Performance* (16.1%) (40.9%) 313.5% Relative Performance* 7.5% 0.4% (7.2%)
* Relative Performance is compared to the S&P/ASX 200 Index * Relative Performance is compared to the S&P/ASX 200 Index
Global LED Leaders are recognising BLGs Technology A Bigger, Better, (and still cheap) CNI
§ Shaw and Partners recently initiated coverage on BLG with a § In our view, the recently completed acquisition of a $1.4b
Buy rating and $0.65 TP. funds management platform off 360 Capital Group, as well
§ BLG is set to disrupt the global Light-Emitting Diode (LED) as $116m of cornerstone investments in the acquired funds,
market, its Remote Plasma Chemical Vapour Deposition is a company-transforming event for CNI. The transaction
(RPCVD) technology is a new low temperature process resulted in CNI’s funds under management (FUM) increasing
for manufacturing LEDs and other optoelectronic devices by 63% to $3.6b, with real estate related FUM up 93% to
(solar cells, laser diodes and power electronics) that $2.9bn.
enables performance, margin and cost improvements. The § Key benefits to CNI include: (1) an increase in earnings from
improvements are so significant that BLG is quickly being recurring/annuity-style income streams to 77% from 65%
surrounded by key LED industry participants. pre-transaction; (2) greater scale and relevance, noting that
§ Multiple commercial deals are in the wings. Sumitomo, which CNI’s market cap has increased to ~$230m (was $80m pre-
supplies 7 of the top 10 semiconductor companies, owns deal) and (3) a more diverse and liquid share register – with a
17% of BLG. Philips Lumileds the largest LED manufacturer strong institutional presence.
is in Phase 2 of a collaboration having completed testing § At current pricing ($1.10), CNI is trading on an FY17 PE of
BLGs LEDs and incorporated them into devices. In addition 11.0X, which screens cheap when compared to the Small
we expect BLG to deliver deals with: i) Veeco, the largest of Ordinaries index at 17.4X and the broader ASX 200 at 15.7X.
the two LED equipment manufacturers in the world, which CNI offers an attractive 7.1% DPS yield, which is based on a
has sent devices containing BLG’s LEDs to its clients, ii) HC conservative 75% payout ratio.
Semitek, a Chinese LED manufacturer which has reported
very encouraging results associated with devices containing
BLG’s LEDs, iii) IQE, a leading manufacturer of wafers
for the semiconductor industry, has entered an exclusive
collaboration, iv) potentially a number of BLGs foundry clients,
some of which have advanced prototype devices, and iv)
there are six other manufacturers that BLG has entered into
non-disclosure agreements with (including a second Chinese
LED manufacturer) that are currently assessing its technology.
Forecasts Forecasts
YE 30 June (AUD) 2016 (A) 2017 (E) 2018 (E) YE 30 June (AUD) 2016 (A) 2017 (E) 2018 (E)
Earnings cps (1.0) (0.7) 1.3 Earnings cps 13.7 10.0 10.4
Dividends cps 0.0 0.0 0.0 Dividends cps 5.3 7.5 7.8
PE x (21.7) (37.8) 19.8 PE x 8.3 11.0 9.3
Yield % 0.0 0.0 0.0 Yield % 5.0 6.7 6.9
Franking % 0.0 0.0 0.0 Franking % 100 100 100
12Henderson Group (HGG) Mirvac Group (MGR)
Recommendation BUY Recommendation BUY
Risk MEDIUM Risk LOW
Share Price (as at 16 January 2017) $3.81 Share Price (as at 16 January 2017) $2.04
Target Price $4.60 Target Price $2.33
Analyst Martin Crabb Analyst Peter Zuk
Share Price Chart Share Price Chart
120.0 125.0
HGG ASX MGR ASX
110.0 120.0
100.0 115.0
90.0 110.0
80.0 105.0
70.0 100.0
60.0 95.0
50.0 90.0
Jan-16 Mar-16 May-16 Jul-16 Sep-16 Nov-16 Jan-17 Jan-16 Mar-16 May-16 Jul-16 Sep-16 Nov-16 Jan-17
Source: FactSet, Shaw and Partners Source: FactSet, Shaw and Partners
1 mth 3 mth 12 mth 1 mth 3 mth 12 mth
Relative Performance* (5.5%) (11.5%) (50.5%) Relative Performance* (7.5%) (10.3%) (9.2%)
* Relative Performance is compared to the S&P/ASX 200 Index * Relative Performance is compared to the S&P/ASX 200 Index
Strong Markets, Positives Flows, Bodes Well for FY16 Unfairly Unloved
Result § MGR offers an attractive forecast 12 month TSR of 19.4%.
§ We recently upgraded our earnings estimates for HGG This includes a yield of 5.1% on a 74% payout ratio – which
following stronger than expected market conditions in the is relatively low when compared to the REIT sector average
final quarter of 2016. European, UK and global equities of 85%. We also note that MGR is trading on a price to NTA
returned 6.2%, 3.5% and 7.4% in British pound terms. premium of 6%, which compares to the REIT sector average
§ We forecast FUM of £104.2b (£41.8b insto, £62.4b retail) at premium of 30%. This suggests to us the market is ascribing
31 Dec 2016, up £3.3b from Sept quarter – this assumes that limited value to its development business.
HGG funds performed in-line with the relevant index during § While MGR is a diversified REIT, we think too much (negative)
Q4, institutional net inflows total £101m (Q3 £437m) and retail focus is on its residential development business, while not
net outflows were -£800m (Q3 -£1,049m). UK retail industry enough (positive) attention is given to its Investment portfolio
flows bounced back in November – net retail monthly fund – particulary its office assets. At a time when other office
flows totalled £1.5b vs. £0.65b Oct, £0.78b Sept, according focused REITs (eg. DXS, IOF) are being ascribed premiums
to The Investment Association (UK). This is the second for their leverage to the Sydney office market, we feel that
highest monthly net flow recorded in the past 13 months. MGR is not getting the credit it deserves for the management,
§ Upcoming potential share price catalysts include: UK industry and rejuvenation of its office portfolio – nor its attractive (and
flow data –to be released on 30 Jan 2017, HGG reports largely pre-committed) commercial development pipeline.
FY16 results on 9 February and JNS merger – report FY16 § Given that MGR’s forecast 3,300 residential lot settlements
earnings/FUM at 2am on 25 Jan, transaction documentation are ~65% skewed to 2H17, we suggest that institutional
published post HGG FY results and transaction expected to investors will remain somewhat wary that MGR can deliver
be completed in Q2. on its earnings guidance – and will therefore be somewhat
§ BUY. We think that HGG is currently undervalued and the reactive, waiting on more “proof”. From our perspective,
market has not given due consideration to the strength of we are not concerned about the risk of settlement defaults
global markets in the final quarter of 2016 and the recent having a material impact on its earnings, and note that our
release of positive UK industry data. The upcoming results FY17e EPS of 14.1¢ is at the low end of MGR’s 14.0-14.4¢
day will provide the opportunity to provide an update of how guidance.
the pending JNS merger is progressing.
Forecasts Forecasts
YE 31 Dec (GBP) 2016 (E) 2017 (E) 2018 (E) YE 30 June (AUD) 2016 (A) 2017 (E) 2018 (E)
Earnings cps 15.8 18.8 21.4 Earnings cps 13.0 14.1 14.7
Dividends cps (AUD) 18.5 19.9 22.2 Dividends cps 9.9 10.4 11.2
PE x 15.0 12.6 11.0 PE x 15.5 14.3 13.7
Yield % 4.3 5.1 5.8 Yield % 4.9 5.2 5.6
Franking % 0 0 0 Franking % 0 0 0
13National Veterinary Care (NVL) OZ Minerals (OZL)
Recommendation BUY Recommendation BUY
Risk MEDIUM Risk HIGH
Share Price (as at 16 January 2017) $2.06 Share Price (as at 16 January 2017) $9.11
Target Price $2.40 Target Price $10.60
Analyst Darren Vincent Analyst Peter O’Connor
Share Price Chart Share Price Chart
170.0 250.0
160.0 NVL ASX OZL ASX
230.0
150.0 210.0
140.0
190.0
130.0
170.0
120.0
150.0
110.0
100.0 130.0
90.0 110.0
80.0 90.0
Jan-16 Mar-16 May-16 Jul-16 Sep-16 Nov-16 Jan-17 Jan-16 Mar-16 May-16 Jul-16 Sep-16 Nov-16 Jan-17
Source: FactSet, Shaw and Partners Source: FactSet, Shaw and Partners
1 mth 3 mth 12 mth 1 mth 3 mth 12 mth
Relative Performance* (3.4%) (6.2%) 41.0% Relative Performance* 12.3% 50.1% 139.8%
* Relative Performance is compared to the S&P/ASX 200 Index * Relative Performance is compared to the S&P/ASX 200 Index
A Proven Strategy More Life, More Growth, More Shareholder Returns
§ NVL has consistently exceeded expectations. Over 2016 both § Longevity – Decades not years is how one should consider
NVLs pro forma and statutory results exceeded prospectus the OZL investment thesis although we note that until recently
forecasts. At its AGM in November NVL increased FY17 (2015) OZL was considered a short life company (to early
guidance from revenue growth of 10% to greater than 2020’s). We expect that OZL will be a successful company
18% above the pro forma FY16 revenue. Since listing for many decades underpinned by the significant resource
NVL has acquired and integrated its initial portfolio of 34 potential in South Australia (SA), proximate to current/future
businesses, acquired an additional 16 veterinary practices at operations. Importantly, longer life delivers more tail end value
an average multiple of 4.9x EBITDA and two businesses that and turn future share price upside.
have established its management services and procurement § Growth – Firstly, growth is via the extension of mine life at
business, set up its training facilities and renegotiated the existing copper operation, Prominent Hill, most recently
procurement terms. We see this as validation of its strategy extended by 4 years to 2028. Secondly, the production scale
which gives us confidence in its outlook. and mine life of current development project, Carrapateena,
§ 2017 is expected to deliver ongoing growth. We expect 2017 will likely both be higher by 5-10% and >10% respectively.
will bring more of the same. NVL is expected to make ongoing We expect that OZL’s dominant position and track record will
acquisitions at attractive pricing that leads to value creation attract more opportunities in SA. All of these growth options
with every incremental acquisition a meaningful contributor add significantly to NPV valuation and opening the gap above
to group earnings and value uplift. NVL’s organic growth the share price – this gap will close in line with production and
strategy also took shape through 2016 with the acquisition growth.
of Complete Vet Systems (a veterinary management systems § FCF optionality – OZL is the most cashed up copper
business) and UVG Holdings (a procurement business) which company in the world and is also the second most cashed
complement its unique training services/facilities and offer up major mining company (top 25) in Australia. This current
another growth angle to the company. cash pile (~$500m) is adequate to cover all current growth
plans – Prominent Hill and Carrapateena – allow for further
§ Given NVLs current FY18 PE of 14.4x is below the small
capital management – share buy back currently underway
industrials average of ~16-17x we believe it is a compelling
– and maintain a modest dividend payout. Importantly, OZL
proposition and that it should with further confirmation of
is forecast to complete the above expansion programs
what it is achieving trade up to a multiple in this range which
whilst remaining in a net cash position – Shaw base case)
is the basis for our $2.40 TP. BUY.
suggesting that there is more room for capital management
initiatives in the medium term.
Forecasts Forecasts
YE 30 June (AUD) 2016 (A) 2017 (E) 2018 (E) YE 31 Dec (AUD) 2016 (A) 2017 (E) 2018 (E)
Earnings cps 9.4 11.5 13.1 Earnings cps 37.1 41.0 42.3
Dividends cps 0.0 0.0 0.0 Dividends cps 16.0 11.0 13.0
PE x 13.9 16.8 14.4 PE x 24.6 22.2 21.6
Yield % 0.0 0.0 0.0 Yield % 1.8 1.2 1.4
Franking % 0 0 0 Franking % 0 0 0
14QBE Insurance (QBE) Xenith IP Group (XIP)
Recommendation BUY Recommendation BUY
Risk HIGH Risk MEDIUM
Share Price (as at 16 January 2017) $12.36 Share Price (as at 16 January 2017) $2.81
Target Price $14.13 Target Price $3.90
Analyst David Spotswood Analyst Martin Crabb
Share Price Chart Share Price Chart
120.0 140.0
QBE ASX XIP ASX
115.0
130.0
110.0
120.0
105.0
100.0 110.0
95.0
100.0
90.0
90.0
85.0
80.0 80.0
Jan-16 Mar-16 May-16 Jul-16 Sep-16 Nov-16 Jan-17 Jan-16 Mar-16 May-16 Jul-16 Sep-16 Nov-16 Jan-17
Source: FactSet, Shaw and Partners Source: FactSet, Shaw and Partners
1 mth 3 mth 12 mth 1 mth 3 mth 12 mth
Relative Performance* (4.9%) 16.2% (3.2%) Relative Performance* 3.4% (24.2%) (28.9%)
* Relative Performance is compared to the S&P/ASX 200 Index * Relative Performance is compared to the S&P/ASX 200 Index
Has The World Changed? Maybe Synergy Benefits to Drive Growth
§ Key Issues: Three main drivers a) interest rates; b) currency; § Xenith IP (XIP) has entered into a binding agreement to
c) commercial rates. Commercial rates are still falling globally acquire Griffith Hack for $152m, following their recent $15.5m
and QBE has to work hard to manage this. acquisition of Watermark. These acquisitions propel XIP
§ Interest rates: QBE have said 1% lift in interest rates lowers into one of the largest IP firms in Australia and fast-track
claims value by $400m due to higher discount rate, offset by the development of complementary service lines and Asian
$140m in bond capital value losses. Net say $260m pre-tax expansion.
or say $200m after tax or +25% to profits. § Griffith Hack is twice the size of XIP on a revenue basis,
§ Interest rates: Also lifts running yield on $22.5b bond but is earning lower margins. Management have targeted
portfolio. 1% across the board adds $225m to income. The $4-$6m of pre-tax cost synergies by year three, but we
portfolio is around one third in each USA, UK, and Australia. think this undercooks the opportunity to pull out more costs,
The yield on the book was 2.02% at as 30 June 2016. The faster. A combination of office rationalisation and professional
bond rates below will add 30bps and 50bps to insurance productivity could see much higher (30%+) margins in three
margins in 2017 and 2018. years’ time than we forecast (24.3%).
§ So movement in interest rates and the Fed median forecast § We expect substantial revenue synergies to accrue also.
(1% end 2017, 1.5% end 2018) for USA cash rates adds Griffith Hack is estimated to derive 10% of its revenue from
50bps and 150bps to insurance margins from our current complementary service lines which Watermark had also been
numbers or +4% and +11% to 2017 and 2018. developing. The opportunity to offer a greater breadth of
services to the combined 11,000 clients should see revenue
1-2 year Bonds Dec-15 Jun-16 9-Dec-16 2017 2018
USA 1.06 0.58 1.10 1.40 1.90 benefits materialise.
UK 1.34 0.35 0.53 0.53 1.00 § BUY. Xenith IP has participated in the rationalisation of the
Australia 2.02 1.55 1.89 1.89 2.25 Australian Patent Attorney industry by pairing up with two
Average Rate 1.47 0.83 1.17 1.27 1.72 high quality, complementary businesses in Griffith Hack and
-0.64 0.35 0.10 0.44 Watermark. Collectively the group will have critical mass and
§ BUY. QBE has been a widow-maker trade for the last decade fully developed service offering. The underlying businesses
due to poor management and a poor macro environment. are under-earning and management has the task head of it
If fiscal stimulus from China and the USA drive up inflation to lift margins towards the mid 30’s over the next few years.
and bond yields over the next 1-3 years QBE will benefit
significantly.
Forecasts Forecasts
YE 31 Dec (USD) 2016 (A) 2017 (E) 2018 (E) YE 30 June (AUD) 2016 (A) 2017 (E) 2018 (E)
Earnings cps 57.0 65.0 78.9 Earnings cps 18.2 19.6 22.0
Dividends cps 38.6 38.3 44.9 Dividends cps 7.0 12.0 17.6
PE x 16.1 14.2 11.7 PE x 21.8 14.2 12.7
Yield % 4.2 4.2 4.9 Yield % 1.8 4.3 6.3
Franking % 50 50 50 Franking % 100 100 100
15Recommendation Definitions Rating Classification Buy Expected to outperform the overall market Hold Expected to perform in line with the overall market Sell Expected to underperform the overall market Not Rated Shaw has issued a factual note on the company but does not have a recommendation High Higher risk than the overall market – investors should be aware this stock may be speculative Medium Risk broadly in line with the overall market Low Lower risk than the overall market. Disclaimer Shaw and Partners Limited ABN 24 003 221 583 (“Shaw”) is a participant of ASX Limited, Chi-X Australia Pty Limited and holder of Australian Financial Services licence number 236048. ANALYST CERTIFICATION The Research Analyst who prepared this report hereby certifies that the views expressed in this document accurately reflect the analyst’s personal views about the Company and its financial products. The Research Analyst has not been, is not, and will not be receiving direct or indirect compensation for expressing the specific recommendations or views in this report. As at the date of this report, the Research Analyst does have an interest in the financial products of AYS, BHP, BLG, CBA, CNI, CYB, LLC, MQG, NAB, PPT, QBE, SUN, TLS and WBC. DISCLAIMER This report is published by Shaw to its clients by way of general, as opposed to personal, advice. This means it has been prepared for multiple distribution without consideration of your investment objectives, financial situation and needs (“personal circumstances”). Accordingly, the advice given is not a recommendation that a particular course of action is suitable for you and the advice is therefore not to be acted on as investment advice. You must assess whether or not the advice is appropriate for your personal circumstances before making any investment decisions. You can either make this assessment yourself, or if you require a personal recommendation, you can seek the assistance of your Shaw client advisor. This report is provided to you on the condition that it not be copied, either in whole or in part, distributed to or disclosed to any other person. If you are not the intended recipient, you should destroy the report and advise Shaw that you have done so. This report is published by Shaw in good faith based on the facts known to it at the time of its preparation and does not purport to contain all relevant information with respect to the financial products to which it relates. Although the report is based on information obtained from sources believed to be reliable, Shaw does not make any representation or warranty that it is accurate, complete or up to date and Shaw accepts no obligation to correct or update the information or opinions in it. If you rely on this report, you do so at your own risk. Any projections are estimates only and may not be realised in the future. Except to the extent that liability under any law cannot be excluded, Shaw disclaims liability for all loss or damage arising as a result of any opinion, advice, recommendation, representation or information expressly or impliedly published in or in relation to this report notwithstanding any error or omission including negligence. This publication has been prepared in accordance with Shaw’s Research Policy. A copy of the Policy can be found at www.shawandpartners.com.au. DISCLOSURE Shaw will charge commission in relation to client transactions in financial products and Shaw client advisors will receive a share of that commission. Shaw, its authorised representatives, its associates and their respective officers and employees may have earned previously, or may in the future earn, fees and commission from dealing in the Company’s financial products. Shaw acted for BLG and XIP in a corporate capacity within the past 12 months for which it received a fee. RISK STATEMENT Where a company is designated as ‘High’ risk, this means that the analyst has determined that the risk profile for this company is significantly higher than for the market as a whole, and so may not suit all investors. Clients should make an assessment as to whether this stock and its potential price volatility is compatible with their financial objectives. Clients should discuss this stock with their Shaw adviser before making any investment decision. 16
Register for Online Access
Online Portfolio Login
As a Shaw and Partners client, you are provided with free, secure online access
to view your portfolio anytime, anywhere.
Wide range of information included
Transaction history
Access to Shaw’s research library
Details of your CHESS holdings and
derivatives positions
Cash balances in your cash
management account
Access to confirmations and statements
records of each trade you have made
through Shaw
20 minute delayed ASX prices, quotes,
announcements, company profiles and
historical prices, and
‘Watch lists’ along with a charting
package to compare ASX listed stocks.
To register for online access please speak to your adviser, alternatively visit
http://www.shawandpartners.com.au/#/online-registration
17SMA now available
Shaw Managed Accounts
Our Large Cap and Hybrid Income Model Portfolios are now available on
the Shaw Managed Accounts platform.
Shaw Managed Accounts are a sophisticated Once you decide which Model Portfolios are best suited
investment and reporting platform incorporating to your investment needs and objectives, Shaw and
advanced features to assist in the management Partners will purchase securities to be included in your
account so that it reflects the Model Portfolio, or a
of your overall investment strategy and
combination of Model Portfolios.
portfolio.
The Model Portfolios are managed in a disciplined and
Shaw Managed Accounts are established and offered consistent manner; overseen by a dedicated team of
within the registered managed investment scheme known investment professionals with many years of experience
as the Separately Managed Accounts. Each investor in securities markets.
has a separate “account” to which their investments are
allocated. With Shaw Managed Accounts, not only are you the
beneficial owner of the portfolio (and shares), you will
Your account can be constructed by using a range of also enjoy the ownership benefits (such as dividends
available investment strategies (referred to as Model and franking credits) and have the ability to see the exact
Portfolios) that you can select from the investment menu make up and market value of the portfolio at any time, via
together, with your Shaw and Partners adviser. our online service.
Investment goals (return, risk tolerance,
time horizon) and financial situation
Investor Shaw Adviser
Investment strategy, asset allocation
Shaw platform
Portfolio management
and performance
reporting
Shaw Direct Equity SMA Investment
Portfolio Service Model Portfolios professionals
in specie transfer Individual portfolio
of securities
18SMA now available
Shaw Managed Accounts have a considerable number of advantages
over investing in Managed Funds.
Shaw
Managed Managed
Features Accounts Funds
Professional portfolio management
Blended individual portfolio –
Ability to view underlying securities –
Wholesale execution
Fee transparency
Daily liquidity
Immediate application and redemption of funds
Low minimum investment
Select minimum trade size –
Netting of transactions –
In specie transfers –
Exclude specific securities from portfolio –
Tax reporting
Ability to download tax parcels –
Administration of corporate actions
Automatic tax optimisation –
Minimise Capital Gain Tax (CGT) when switching –
Avoid embedded CGT –
Access via Product Disclosure Statement (PDS)
Speak to your adviser for more information about Shaw Managed Accounts
19Sydney | Head Office Melbourne Brisbane
Level 15, 60 Castlereagh Street Level 20, 90 Collins Street Level 28, 111 Eagle Street
Sydney NSW 2000 Melbourne VIC 3000 Brisbane QLD 4000
Tel: +61 2 9238 1238 Tel: +61 3 9268 1000 Tel: +61 7 3036 2500
Fax: +61 2 9232 1296 Fax: +61 3 9650 2277 Fax: +61 7 3036 2599
Toll Free: 1800 636 625 Toll Free: 1800 150 009 Toll Free: 1800 463 972
Adelaide Perth
Level 21, 25 Grenfell Street Level 14, 197 St Georges Terrace enquiries@shawandpartners.com.au
Adelaide SA 5000 Perth WA 6000 www.shawandpartners.com.au
Tel: +61 8 7109 6000 Tel: +61 8 6188 7643 Shaw and Partners Limited
Fax: +61 2 9232 1296 Fax: +61 8 6188 7607 ABN 24 003 221 583
Toll Free: 1800 636 625 Toll Free: 1800 636 625
20You can also read