THE RESEARCHLIVE INDUSTRY REPORT 2019 - INCLUDING THE NEW MRS LEAGUE TABLES - Market Research Society
←
→
Page content transcription
If your browser does not render page correctly, please read the page content below

THE RESEARCHLIVE
INDUSTRY REPORT
2019
INCLUDING THE NEW MRS LEAGUE TABLES

Now more than ever, online communities
    must offer both agile and immersive
    methodologies to deliver faster,
    more in-depth insights.

    Our insight ecosystem
    enables us to do just that.

www.jointhedotsmr.com
  wejointhedots

                                         2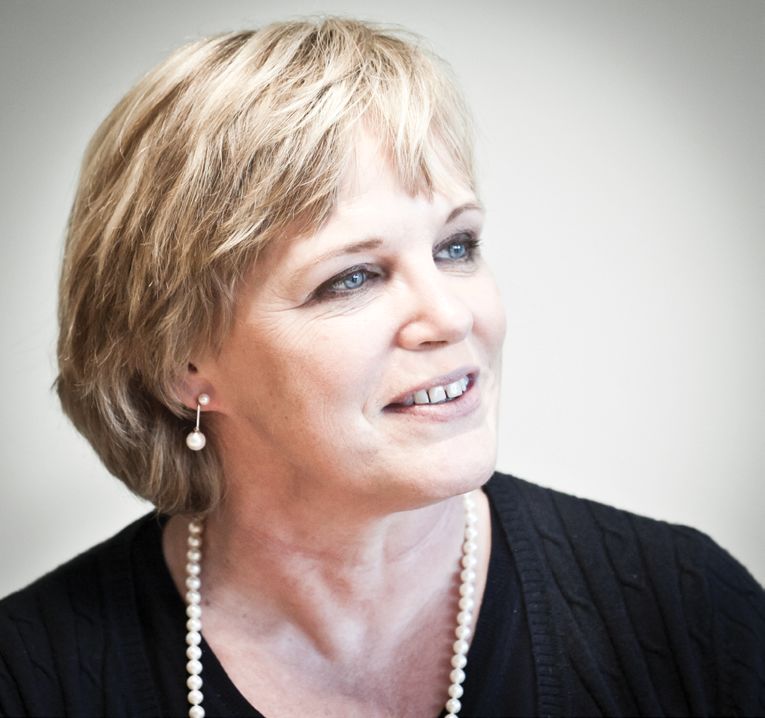
CONTENTS

2        I NTRODUCTION
         Jane Frost, CEO, MRS
4    MRS LEAGUE TABLES 2017
4    ANALYSIS
6	INDIVIDUAL AGENCIES
12 	CONSOLIDATED BUSINESSES

17       INTERNATIONAL OUTLOOK:
         ANALYSIS OF 2018 GRBN GLOBAL TOP 25
24	TIME TO FLEX
         Graeme Lawrence, Join the Dots
26       PERSPECTIVES
         — THE FASTEST GROWERS
         — CLIENTS
         Jane Bainbridge, Research Live
34	HIGHLIGHTS FROM THE MRS INDUSTRY SURVEY 2018
         David Cahn, synygis consulting
36       THE GENDER PAY GAP IN THE MARKET
         RESEARCH SECTOR
         David Cahn
42       HELPING BRANDS STAY AHEAD OF THE CURVE

                                          ACKNOWLEDGEMENTS
                                          Market Research Society (MRS) would
                                          like to thank all contributors to this report.
                                          In particular, to David Barr for compiling the
                                          MRS League Tables every year and providing
                                          analysis, and David Cahn for undertaking
                                          the annual MRS Industry Survey and gender
                                          pay gap analysis, and Diane Bowers for
                                          preparing the 2018 GRBN Global Top 25.

                                          If you have any queries about this report
                                          please contact MRS info@mrs.org.uk or
                                          call 020 7490 4911.

THE RESEARCH LIVE INDUSTRY REPORT 2019                                                     1
INTRODUCTION
Jane Frost, chief executive, MRS

  Welcome to the Research Live
  Industry Report 2019.
  This report brings together multiple sources of intelligence   MRS continues to lobby hard and highlight the value
  including the MRS League Tables and highlights from the        of the research industry to the UK government. This is
  MRS Industry Survey. In addition, for the first time MRS       to ensure that post-Brexit we retain our position as the
  has commissioned analysis of the Global Top 25 Report          second largest research industry in the world, with the
  published by the Global Research Business Network.             highest per-capita expenditure on market research
                                                                 and insight (page 34). MRS members and non-members
  The MRS League Tables are built on 2017 financial data         can access our Brexit advice on mrs.org.uk
  submitted and collected in 2018; the data is focused solely
  on UK-based turnover and international work managed            There are other key indicators as to the health of an industry,
  and invoiced from the UK. Financial data is inherently         beyond the purely financial. I’m very pleased to include
  backward looking, which is why we have complemented            David Cahn’s analysis of the gender pay gap (page 36) which
  these tables with the latest trends and analysis from the      paints a picture of a sector with its own particular struggles,
  Research Live editorial team and industry experts.             but with some beacons of best practice leading the way.

  The headline is that by our estimates the UK research          To round the report off in a positive direction we look
  supply industry grew by 3% in 2017 and has passed the          at this year’s winner of the Research Live award for Best
  £5bn mark (page 34). Never underestimate the value             Innovation (page 42). Streetbees offers a compelling
  of a nice round memorable number, especially in these          vision for the future of the research sector where real-
  volatile times when we must continually promote and            time consumer insight can help transform a business.
  protect the sector.
                                                                 Thank you for taking the time to read this report –
  The mood among UK businesses isn’t optimistic, for the         I hope you find it useful.
  short term at least. Brexit has engendered widespread
  concern, particularly in a sector like ours which derives a
  lot of its revenue from international work. Diane Bowers’
  report (page 17) highlights the emphasis on international
  research in the UK’s largest research companies which
  averaged 85.3% of their revenue from overseas in 2017.         Jane Frost, CBE, chief executive, MRS

THE RESEARCH LIVE INDUSTRY REPORT 2019                                                                                         2
HIGHLIGHTS FROM
THIS REPORT

5bn                                      £3.3bn 6.5%
£5.045BN                                 TURNOVER OF TOP 100   GROWTH
THE UK RESEARCH                          INDIVIDUAL AGENCIES   YEAR-ON-YEAR FOR
SUPPLY INDUSTRY                          £3.294BN VERSUS       TOP 100 INDIVIDUAL
GREW 3% IN 2017                          £3.026BN THE          AGENCIES
                                         PREVIOUS YEAR

+17.7% 43.2% 8
INCREASE IN MALE                         OF EU RESEARCH        OF THE GLOBAL TOP 25
AVERAGE HOURLY                           OUTPUT IS GENERATED   ARE UK COMPANIES –
EARNINGS COMPARED                        FROM THE UK           85.3% OF THEIR 2017
TO FEMALES WORKING                                             REVENUE CAME FROM
IN RESEARCH SECTOR                                             OUTSIDE THE UK

THE RESEARCH LIVE INDUSTRY REPORT 2019                                                3
MRS LEAGUE TABLES
ANALYSIS
David Barr, league tables compiler

  In 2017, the top 100 individual agencies generated a
  total turnover of £3.294bn which represents over 60%
  of the MRS estimate of the total industry size. Overall
  year-on-year growth within these 100 agencies was
  6.5%. Sixty four agencies recorded growth, while 36
  had declining turnover. The top 10 agencies accounted
  for 49.8% of total turnover in the table, and the top 20
  accounted for 69.1%.

  TOTAL TURNOVER AND GROWTH RATES OF TOP 100 INDIVIDUAL AGENCIES

                                          2015       2016          2017
  TOTAL TURNOVER                          £2.94bn    £3.093bn      £3.294bn
  GROWTH RATE                             7.2%       4%            6.5%

  NUMBER OF TOP 100 INDIVIDUAL AGENCIES WITH GROWING/DECLINING TURNOVER

                                          2015       2016          2017
  GROWING TURNOVER                        72         67            64
  DECLINING TURNOVER                      28         33            36

THE RESEARCH LIVE INDUSTRY REPORT 2019                                        4
MRS LEAGUE TABLES
ANALYSIS
SCALE 2. EUROPE
Thousands of small suppliers with turnover According to ESOMAR’s Global Market Research
below £5m, ranging from generalists to boutique Report, the UK is the largest supplier in Europe
specialists, provide high-quality work and of research and insight, larger than Germany and
excellent customer service. Also, the league France combined. The UK represents 43.2% of EU
tables do not record or rank profitability. output and 40.8% of the wider European output.
Nonetheless, achievement of scale is a valid
statement of business success, and many 3. ULTIMATE OWNERSHIP
agencies vie each year for the recognition The Table of the Top Consolidated Businesses
arising from featuring in the table of the focuses on concentration of ownership.
Top 100 Individual Agencies. Ownership of these UK-based businesses
(including ultimate holding companies
INTERNATIONAL CONTEXT and majority private equity) is as follows:
1. UNITED STATES The UK: 31 / USA: 14 / Others: 5 (one each from
The world’s largest market research industry is Germany, France, Netherlands, Norway, Ireland).
in the United States. The second largest is the UK,
disproportionately so when placed in the context COMPILATION METHODOLOGY AND ELIGIBILITY
of the size of the US economy. The US industry is GENERAL
only three times larger than the UK despite its Eligible organisations ranked in the MRS
GDP and population being five times higher. Research & Insight Industry League Tables provide
However, the US is a major investor in the UK- monitoring, measurement, and understanding of
based industry. The turnover level for eligibility markets and societies in support of well-informed
for entry in the MRS Top 50 Table of Consolidated and evidence-based decision-making. They deploy
Businesses is comparable to that for the AMA Gold a wide and eclectic range of personnel, techniques,
Top 50 in the USA. In any mature industry there technologies, methodologies, skills, experience,
is an expectation of a high level of consolidation knowledge and expertise. Likewise, they deliver
at the top accompanied by a long tail of much their services via many different business models,
smaller businesses. Clearly the UK has more media and distribution channels.
substantial medium-sized businesses than the
USA, and also a much more internationally- The MRS tables seek to identify and rank the
focused industry. Many of the largest groups in industry’s largest businesses according to their
the USA (especially those which are US-owned UK-based turnover (including international
and headquartered) serve predominantly the work controlled and/or invoiced from the UK),
large domestic US market and have very low and by their year-on-year growth (or contraction)
levels of non-US turnover. Not only are they of turnover. Growth can be organic or by
minimal exporters, many have virtually no acquisition, or a combination of both. Although
international or global capability. The UK retains the tables do not differentiate these, the notes
its long-term status as a hub for management of may do so. The tables also contribute to the MRS
international projects, and records the world’s estimates of overall industry size and growth rate.
highest per-capita expenditure on market and
social research and insight.
THE RESEARCH LIVE INDUSTRY REPORT 2019 5MRS LEAGUE TABLES
ANALYSIS
TABLE OF TOP 100 INDIVIDUAL AGENCIES SOURCES
This table ranks the top 100 individual agencies The tables are compiled at the end of October
by turnover. These agencies are identifiable as using the latest data available. Many information
separate UK-based companies regardless of sources are used in the compilation process.
whether their ownership is independent or part The business and trade press and related websites
of a larger group. Among these agencies growth yield a great deal of information. Annual reports
is neither universal nor evenly distributed, as of public companies range from the informative
is highlighted in the table ranking the 20 fastest- and transparent to the minimalist and oblique.
growing agencies. Statutory filings at Companies House are the
principal source of comparative data in the public
TABLE OF TOP 50 CONSOLIDATED BUSINESSES domain but financial years and reporting dates
This table draws agencies (where appropriate) vary. Most are in December but a few are as early
together under ownership groups. It further as February and March.
highlights the extent of industry consolidation
and the concentration of turnover in the largest Small private companies which file abbreviated
groups. In relevant cases the notes accompanying accounts at Companies House send their turnover
the table identify ultimate ownership as well as data on request directly to the compiler. For a few
the named subsidiary agencies which are included companies, turnover is estimated. Estimates are
in the calculation of group turnover. However, the in italics and tend to be cautious.
table ranking the 20 fastest-growing businesses
within that table shows no correlation between Within the tables, the previous year’s turnover is
scale of turnover and rate of growth. amended for some entries to replace the compiler’s
estimates with actual turnover subsequently
reported; to include re-statements by auditors;
and to ensure like-for-like comparative data.
However, following such amendments the
previous year’s entries are not re-ranked and
the tables are not re-published. Consequently,
the movement in ranking for some entries in the
current year may be distorted. It is also worth
stating that each year there are new entries
into, and departures from, the tables, so the
top 100 agencies are not entirely the same as
in previous years.
Suggestions of eligible agencies for future
inclusion are welcome. Please send an e-mail
to the league tables compiler, David Barr, via
industry.statistics@mrs.org.uk
THE RESEARCH LIVE INDUSTRY REPORT 2019 6MRS LEAGUE TABLES TOP 100 INDIVIDUAL AGENCIES RANKED BY TURNOVER 2017 MRS LEAGUE TABLES, COMPILED NOVEMBER 2018 2017 CHANGE ON 2016 R ANKING PREVIOUS R ANKING 2017 2016 2015 % CHANGE ON GROWTH NUMBER R ANKING NUMBER COMPANY NAME (£M.) (£M.) (£M.) PREVIOUS YEAR R ANKING 1 = 1 Dunnhumby 253.297 254.379 248.296 -0.425% 65 2 = 2 Wood Mackenzie Research & Consulting 234.301 226.569 226.988 3.413% 51 3 p 5 Gartner 200.379 174.966 156.244 14.525% 25 4 = 4 Ipsos MORI 193.700 177.300 172.500 9.250% 38 5 q 3 Kantar TNS UK 189.012 184.880 191.623 2.235% 55 6 p 8 Euromomitor 122.484 102.018 88.356 20.061% 17 7 p 35 GlobalData 121.678 100.613 60.466 20.937% 15 8 p 9 Mintel 115.226 95.858 84.658 20.205% 16 9 q 7 GfK UK 105.588 103.291 129.151 2.224% 56 10 q 6 AC Nielsen 105.500 113.919 122.769 -7.390% 78 11 q 10 Kantar Millward Brown UK 87.500 92.192 100.136 -5.089% 76 12 q 11 Ebiquity 87.376 83.569 73.874 4.556% 45 13 p 17 IQVIA Solutions UK 74.436 43.038 36.217 72.954% 1 14 p 19 Forrester Research 62.914 38.738 16.863 62.409% 3 15 q 12 Teradata UK 60.901 70.087 90.906 -13.107% 90 16 q 14 Kantar Media UK 60.100 59.071 57.079 1.742% 61 17 q 13 Informa Telecoms & Media 59.954 60.935 63.122 -1.610% 69 18 q 15 Lightspeed Research 55.060 47.632 41.582 15.595% 22 19 q 18 Information Resources 43.663 41.844 39.957 4.347% 46 20 q 16 Precise Media Monitoring 41.941 43.578 44.012 -3.756% 73 21 = 21 Research Now 38.283 34.509 34.843 10.936% 32 22 = 22 IDC 37.860 31.221 25.753 21.265% 14 23 p 24 NatCen 33.106 29.998 32.933 10.361% 34 24 q 20 MMR Research Worldwide 32.300 35.900 25.980 -10.028% 85 25 q 23 Hall & Partners 30.234 30.589 28.681 -1.161% 68 Those in italics are estimated or partially estimated figures Those marked ‘--’ are new entrants THE RESEARCH LIVE INDUSTRY REPORT 2019 7
MRS LEAGUE TABLES
TOP 100 INDIVIDUAL AGENCIES
RANKED BY TURNOVER (CONT.)
2017 MRS LEAGUE TABLES, COMPILED NOVEMBER 2018

2017       CHANGE ON 2016
R ANKING   PREVIOUS  R ANKING		                                      2017       2016       2015      % CHANGE ON   GROWTH
NUMBER     R ANKING  NUMBER    COMPANY NAME                          (£M.)      (£M.)      (£M.)   PREVIOUS YEAR   R ANKING

  26       q         25          Double Helix                     30.000     29.000     28.000          3.448%         50

  27       p         28          The Research Partnership          27.517    22.579     21.828         21.870%          13

  28       q         27          YouGov                           27.100     24.960     22.900          8.574%         39

  29       =         29          Cello Health Insight             24.734      21.817     21.158        13.370%          27

  30       q         26          Toluna                           22.805     25.046     20.591        -8.948%          83

  31       p         36          WorldOne Research                20.563     17.940     16.450         14.621%          24

  32       =         32          Flamingo Research                20.397     19.033     21.746           7.167%         41

  33       p         40          IHS Markit Economics              18.812     14.159    12.445        32.862%            7

  34       q         33          Frost & Sullivan                 18.800     18.468     18.280          1.798%         60

  35       q         31          Confirmit                         17.957    19.754      18.351        -9.097%         84

  36       q         34          Future Thinking                  17.588      19.105     17.416        -7.940%          79

  37       p         47          Kynetec UK                       17.009     12.243     13.923        38.928%            4

  38       q         37          MaritzCX                         16.793     16.463     16.380         2.004%           57

  39       p         41          The Gallup Organisation          15.639     13.428      11.507        16.466%         20

  40       q         38          Hay Group Insight                 15.150     15.100    15.050          0.331%         64

  41       p         42          Incite Marketing Planning        14.983     12.996     12.926         15.289%          23

  42       p         44          Prescient Healthcare             13.574      12.716    10.974          6.747%          43

  43       p         45          Promise Communispace             13.469      12.701    12.653          6.047%          44

  44       q         43          BDRC Continental                  13.148    12.752     13.302          3.105%          53

  45       p         46          Populus                           13.105    12.560     10.653         4.339%           47

  46       p         53          Adelphi International Research   12.878     11.098      9.953        16.039%           21

  47       --        --          Nielsen Book Services            12.568     13.726     13.457         -8.437%          81

  48       p         61          Join the Dots                    12.052      9.798      7.760        23.005%           12

  49       p         69          Kantar Retail                    11.899     10.603      8.820         12.223%          31

  50       p         59          Firefish                         11.860     10.030      11.237        18.245%          19

Those in italics are estimated or partially estimated figures
Those marked ‘--’ are new entrants

THE RESEARCH LIVE INDUSTRY REPORT 2019                                                                                   8
MRS LEAGUE TABLES
TOP 100 INDIVIDUAL AGENCIES
RANKED BY TURNOVER (CONT.)
2017 MRS LEAGUE TABLES, COMPILED NOVEMBER 2018

2017       CHANGE ON 2016
R ANKING   PREVIOUS  R ANKING		                                       2017       2016      2015      % CHANGE ON   GROWTH
NUMBER     R ANKING  NUMBER    COMPANY NAME                           (£M.)      (£M.)     (£M.)   PREVIOUS YEAR   R ANKING

  51       =         51          Defaqto                           11.653      11.551    13.247        0.883%          63

  52       p         72          Concentra Analytics               11.638     8.452       7.213       37.695%            5

  53       q         39          Shoppertrak                        11.166    14.437     12.969      -22.657%          98

  54       p         68          B2B International                 11.009     8.625      8.227         27.641%           8

  55       q         54          Datamonitor                       10.966     10.678     11.653         2.697%          54

  56       p         63          Added Value                       10.828     9.620      10.356        12.557%         29

  57       q         52          2CV                               10.812     11.228     9.865         -3.705%          72

  58       p         70          Basis Research                    10.696     8.507       7.461       25.732%           10

  59       p         73          PwC Research                      10.350     8.350      8.300        23.952%            11

 60        q         58          MARU/edr                          10.291     10.095      9.126         1.942%         59

  61       --        --          Nielsen Sports                    10.250     9.524       7.899         7.623%         40

  62       q         49          Market Force Information          10.238      11.610     11.715       -11.817%         87

  63       q         55          Avention UK                        10.181    10.657     10.788        -4.467%          75

  64       q         50          ORC International                 9.965      11.689     12.621       -14.749%         94

  65       q         48          The Planning Shop International    9.281     12.053     9.633       -22.998%          99

  66       q         57          ICM Research Unlimited             8.914      10.171    9.963        -12.359%         89

  67       q         65          Cello Bright Blue                 8.883       9.491     9.020        -6.406%           77

 68        p         75          Harris Interactive                8.808       7.944      7.502        10.876%          33

  69       q         64          Strategy Analytics                 8.750     9.588      10.387        -8.740%          82

  70       q         60          Quadrangle                        8.539       9.891     10.678       -13.669%          91

  71       q         62          Walnut Unlimited                  8.505       9.661     10.618       -11.966%         88

  72       p         79          NPD Group                         8.336       7.600     6.460         9.684%           37

  73       q         71          System1 Research                   8.175     8.478      8.622         -3.574%          71

  74       q         66          KPMG Nunwood Consulting            7.963     9.376      5.706        -15.070%         95

  75       q         67          Illuminas                          7.950     8.649       8.199       -8.082%          80

Those in italics are estimated or partially estimated figures
Those marked ‘--’ are new entrants

THE RESEARCH LIVE INDUSTRY REPORT 2019                                                                                   9
MRS LEAGUE TABLES
TOP 100 INDIVIDUAL AGENCIES
RANKED BY TURNOVER (CONT.)
2017 MRS LEAGUE TABLES, COMPILED NOVEMBER 2018

2017       CHANGE ON 2016
R ANKING   PREVIOUS  R ANKING		                                       2017         2016         2015      % CHANGE ON   GROWTH
NUMBER     R ANKING  NUMBER    COMPANY NAME                           (£M.)        (£M.)        (£M.)   PREVIOUS YEAR   R ANKING

  76       q         56          ComScore                           7.846       10.532       11.048       -25.503%          100

  77       p         88          ABA Market Research                7.688        6.727        7.347         14.286%         26

  78       q         76          Tti Global Research                7.550        7.850       8.500          -3.822%          74

  79       p         92          Sparkler                           7.462        5.871        4.801        27.099%            9

 80        p         84          Watermelon Research                7.330        7.048       6.069           4.001%         48

  81       p         86          IFF Research                       7.278        6.812        6.667          6.841%          42

  82       =         82          Network Research & Marketing       7.153        7.234        7.159          -1.120%         67

  83       p         93          Pulsar                              7.141       6.007        5.786         18.878%          18

 84        q         74          Nielsen Netratings UK               7.121       8.323        8.267        -14.442%         93

  85       p         87          BMG Research                       7.001        6.742       6.894           3.842%          49

 86        q         85          Verve                             6.923         6.844        5.735           1.154%        62

  87       q         78          Facts International                6.857        7.643        7.528        -10.284%         86

 88        p         91          Simpson Carpenter                 6.730         6.120        5.877         9.967%          36

 89        =         89          Jigsaw Research                   6.650         6.523        6.027          1.947%         58

  90       --        --          MetrixLab UK                       6.581        3.951         5.115       66.565%            2

  91       q         80          Survey Sampling UK                6.500         7.583        5.495        -14.282%         92

  92       p         96          Northstar Research Partners        6.100        5.416       4.860          12.629%          28

  93       p         97          Promar International              5.900         5.363        5.365         10.013%          35

  94       q         83          Perspective Research Services      5.712         7.123        9.112       -19.809%          97

  95       q         94          ESA                               5.686          5.741      5.896         -0.958%          66

  96       --        --          Merkle Aquila Insight              5.657        4.153        2.200         36.215%           6

  97       q         90          ICM Direct                         5.246        6.327       6.096         -17.086%         96

 98        p         100         Trinity McQueen                     5.115       4.951        4.484          3.312%          52

  99       q         98          Truth Consulting                   5.100        5.256        4.618         -2.968%          70

 100       --        --          Springboard Research              5.034         4.473        4.102         12.542%         30

TOTAL				                                                        3294.701     3093.307     2974.025

Those in italics are estimated or partially estimated figures
Those marked ‘--’ are new entrants

THE RESEARCH LIVE INDUSTRY REPORT 2019                                                                                       10
MRS LEAGUE TABLES
TOP 20 FASTEST-GROWING
INDIVIDUAL AGENCIES
2017 MRS LEAGUE TABLES, COMPILED NOVEMBER 2018

2017             GROWTH		                                          2017       2016
R ANKING            R ATE COMPANY NAME                             (£M.)      (£M.)

   1          72.954%            IQVIA Solutions UK             74.436     43.038

  2           66.565%            MetrixLab UK                     6.581      3.951

  3           62.409%            Forrester Research              62.914    38.738

  4           38.928%            Kynetec UK                      17.009     12.243

  5            37.695%           Concentra Analytics             11.638     8.452

  6            36.215%           Merkle Aquila Insight           5.657       4.153

  7           32.862%            IHS Markit Economics            18.812     14.159

  8            27.641%           B2B International               11.009     8.625

  9            27.099%           Sparkler                         7.462      5.871

  10           25.732%           Basis Research                 10.696      8.507

  11          23.952%            PwC Research                    10.350     8.350

  12          23.005%            Join the Dots                   12.052     9.798

  13           21.870%           The Research Partnership        27.517    22.579

  14           21.265%           IDC                            37.860      31.221

  15          20.937%            GlobalData                     121.678    100.613

  16          20.205%            Mintel                         115.226    95.858

  17           20.061%           Euromonitor                    122.484    102.018

  18           18.878%           Pulsar                            7.141    6.007

  19           18.245%           Firefish                        11.860    10.030

  20           16.466%           The Gallup Organisation         15.639     13.428

Those in italics are estimated or partially estimated figures

THE RESEARCH LIVE INDUSTRY REPORT 2019                                          11
MRS LEAGUE TABLES
TOP 50 CONSOLIDATED BUSINESSES
RANKED BY TURNOVER
2017 MRS LEAGUE TABLES, COMPILED NOVEMBER 2018

2017       CHANGE ON 2016
R ANKING   PREVIOUS  R ANKING		                                             2017        2016        2015      % CHANGE ON   GROWTH
NUMBER     R ANKING  NUMBER    COMPANY NAME                                 (£M.)       (£M.)       (£M.)   PREVIOUS YEAR   R ANKING

   1       =         1           Kantar (WPP)                           456.340     447.576     453.608          1.958%          33

  2        =         2           Dunnhumby                              253.297     254.379     248.296         -0.425%          41

  3        =         3           Wood Mackenzie Research & Consulting   234.301     226.569     226.988          3.413%         30

  4        p         5           Gartner                                200.379     174.966     156.244         14.525%          19

  5        q         4           Ipsos MORI                             193.700     177.300     172.500         9.250%           22

  6        =         6           Nielsen                                 139.313    153.265     160.559         -9.103%          47

  7        p         8           Euromonitor                            122.484     102.018      88.356         20.061%          14

  8        p         33          GlobalData                              121.678    100.613      60.466        20.937%           12

  9        =         9           Mintel                                 115.226      95.858      84.658        20.205%           13

  10       q         7           GfK UK                                 105.588     103.291      129.151         2.224%          31

  11       =         11          Ebiquity                                87.376      83.569      73.874         4.556%           27

  12       q         10          Omnicom/DAS                            86.259       85.474      82.666          0.918%         36

  13       p         15          IQVIA Solutions UK                      74.436      43.038      36.217        72.954%             1

  14       q         12          Informa                                 70.920       71.613     74.775        -0.968%           42

  15       p         18          Forrester Research                      62.914      38.738      16.863        62.409%            2

  16       q         13          Teradata UK                             60.901      70.087     90.906          -13.107%        48

  17       q         16          Cello Group                             45.094      42.842      41.365          5.257%         26

  18       q         17          Information Resources                   43.663      41.844      39.957          4.347%          28

  19       q         14          MMR Group                               43.400      46.300      33.500        -6.263%           43

  20       q         19          Research Now                            38.283      34.509      34.843        10.936%          20

  21       q         20          IDC                                     37.860       31.221     25.753         21.265%           11

  22       q         21          NatCen                                  33.106      29.998      32.933         10.361%          21

  23       q         22          Double Helix                           30.000       29.000      28.000          3.448%         29

  24       q         23          BDRC Group                               27.815     27.918      26.959        -0.369%          40

  25       p         27          The Research Partnership                 27.517     22.579      21.828         21.870%          10

Those in italics are estimated or partially estimated figures
Those marked ‘--’ are new entrants

THE RESEARCH LIVE INDUSTRY REPORT 2019                                                                                           12
MRS LEAGUE TABLES
TOP 50 CONSOLIDATED BUSINESSES
RANKED BY TURNOVER (CONT.)
2017 MRS LEAGUE TABLES, COMPILED NOVEMBER 2018

2017       CHANGE ON 2016
R ANKING   PREVIOUS  R ANKING		                                    2017       2016       2015      % CHANGE ON   GROWTH
NUMBER     R ANKING  NUMBER    COMPANY NAME                        (£M.)      (£M.)      (£M.)   PREVIOUS YEAR   R ANKING

  26       =         26          YouGov                         27.100     24.960     22.900          8.574%          23

  27       q         25          Toluna                         22.805     25.046     20.591        -8.948%           45

  28       q         24          Digital Unlimited Group        22.665     26.159     26.667        -13.357%          49

  29       p         34          WorldOne Research              20.563     17.940     16.450         14.621%          18

  30       q         29          Chime Communications           20.300     20.217      19.011          0.411%        38

  31       p         39          IHS Markit Economics            18.812     14.159    12.445        32.862%            5

  32       q         31          Frost & Sullivan               18.800     18.468     18.280          1.798%          35

  33       q         30          Confirmit                       17.957    19.754      18.351        -9.097%         46

  34       q         32          Future Thinking                17.588      19.105     17.416        -7.940%          44

  35       p         43          Kynetec UK                     17.009     12.243     13.923        38.928%            3

  36       q         35          MaritzCX                       16.793     16.463     16.380         2.004%           32

  37       q         36          Populus Group                  16.790     15.804     13.489         6.239%           25

  38       p         40          The Gallup Organisation        15.639     13.428      11.507        16.466%          16

  39       q         37          Hay Group Insight               15.150     15.100    15.050          0.331%         39

  40       p         41          Incite Marketing Planning      14.983     12.996     12.926         15.289%          17

  41       p         42          Prescient Healthcare           13.574      12.716    10.974          6.747%          24

  42       --        --          Join the Dots                  12.052      9.798      7.760        23.005%            9

  43       p         50          Firefish                       11.860     10.030      11.237        18.245%          15

  44       p         46          Defaqto                         11.653     11.551    13.247         0.883%           37

  45       --        --          Concentra Analytics            11.638      8.452       7.213       37.695%            4

  46       q         38          Shoppertrak                     11.166    14.437     12.969       -22.657%          50

  47       --        --          B2B International              11.009      8.625      8.227         27.641%           6

  48       --        --          Basis Research                 10.696      8.507       7.461       25.732%            7

  49       --        --          PwC Research                   10.350      8.350      8.300        23.952%            8

  50       q         49          MARU/edr                       10.291     10.095      9.126          1.942%          34

Those in italics are estimated or partially estimated figures
Those marked ‘--’ are new entrants

THE RESEARCH LIVE INDUSTRY REPORT 2019                                                                                13
MRS LEAGUE TABLES
TOP 20 FASTEST-GROWING
BUSINESSES
2017 MRS LEAGUE TABLES, COMPILED NOVEMBER 2018

2017             GROWTH		                                           2017       2016
R ANKING            R ATE COMPANY NAME                              (£M.)      (£M.)

   1          72.954%            IQVIA Solutions UK              74.436     43.038

  2           62.409%            Forrester Research              62.914     38.738

  3           38.928%            Kynetec UK                      17.009      12.243

  4            37.695%           Concentra Analytics              11.638     8.452

  5           32.862%            IHS Markit Economics             18.812     14.159

  6            27.641%           B2B International                11.009     8.625

  7            25.732%           Basis Research                  10.696      8.507

  8           23.952%            PwC Research                    10.350      8.350

  9           23.005%            Join the Dots                   12.052      9.798

  10           21.870%           The Research Partnership         27.517    22.579

  11           21.265%           IDC                             37.860      31.221

  12          20.937%            GlobalData                      121.678    100.613

  13          20.205%            Mintel                         115.226     95.858

  14           20.061%           Euromonitor                    122.484     102.018

  15           18.245%           Firefish                         11.860    10.030

  16           16.466%           The Gallup Organisation         15.639      13.428

  17           15.289%           Incite Marketing Planning       14.983     12.996

  18            14.621%          WorldOne Research               20.563      17.940

  19           14.525%           Gartner                        200.379     174.966

  20           10.936%           Research Now                    38.283     34.509

Those in italics are estimated or partially estimated figures

THE RESEARCH LIVE INDUSTRY REPORT 2019                                           14
NOTES ON LEAGUE TABLES

TOP 100 INDIVIDUAL AGENCIES
Entry 14: Forrester Research. The reported turnover reflects the new          Entry 8: GlobalData. Formerly Progressive Digital Media, which
position of Forrester Research Ltd as the international operational           acquired GlobalData Holdings Ltd in 2016, and in 2017 changed the
headquarters for Forester Research Inc., including transfer to                name of the combined group to GlobalData plc. Within a diverse
London of business previously headquartered in Switzerland.                   portfolio its primary focus is on healthcare, consumer, and information/
                                                                              communications technology.
Entry 15: Teradata UK. The reported result reflects the sale of
the marketing applications division during 2016.                              Entry 11: Ebiquity consists of three divisions – Market Intelligence,
                                                                              Media Value Measurement, and Marketing Performance Evaluation.
Entry 21: Research Now. Merged during 2018 with SSI.
                                                                              Entry 12: Omnicom/DAS includes Hall & Partners, Flamingo Research,
Entry 55: Datamonitor. This is principally Datamonitor Healthcare
                                                                              Promise Communispace, Adelphi International Research, and
following divestment of other divisions to Progressive Digital
                                                                              The Planning Shop International.
Media which became GlobalData.
                                                                              Entry 13: IQVIA Solutions UK. Formerly IMS Health. The reported
Entry 59: PwC Research. Formerly PwCr2i research to insight. Name
                                                                              turnover for 2017 reflects the consolidation into this company of the
change and result reflect the acquisition mid-2017 of Optimisa Research.
                                                                              former IMS Hospital Group, IMS Information Solutions, and IMS
Entry 73: System1 Research. Formerly Brainjuicer. The reported                Technology Solutions. In October 2016, IMS Health (a global provider
result reflects a 15-month trading period as part of a change of              of information, research, and technology services for the healthcare
financial year-end.                                                           industry) merged with Quintiles (a contract research organisation for
                                                                              the pharmaceutical, biotechnology, and medical device industries).
Entry 79: Sparkler. The company was sold in May 2018 to
                                                                              In November 2017, Quintiles IMS changed its name to IQVIA.
management consultancy PA Consulting Group.
                                                                              Entry 14: Informa includes Datamonitor and Informa Telecoms &
Entry 90: MetrixLab is a company within the Macromill Group,
                                                                              Media (formerly Ovum Europe).
a global online and consumer insights and analytics company,
headquartered in Tokyo.                                                       Entry 17: Cello Group includes 2CV, Cello Health Insight, and
                                                                              Cello Bright Blue (formerly RS Consulting).
Entry 91: Survey Sampling UK. Merged during 2018 with Research Now.
                                                                              Entry 19: MMR Group includes Healthcare Research Worldwide
Entry 94: Perspective Research Services. The reported turnover
                                                                              and MMR Research Worldwide.
reflects the retention within Perspective of ‘traditional’ data collection,
and the transfer of digital data collection to Alligator, a separate          Entry 23: Double Helix is part of McCann Health within Interpublic, and
business within BDRC Group.                                                   contributes research to the McCann Health Consultancy launched
                                                                              during 2016.
Entry 99: Truth Consulting: Part of the Instinct Partners Group of
companies, a business communications consultancy group.                       Entry 24: BDRC Group includes BDRC Continental, ESA, Perspective
                                                                              Research Services, Alligator Research, and Viewpoint. In mid-2018,
                                                                              BDRC Group was acquired by French research group BVA.
TOP 50 CONSOLIDATED BUSINESSES                                                Entry 28: Digital Unlimited Group (formerly Creston until acquisition
                                                                              by Dbay Advisors). Within its research and insights division are
Entry 1: Kantar is the Data Investment Management Division of WPP plc.
                                                                              Walnut Unlimited (formerly Marketing Sciences), ICM Unlimited,
The Kantar turnover incorporates Kantar TNS, Kantar Millward Brown,
                                                                              and ICM Direct.
Kantar Media, Kantar Retail, Lightspeed Research, Added Value, and
Precise Media Monitoring. Its businesses are grouped with the Kantar          Entry 30: Chime Communications includes Chime Insight &
prefix under twelve operating brands – Added Value, Futures, Health,          Engagement (incorporating Facts International, Opinion Leader, and
IMRB, Lightspeed, Media, Millward Brown, Public, Retail, TNS,                 Watermelon Research), plus research turnover generated by other
Vermeer, and Worldpanel.                                                      agencies within the group. In 2018 Watermelon Research (formally
                                                                              CIE) was transferred to join Tree London to be managed in the VCCP
Entry 2: Dunnhumby is wholly owned by Tesco plc.
                                                                              division within Chime.
Entry 3: Wood Mackenzie Research & Consulting. Total turnover reflects
                                                                              Entry 35: Kynetec UK. In the final quarter of 2017, Kynetec acquired
a UK-based business delivering its services via the internet to a global
                                                                              Market Probe Europe and Market Probe Agriculture & Animal Health.
client base in the energy, mining, and metals industries. Acquired in
2015 by US-based energy sector data firm Verisk Analytics.                    Entry 37: Populus Group includes Populus and Populus Data Solutions.
Entry 6: Nielsen includes AC Nielsen, Nielsen Media Research,                 Entry 46: Shoppertrak (formerly Footfall following acquisition by
Nielsen Netratings, Nielsen Book Services, and Nielsen Sports.                Tyco from Experian). Turnover initially declined because of the
                                                                              formation of a separate new subsidiary in Germany to handle trade
                                                                              with European clients. Following a change to financial year-end, the
                                                                              2016 result represented a 16-month trading period. The 2017 figure
                                                                              is a 12-month result.

THE RESEARCH LIVE INDUSTRY REPORT 2019                                                                                                                15
RESEARCHLIVE THE PLATFORM WHERE INDUSTRY LEADERS GIVE THEIR VIEWS ON RESEARCH, INSIGHT AND SUCCESS. Read the latest research sector news. Plus exclusive interviews with Levi Roots on Reggae Reggae Sauce and staying true to his core consumers Barb’s Justin Sampson on multiple device TV viewing measurement Visit research-live.com for regular comment from Rory Sutherland and Crawford Hollingworth, and a special report into artificial intelligence in the research sector. DAILY market research news INDUSTRY movers and shakers LATEST research techniques BLOGS, opinion, comment www.research-live.com researchlive
INTERNATIONAL OUTLOOK:
ANALYSIS OF 2018 GRBN GLOBAL TOP 25
Exclusive to this report, Diane Bowers analyses the results of the top 25 league table of
global research organisations conducted by the Global Research Business Network (GRBN).

  For the top 25 global market research, data
  analytics and insights companies listed in this year’s
  report (pages 22 and 23) the annual revenue increased
  by $1.5bn in 2017 versus 2016. The total 2017 revenue
  is $26.2bn versus $24.8bn in 2016, a growth rate of
  5.9% (3.8% when adjusted for inflation). However, it
  is important to note that one company in this year’s
  global top 25 achieved a 33% growth rate in 2017,
  which significantly inflates the growth rate for all
  of the 25 companies. If you correct for this outlier,
  then the growth rate in 2017 was 3.7%, 0.9% lower
  than 2016’s growth rate of 4.6%.

THE RESEARCH LIVE INDUSTRY REPORT 2019                                                 17
INTERNATIONAL OUTLOOK:
ANALYSIS OF 2018 GRBN GLOBAL TOP 25

COUNTRIES AND CURRENCIES (FIG. 1)                     The United Kingdom contingent includes
The currency exchange rate fluctuation between        three top 10 companies, beginning with no.1
2017 and 2016 had a mixed effect on the growth        and no.2 on the list, Nielsen and Kantar, as well
rate in 2017. The Global Top 25 companies submit      as no.9 dunnhumby. The other UK companies
their annual revenue in their ‘parent’ or home        are no.11 Wood MacKenzie, no.16 Cello Health,
country currency. These figures are converted         no.19 Euromonitor International, no.21 Mintel,
to US dollars based on the average year currency      and no.24 YouGov.
exchange rates provided by the US Federal Reserve
Bank. In 2017 the currency exchange rate against      Four of the 12 companies claiming the
the US dollar had a negative impact on the            US dollar as their home currency are included
British pound and a slightly negative impact          in the Top 10: no.3 IQVIA, no.4 Gartner Research,
on the Japanese yen. The currency exchange            no.7 IRI (Information Resources), and no.8 Westat.
rate between the euro and the US dollar was           The other US companies are: no.12 comScore,
relatively the same from 2016 to 2017.                no.13 The NPD Group, no.15 ICF, no.17 Forrester
                                                      Research Services, no.18 DRG (Decision
The British pound is the home country currency        Resources Group), no.22 MaritzCX, no.23 LRW
for one-third of the Global Top 25 companies.         (Lieberman Research Worldwide), and
The eight British organisations account for           no.25 Informa Financial Intelligence.
the highest percentage of total 2017 revenue,
exceeding the US contingent of 12 organisations       The euro represents 14.5% of the total 2017 global
by almost $2.7bn. The eight UK organisations          revenue, with 8.2% of that revenue coming from
totalled about $12.2bn (46.4% of total 2017 revenue   France, including no.5 on the top 10, Ipsos, and
for all of the top 25 organisations), while the       no.20 BVA. Germany’s 6.3% of the global revenue
US organisations’ total 2017 revenue of $9.5bn        is represented by one company, GfK, no.6 on the
represented 36.2% of the total 2017 revenue for       top 10 list.
the Global Top 25.
                                                      The Japanese yen represents 2.9% of the 2017
                                                      global revenue, and includes two companies,
                                                      beginning with no.10 on the top 10 list, INTAGE
                                                      Holdings, along with #14 Macromill Group.

THE RESEARCH LIVE INDUSTRY REPORT 2019                                                                     18
INTERNATIONAL OUTLOOK:
ANALYSIS OF 2018 GRBN GLOBAL TOP 25
FIG. 1: COUNTRIES AND CURRENCIES
DOMESTIC INTERNATIONAL
REVENUE FROM REVENUE FROM 2016
NUMBER OF 2017 PERCENT HOME COUNTRY OUTSIDE HOME COUNTRY GLOBAL
COMPANIES GLOBAL REVENUE CHANGE (% OF TOTAL 2017 (% OF TOTAL 2017 REVENUE
CURRENCY (% OF TOTAL) (% OF TOTAL) FROM 2016 GLOBAL REVENUE) GLOBAL REVENUE) (% OF TOTAL)
British pound 8 $12,181.4 3.8% $1,796.5 $10,384.9 $11,733.5
United Kingdom (32%) (46.4%) (14.7%) (85.3%) (47.4%)
US dollar 12 $9,506.5 12.0% $5,570.8 $3,935.7 $8,490.8
United States (48%) (36.2%) (58.6%) (41.4%) (34.2%)
Euro 3 $3,793.5 -0.5% $626.0 $3,167.5 $3,810.8
(12%) (14.5%) (16.5%) (83.5%) (15.4%)
France 2 $2,143.5 1.0% $226.0 $1,917.5 $2,133.6
(8%) (8.2%) (10.5%) (89.5%) (8.6%)
Germany 1 $1,650.0 -1.6% $400.0 $1,250.0 $1,677.2
(4%) (6.3%) (24.2%) (75.8%) (6.8%)
Yen 2 $767.5 3.6% $645.3 $122.2 $740.7
Japan (8%) (2.9%) (84.1%) (15.9%) (3.0%)
TOTALS 25 $26,248.9 5.9% $8,638.6 $17,610.3 $24,775.8
(32.9%) (67.1%)
“FOR THE TOP 25 GLOBAL MARKET
RESEARCH, DATA ANALYTICS AND
INSIGHTS COMPANIES LISTED IN
THIS YEAR’S REPORT THE ANNUAL
REVENUE INCREASED BY $1.5BN
IN 2017 VERSUS 2016.”
THE RESEARCH LIVE INDUSTRY REPORT 2019 19INTERNATIONAL OUTLOOK:
ANALYSIS OF 2018 GRBN GLOBAL TOP 25
HOW GLOBAL? (FIG. 2)
Many of the global top 25 companies focus their derived more than 75% of their 2017 revenue from
business within their home country. This is true international research, compared to an average
even for some of the largest companies on the list. of about 41% for international research from
Sixteen companies in the Global Top 25 (including US companies. The two companies from France –
numbers 7 through to 10 – IRI, Westat, dunnhumby, Ipsos and BVA – registered the highest percentage
and INTAGE Holdings) derive more than 60% of of revenue from international research averaging
their annual revenue from their home country. 89.5%. The UK contingent of eight companies
Even so, the revenue generated by the global top in the Global Top 25 derived 85.3% of their 2017
25 companies outside their home countries is revenue from outside the UK and GfK realised
more than twice the revenue they generate in 75.8% of its 2017 revenue from outside of Germany.
their home countries.
While much lower than the UK, France,
DOMESTIC (HOME COUNTRY) VS. and Germany, the 41.4% average 2017
INTERNATIONAL (OUTSIDE HOME COUNTRY) international revenue for the 12 US companies
When you look at domestic vs. international in this year’s Global Top 25 Report far exceeded
revenue by country, the Global Top 25 Report the international research component registered
supports the MRS League Tables commentary that by Japan’s two companies in the global top 25
the US research industry is not as internationally- list. Japan’s two Tokyo companies, INTAGE
focused. While the sample size is small, those Holdings and Macromill Group, together
companies on this year’s Global Top 25 list based derived only 15.9% of their 2017 annual
in the United Kingdom, France, and Germany revenues from international research.
FIG. 2: COUNTRY STATISTICS
INTERNATIONAL
DOMESTIC REVENUE AVERAGE
NUMBER OF TOTAL REVENUE (OUTSIDE HOME RESEARCH-ONLY NUMBER
COMPANIES GLOBAL (HOME COUNTRY) COUNTRY) FULL-TIME OF COUNTRIES
COUNTRY (% OF TOTAL) REVENUE (% OF TOTAL) (% OF TOTAL) EMPLOYEES WITH OFFICES
United Kingdom 8 $12,181.4 $1,796.5 $10,384.9 84,216 39
(14.7%) (85.3%)
United States 12 $9,506.5 $5,570.8 $3,935.7 80,579 26
(58.6%) (41.4%)
France 2 $2,143.5 $226.0 $1,917.5 17,464 49
(10.5%) (89.5%)
Germany 1 $1,650.0 $400.0 $1,250.0 12,990 74
(24.2%) (75.8%)
Japan 2 $767.5 $645.3 $122.2 4,527 11
(84.1%) (15.9%)
THE RESEARCH LIVE INDUSTRY REPORT 2019 20INTERNATIONAL OUTLOOK:
ANALYSIS OF 2018 GRBN GLOBAL TOP 25
PORTFOLIO OF SERVICES METHODOLOGY
Reading through the profiles of the Global Top With the help of the GRBN, which includes the
25 companies confirms that their services are national research associations in over 40 countries
expanding and changing. Most businesses around the world, invitations are sent out to
are vested in online research, panel research, research and data analytics firms with estimated
social media measurement, data analytics, revenue of more than $75m. We ask for revenue
and customer experience. The Global Top 25 information for the prior calendar year and
organisations are increasing their focus on and for the year preceding that, in order to assess
investment in social media, predictive analytics, the growth rate. Other company data is also
data visualisation, and enterprise feedback requested, including a description of the company’s
management, among other emerging sub- management, services, specialisations, etc.
disciplines that are being studied by Michael The rate of growth from year to year has been
Brereton and the Research Transformed adjusted to account for revenue gains or losses
Collaborative at Michigan State University from acquisitions or divestitures. Verification
in the US, by GRBN and its member national of revenue is required of each private firm for
associations around the world, especially ranking by a third party, usually it’s the outside
the Market Research Society (MRS) in the UK, accounting firm. For further information,
and by ESOMAR and other international contact Diane Bowers at
organisations. dianebowersadvisorysvcs@gmail.com.
These Global Top 25 companies show that Diane Bowers is a consultant to research,
syndicated and tracking studies, along insights, and data analytics businesses and
with the measurement of audiences, industry associations, including GRBN.
consumer purchases and behaviour, as well
as subscriptions and contracts for research About GRBN
and data analytics products and services on GRBN, the Global Research Business Network,
industries, trends, media, marketing, etc. connects 45 research associations and over
are moving research expenditure into 3500 research businesses on six continents.
the client’s ‘essential, must have’ budget,
rather than the discretionary category.
COPYRIGHT
© 2018 GRBN
Please provide your comments, suggestions, The copyright on the material presented in the GRBN Global Top 25 table is owned
by Global Research Business Network, GRBN. Parts or the whole of the material in
and guidance to me, Diane Bowers, as well as to this report may only be reproduced, distributed, or transmitted if GRBN is clearly
acknowledged as the copyright owner and the source is clearly acknowledged as
the Global Research Business Network (GRBN), ‘2018 GRBN Global Top 25 Companies Report’.
and, especially, to the Market Research Society DISCLAIMER
(MRS), which sponsored this special edition The information provided within the GRBN Global Top 25 table is for general
informational purposes only. There are no representations or warranties, expressed
of the GRBN Global Top 25 Report for 2018. or implied, about the completeness, accuracy, reliability, or suitability with respect
to the information contained in this report for any purpose. Any use of this information
is at your own risk. Neither GRBN nor Diane Bowers assume and accept any liability
to any party for any loss, damage, or disruption caused by applying the information
shared in this report.
THE RESEARCH LIVE INDUSTRY REPORT 2019 21THE 2018 GRBN GLOBAL TOP 25
GLOBAL GLOBAL RESEARCH ONLY
R ANK R ANK YEAR FULL-TIME
2018 1017 ORGANISATION FOUNDED HEADQUARTERS HOME COUNTRY EMPLOYEES
1 1 Nielsen Holdings plc* ** 1923 London United Kingdom 46,000
2 2 Kantar* ** 1993 London United Kingdom 30,000
3 3 IQVIA* 2016 Danbury, CT; Durham, NC U.S. 55,000
4 -- Gartner Research* 1972 Stamford, CT U.S. 10,400
5 4 Ipsos SA* 1975 Paris France 16,660
6 5 GfK* 1934 Nuremberg Germany 12,990
7 6 IRI (Information Resources) 1979 Chicago, IL U.S. 5,000
8 7 Westat 1963 Rockville, MD U.S. 1,900
9 10 dunnhumby* ** 2001 London United Kingdom 2,300
10 9 INTAGE Holdings Inc.*** 1960 Tokyo Japan 2,527
11 8 Wood MacKenzie* ** 1973 Edinburgh United Kingdom 1,337
12 -- comScore 1999 Reston, VA U.S. 1,700
13 11 The NPD Group 1966 Port Washington, NY U.S. 1,650
14 12 Macromill Group* 2000 Tokyo Japan 2,000
15 13 ICF 1967 Fairfax, VA U.S. 1,500
16 25 Cello Health plc* ** 2004 London United Kingdom 472
17 -- Forrester Research Services* 1983 Cambridge, MA U.S. 515
18 15 Decision Resources Group (DRG)* 1990 Burlington, MA U.S. 1,000
19 -- Euromonitor International* ** 1972 London United Kingdom 2,100
20 16 BVA 1970 Balma France 804
21 18 Mintel* ** 1972 London United Kingdom 1,200
22 17 MaritzCX 1973 Lehi, UT U.S. 824
23 20 Lieberman Research Worldwide (LRW) 1973 Los Angeles, CA U.S. 550
24 21 YouGov ** 2000 London United Kingdom 807
25 -- Informa Financial Intelligence 2016 Boston, MA U.S. 540
199,776
† Data are represented in millions of U.S. dollars
* Some or all figures are not made available by this company so instead are based on research and estimation by the Report author
** 2017 currency exchange rate from British Pounds to US Dollars deflated the growth rate percentage
*** Fiscal year ended March 31, 2017
THE RESEARCH LIVE INDUSTRY REPORT 2019 222017 RESEARCH REVENUE 2016 RESEARCH REVENUE
TOTAL
NUMBER OF PERCENT
COUNTRIES WITH OF GLOBAL
OFFICES AND GLOBAL PERCENT REVENUE REVENUE REVENUE REVENUE REVENUE GLOBAL
WHOLLY-OWNED RESEARCH CHANGE FROM HOME FROM OUTSIDE FROM OUTSIDE FROM HOME FROM OUTSIDE RESEARCH
† † † † † †
SUBSIDIARIES REVENUE FROM 2016 COUNTRY HOME COUNTRY HOME COUNTRY COUNTRY HOME COUNTRY REVENUE †
106 $6,572.0 4.2% $179.6 $6,392.4 97.3% $207.8 $6,101.2 $6,309.0
100 $3,995.0 3.8% $588.2 $3,406.8 85.3% $606.7 $3,240.3 $3,847.0
105 $3,465.0 5.0% $1,430.0 $2,035.0 58.7% $1,358.0 $1,943.0 $3,301.0
100 $2,471.3 33.1% $1,433.2 $1,038.1 42.0% $1,077.1 $779.9 $1,857.0
88 $1,974.0 1.0% $131.0 $1,843.0 93.4% $133.8 $1,828.2 $1,962.0
74 $1,650.0 -1.6% $400.0 $1,250.0 75.8% $408.0 $1,269.2 $1,677.2
9 $1,149.4 12.0% $733.4 $416.0 36.2% $639.2 $387.5 $1,026.7
6 $557.5 9.0% $551.1 $6.4 1.1% $500.7 $10.8 $511.5
29 $458.0 -1.9% $326.5 $131.5 28.7% $344.8 $122.2 $467.0
9 $450.5 2.0% $417.3 $33.2 7.4% $410.1 $31.5 $441.6
20 $444.7 -- $302.0 $142.7 32.1% $307.1 $135.7 $442.8
23 $403.5 1.0% $332.3 $71.2 17.6% $316.8 $82.7 $399.5
25 $382.4 12.1% $289.4 $93.0 24.3% $259.0 $82.0 $341.0
13 $317.0 6.0% $228.0 $89.0 28.1% $214.6 $84.5 $299.1
12 $228.5 2.3% $170.6 $57.9 25.3% $163.7 $59.6 $223.3
3 $218.2 -2.6% $58.1 $160.1 73.4% $58.1 $165.9 $224.0
10 $216.5 1.0% $166.7 $49.8 23.0% $165.7 $49.5 $215.2
6 $180.8 1.6% $129.5 $51.3 28.4% $128.0 $50.0 $178.0
14 $180.0 12.5% $157.9 $22.1 12.3% $138.3 $21.7 $160.0
9 $169.5 -1.2% $95.0 $74.5 44.0% $97.0 $74.6 $171.6
14 $169.0 12.7% $148.5 $20.5 12.1% $129.9 $20.1 $150.0
5 $167.3 -1.1% $124.4 $42.9 25.6% $128.5 $40.7 $169.2
3 $147.9 12.6% $107.8 $40.1 27.1% $92.3 $39.0 $131.3
22 $144.5 8.1% $35.7 $108.8 75.3% $32.3 $101.4 $133.7
8 $136.4 -- $102.4 $34.0 24.9% $103.8 $33.3 $137.1
$26,248.9 5.9% $8,638.6 $17,610.3 67.1% $8,021.3 $16,754.5 $24,775.8
THE RESEARCH LIVE INDUSTRY REPORT 2019 23TIME TO FLEX Graeme Lawrence, chief client officer, Join the Dots Twelve months ago in this very same report, I commented on our continued growth at Join the Dots, attributing our success to following a plan. As part of the five year planning cycle I mentioned, we uncovered three core challenges faced by clients which we feel will impact the future growth of the industry. These challenges are driven by change. SPONSOR THE RESEARCH LIVE INDUSTRY REPORT 2019 24
TIME TO FLEX

ACCEPT CHANGE                                             A key intention with the insight ecosystem is
It’s a cliché to say we live in a time of rapid change,   to pre-empt the transformation of online
but this will probably be the slowest rate of change      communities as we know them. As industry
we will experience in the rest of our working lives.      leaders who have worked with communities for
The question is, what sort of change is affecting         over 10 years, we’ve witnessed this methodology’s
people, and therefore our industry in attempting          evolution first-hand. But businesses today face
to understand them?                                       new challenges, consumers have new distractions,
                                                          and research has new barriers. Now more than
In a nutshell, the research industry is under             ever, online communities must offer both agile
pressure due to economic change (the pressure             and immersive methodologies to deliver faster,
to deliver fast, high quality insights with               more in-depth insights. Our insight ecosystem
increasingly tight budgets); social change                enables us to do just that.
(the pressure to take advantage of all the insights
that are already out there across social media            BE FLEXIBLE
platforms); and technologically driven change             We consider flexibility the key to future success
(the pressure to get more out of the mass of data         (dare I say, survival?) in our industry – for agencies
that’s now available inside client organisations).        and clients alike. Only through combining
                                                          techniques around asking, listening and observing
EMBRACE OPPORTUNITIES                                     human behaviour, will we unpick the age
But every challenge presents an opportunity               old problem presented to us: identifying the
and that’s exactly what we’ve embraced at Join            differences between what people claim they
the Dots. Our response to our clients’ challenges         do and what they actually do.
caused by change, has been to develop an insight
ecosystem with three cornerstones, from which             Along with many other agencies, we’ve had a
we’ve learned how to understand people; these             relatively challenging 12 months at Join the Dots.
are ask, listen and observe. Under these we can           So in this time of slowing growth and increasing
flex our methodology, combine approaches and              pressure in our industry, I’d encourage researchers
add context, to join the dots and help clients            on both sides of the fence to accept the changing
make better business decisions.                           world we live in, embrace opportunities that may
                                                          present themselves, and be more flexible in the
                                                          solutions offered.

“ONLINE COMMUNITIES MUST
 OFFER BOTH AGILE AND
 IMMERSIVE METHODOLOGIES
 TO DELIVER FASTER, MORE
 IN-DEPTH INSIGHTS.”

THE RESEARCH LIVE INDUSTRY REPORT 2019                                                                        25
PERSPECTIVE FROM THE FASTEST GROWERS Jane Bainbridge, editor, Research Live With economic uncertainty and macro political factors affecting our commercial world, it’s particularly interesting to hear from those performing well in such a climate, to find out how they are achieving their growth. THE RESEARCH LIVE INDUSTRY REPORT 2019 26
PERSPECTIVE FROM
THE FASTEST GROWERS

Casting an eye over this year’s fastest                  And, of course, organic growth can be achieved
growers shows both big and small                         with different business strategies – building
                                                         additional work with existing clients or going
agencies can see a significant hike in                   after new ones. Unsurprisingly, those making
their revenue – that it’s not just the                   this table of top growers are doing both.
small, nimble agencies that can see
double-digit revenue increases.                         “We have seen very high growth rates with clients
                                                         who are in what we call ‘phase two’, meaning
But what’s worth noting is that since the ranking        they’ve experienced our way of working and
was compiled, some of those achieving this level         its impact in one region or one key domain, and
of success have already caught the eye of agencies       then we accelerate together globally and/or
on the look out for acquisitions.                        across more topics. Winning new clients has
                                                         always been a priority for us,” says Elias.
For instance, Sparkler – which also won the
2017 Research Live Award for best agency with            Firefish similarly aims to build on its existing
turnover under £20m – was bought by innovation           strong business relationships to sell additional
and transformation consultancy PA Consulting in          offers such as kids and family, tracking,
May 2018. B2B International joined Dentsu Aegis          innovation and then seek new clients in sectors
Network’s creative B2B agency, gyro, in October          that are “hungry for human insight” as its group
2018 and going back another year, Pulsar merged          CEO, Jem Fawcus describes them. In recent years,
with qual research agency Face in January 2017.          Firefish has extended into innovation, tracking
                                                         and strategic consultancy.
Growth can come in two forms – organic and by
acquisition. While the previous examples show            Ashby says growing existing clients’ work has
that acquisitions are certainly on many people’s         been a big factor in Join the Dots’ growth and
radars, for the agencies I spoke to for this feature,    that being flexible has been paramount.
organic growth was the preferred method.

Quentin Ashby, CEO of Join the Dots, says:              “WE’VE CONCENTRATED ON
“We’ve concentrated on organic growth to                 ORGANIC GROWTH TO DATE.
date. Five consecutive years of 20% plus growth
                                                         FIVE CONSECUTIVE YEARS OF
suggests this strategy has served us well but
we’re not averse to acquisition if the right
                                                         20% PLUS GROWTH SUGGESTS
opportunity presents itself.”
                                                         THIS STRATEGY HAS SERVED
                                                         US WELL.”
Thijs Elias, global business director at MetrixLab
adds: “We believe the two [organic and
acquisition] go hand-in-hand, with one
complementing the other.”

THE RESEARCH LIVE INDUSTRY REPORT 2019                                                                    27
PERSPECTIVE FROM
THE FASTEST GROWERS
“We’ve been able to offer flexible solutions – “Over the past four years we have been building
both agile and immersive methodologies – to our market access capabilities. This now forms a
help clients support their own stakeholders and significant part of our business and we run large
tackle the challenges faced in today’s economy. numbers of combined market access/market
Our online community model lends itself to research studies,” adds Jeffery.
developing long-standing relationships.”
Physical expansion has also been important,
To this end, Join the Dots has developed its with the company opening three new offices – two
immersive techniques through its qualitative in the US and one in France. “Our San Francisco
brand, Spirit, and its culture and trends team. office gives us access to West Coast based pharma
“We’ve also expanded our expertise to offer social companies; our office in New York helps support
intelligence to answer briefs that require agility.” the significant healthcare business which is based
on the East Coast and is also an attractive option
Mark Jeffery, founding director of healthcare to potential employees,” explains Jeffery.
specialist The Research Partnership, points to his
business’ dual approach, winning new accounts BUILDING THE WORKFORCE
and increasing average project size. “Our directors Gaining new clients and extending offices
and business development team have also been requires additional resources. Join the Dots runs
working hard to secure new clients. We are now a graduate recruitment programme which helps
working with all of the top 10 pharmaceutical bring in fresh talent and also recruited heavily
companies in the world.” in 2017 – at both mid-level and senior – to support
its projected growth.
And being a healthcare specialist hasn’t stopped
The Research Partnership from entering new “A number of key hires have contributed to
spaces. “We’ve expanded more into the medical growing our immersive and agile offer – namely
technology area. There is natural overlap with developing a team of social intelligence experts,
our current pharma-based business and it is also recruiting a commercial semiotician and
a sector that’s anticipated to grow 5% per year in expanding our in-house creative team. In
the next four to five years. addition, we’ve bolstered our team of senior
client directors,” explains Ashby.
“IN OUR GRADUATE PROGRAMME The Research Partnership has grown its workforce
THIS YEAR WE TOOK ON 17 by 15% and is still looking to recruit more, as well
RESEARCH ANALYSTS ACROSS as running its own graduate scheme. “We are
constantly on the lookout for new people who
OUR THREE MAJOR SITES IN
can bring fresh ideas and new areas of expertise.
THE US, UK AND SINGAPORE.”
In our graduate programme this year we took on
17 research analysts across our three major sites
in the US, UK and Singapore. However, we’re also
committed to building the careers of our current
employees and have promoted 33 staff this year,”
says Jeffery.
THE RESEARCH LIVE INDUSTRY REPORT 2019 28PERSPECTIVE FROM
THE FASTEST GROWERS
“CLIENTS ARE UNDER A LOT OF
PRESSURE. THE BACKDROP OF
BREXIT MEANS PEOPLE AND
BUSINESSES ARE MORE CAUTIOUS
ABOUT SPENDING MONEY DUE
TO THE UNCERTAINTY WE FACE.”
In terms of new expertise in the business, he’s about spending money due to the uncertainty
brought in two analytics directors – one in the UK, we face. As researchers we’re having to learn to
one in New York – to strengthen its quantitative collaborate with clients more closely than ever
side and statistical modelling, segmentation and to help them in this challenging environment.
conjoint methods.
“There has definitely been a tightening of purse
Firefish’s Fawcus says he “runs lean” using a strings and a slowing down of decision making
network of associates to step up during busy in the final few months leading up to Brexit.
periods, although he has invested in project Clients are struggling with the uncertainty of
management teams “to free up the valuable consumers, and the knock-on effect is more
thinking time of our strategic execs”. cautious budgeting,” he adds. “We’re seeing
clients’ budgets squeezed across the board rather
BUSINESS CONDITIONS than one area. More than ever, the speed-quality-
Even those performing well are feeling the cost trilemma has come to the fore, but we’re
pressures of current business conditions, working closely with clients to advise how best
with many describing them as “tough”. to spend insight budgets for maximum ROI.”
Jon Arthurs, MetrixLab’s UK managing director, For Fawcus, Brexit is raising very specific business
says: “It’s been a tumultuous year for the research problems. “My European staff are leaving the
and marketing industries in 2018 with change in UK and I’m having to set up complicated payroll
technology, client needs and marketing strategies. structures to keep them employed from their
The old status quo continues to be questioned home countries.”
and those agencies who are agile, innovative and
efficient are the ones who are gaining share.” However, Jeffery isn’t seeing any Brexit effects
yet and says business conditions have mostly
And it’s never long before the uncertainty around remained good. “A few companies have had hire
Brexit is mentioned. Ashby says: “Clients are freezes or had rumours of being sold off which has
under a lot of pressure. The backdrop of Brexit created uncertainty in spite of a ‘business as usual’
means people and businesses are more cautious mantra; fortunately, we have breadth and depth
with the clients we work with which protects us
from the highs and lows.
THE RESEARCH LIVE INDUSTRY REPORT 2019 29You can also read