The Revised IRAS-FSC Redshift Catalogue (RIFSCz)
←
→
Page content transcription
If your browser does not render page correctly, please read the page content below
MNRAS 442, 2739–2750 (2014)                                                                                                doi:10.1093/mnras/stu915

The Revised IRAS-FSC Redshift Catalogue (RIFSCz)

Lingyu Wang,1‹ Michael Rowan-Robinson,2 Peder Norberg,1 Sebastien Heinis3
and Jiaxin Han1
1 Institute
         for Computational Cosmology, Department of Physics, Durham University, South Road, Durham DH1 3LE, UK
2 AstrophysicsGroup, Blackett Laboratory, Imperial College of Science Technology and Medicine, London SW7 2BZ, UK
3 Department of Astronomy, University of Maryland, College Park, MD 20742-2421, USA

Accepted 2014 May 6. Received 2014 May 6; in original form 2014 February 20

                                                                                                                                                      Downloaded from http://mnras.oxfordjournals.org/ at Imperial College London Library on November 14, 2014
                                        ABSTRACT
                                        We present a Revised IRAS-FSC Redshift Catalogue (RIFSCz) of 60 303 galaxies selected at
                                        60 μm from the IRAS Faint Source Catalog (FSC). This revision merges in data from the Wide-
                                        field Infrared Survey Explorer All-Sky Data Release, the tenth Sloan Digital Sky Survey Data
                                        Release (DR10), the GALEX All-Sky Survey Source Catalog (GASC), the 2MASS Redshift
                                        Survey (2MRS) and the Planck Catalogue of Compact Sources (PCCS). The RIFSCz consists
                                        of position, ultraviolet (UV), optical, near-, mid- and far-infrared, sub-millimetre (sub-mm)
                                        and radio identifications, spectroscopic or photometric redshift, predicted fluxes from 12 to
                                        1380 μm based on the best-fitting infrared template. We provide stellar masses, star formation
                                        rates and dust masses derived from the optical and infrared template fits, where possible.
                                        56 per cent of the RIFSCz galaxies have spectroscopic redshifts and a further 26 per cent have
                                        photometric redshifts from the template-fitting method. At S60 > 0.36 Jy, the 90 per cent
                                        completeness limit, 93 per cent of the RIFSCz sources have spectroscopic or photometric
                                        redshifts. An interesting subset is the sources detected by Planck at sub-mm wavelengths.
                                        1200 sources have detections at >5σ and a further 1186 sources have detections at 3–5σ in at
                                        least one Planck band.
                                        Key words: catalogues – surveys – galaxies: distances and redshifts – quasars: general –
                                        large-scale structure of Universe – infrared: galaxies.

                                                                               (GASC; Seibert et al., in preparation), the 2MASS Redshift Survey
1 I N T RO D U C T I O N
                                                                               (2MRS; Huchra et al. 2012), the tenth SDSS Data Release (DR10;
The IRAS Faint Source Catalog (FSC; Moshir, Kopman & Conrow                    Ahn et al. 2013) and the Planck all-sky survey (Planck Collaboration
1992) contains 173 044 sources down to ∼0.2 Jy at 12, 25 and                   I 2013), has made it imperative to revise the IIFSCz. In particular,
60 μm. It is limited to |b| > 20◦ in unconfused regions at 60 μm. For          the imaging depth and coverage of WISE are such that the WISE
sources with high-quality flux density,1 reliability is >99 per cent at        catalogue provides counterparts for the majority of IIFSCz sources
12 and 25 μm and >94 per cent at 60 μm. Around 41 per cent of the              and improves the positional accuracy by a factor of ∼10. Using
FSC sources are detected at 60 μm (FQUAL > 1). The construction                WISE positions, cross-match between IRAS sources and sources
of the Imperial IRAS-FSC Redshift Catalogue (IIFSCz; Wang &                    detected at other wavelengths becomes much easier and much more
Rowan-Robinson 2009) was made possible by overlaps (in terms of                reliable.
depth and area) with various surveys, such as the Sloan Digital Sky               The layout of this paper is as follows. In Section 2, first we
Survey (SDSS; York et al. 2000), the Two Micron All Sky Survey                 cross-identify FSC sources with their WISE counterparts using a
(2MASS; Skrutskie et al. 2006) and the 6dF Galaxy Survey (Jones                likelihood ratio (LR) technique. Then, using WISE positions, we
et al. 2004, 2005). However, the large positional error of IRAS                cross-match FSC sources with sources detected in the ultraviolet
sources made cross-match with surveys such as SDSS challenging.                (UV), optical, near-infrared and sub-millimetre (sub-mm). Spectro-
The recent completion and/or release of several major surveys,                 scopic redshifts (spec-z) are collected from various sources, e.g.
e.g. the Wide-field Infrared Survey Explorer (WISE; Wright et al.              SDSS DR10, 2MRS and the NASA/IPAC Extragalactic Database
2010) All-Sky Survey, the GALEX All-Sky Survey Source Catalog                  (NED). In Section 3, we estimate photometric redshift (phot-z)
                                                                               using a template-fitting method for sources matched with WISE,
                                                                               SDSS and/or 2MASS. In Section 4, infrared templates are fitted to
 E-mail: lingyu.wang25@gmail.com                                              mid- and far-infrared data from IRAS and WISE as well as sub-mm
1 In the IRAS FSC, the flux density quality (FQUAL) is classified as high      data from Planck (where available). We also make flux predictions
(=3), moderate (=2) or upper limit (=1)                                        in the far-infrared and sub-mm based on the best-fitting template.


C 2014 The Authors

Published by Oxford University Press on behalf of the Royal Astronomical Society
2740        L. Wang et al.
Discussions and conclusions of the overall properties of the revised
IRAS-FSC Redshift catalogue (RIFSCz) are given in Section 5. We
adopt a flat cosmology with  = 0.7 and h0 = 0.72 and a Salpeter
initial mass function (Salpeter 1955). We use the AB magnitude
system, and log = log10 .

2 S O U R C E I D E N T I F I C AT I O N
Our starting point is the complete sample of galaxies selected at
60 μm from the IRAS FSC (Wang & Rowan-Robinson 2009). We
summarize our selection criteria here: (1) to ensure reliability, we
select sources with FQUAL ≥ 3 and SNR >5 at 60 μm; (2) to
exclude cirrus, we require log (S100/S60) < 0.8 if FQUAL ≥ 2
at 100 μm; (3) to exclude stars, we require log (S60/S25) > −0.3
if FQUAL ≥ 2 at 25 μm and log (S60/S12) > 0 if FQUAL ≥ 2

                                                                                                                                                              Downloaded from http://mnras.oxfordjournals.org/ at Imperial College London Library on November 14, 2014
at 12 μm.

2.1 Cross-match with WISE
The WISE (Wright et al. 2010) mapped the sky at 3.4, 4.6, 12 and
22 μm (W1, W2, W3, W4) with a resolution of 6.1 arcsec, 6.4 arc-
sec, 6.5 arcsec and 12.0 arcsec, respectively. The All-Sky Release
includes all data during the full cryogenic mission and the Source
Catalog contains over 563 million objects. To ensure high reliability,
sources are required to meet SNR > 5 in at least one band and other
criteria. Point source profile-fitting and multi-aperture photometry
are provided. The 5σ sensitivity is 0.068, 0.098, 0.86 and 5.4 mJy at
3.4, 4.6, 12 and 22 μm in unconfused regions on the ecliptic plane
(Wright et al. 2010). Sensitivity is better in regions at higher ecliptic
latitudes with deeper coverage and lower zodiacal background, and
worse in regions with high source density or complex background.
WISE provides Vega magnitudes and corrections to AB magnitudes
are 2.683, 3.319, 5.242 and 6.604 mag at 3.4, 4.6, 12 and 22 μm
(Wright et al. 2010; Jarrett et al. 2011).

                                                                            Figure 1. Top: the mean radial offset distribution between FSC and WISE
                                                                            per FSC source (black histogram). The N(r) of the random associations
2.1.1 The likelihood ratio technique                                        increases linearly with r (dotted line), while the true counterparts follow the
                                                                            Rayleigh distribution (solid line). The dashed line is the sum of the solid
We use the LR technique (Sutherland & Saunders 1992; Brusa
                                                                            and the dotted line. The vertical line marks σ r = 5.78 arcsec where N(r) of
et al. 2007; Chapin et al. 2011; Wang et al. 2013) to match FSC
                                                                            the true matches peaks. Bottom: the mean 60-to-3.4 µm colour distribution
sources with counterparts at 3.4 μm (the most sensitive WISE band).         of all WISE sources within 40 arcsec per FSC source (blue histogram)
It compares the probability of a true counterpart with a chance             compared to that around a random location (red histogram). The colour
association, as a function of flux ratio S60 /S3.4 and radial offset r.     distribution of the true counterparts and random associations can be fit by
Assuming the probability is separable in log10 (S60 /S3.4 ) (or C60 − 3.4   a Gaussian (dot–dashed line) and an exponential function (dashed line),
as a shorthand) and r, we can write                                         respectively. The solid line is the sum of the dashed and the dot–dashed
                                                                            line. To avoid incompleteness at faint 3.4 µm fluxes, the fitting is limited to
        Probtrue (C60−3.4 , r)    q(C60−3.4 )f (r) dCdr
LR =                            =                       ,            (1)    log10 (S60 /S3.4 ) < 3.4.
       Probrandom (C60−3.4 , r)   p(C60−3.4 )b(r) dCdr
where q(C60−3.4 ) and p(C60−3.4 ) are the colour distributions of the       assuming a constant surface density of 3.4 μm sources uncorrelated
true and random matches, respectively, and f(r) and b(r) are the            with FSC sources. In the top panel in Fig. 1, we plot the mean radial
positional distributions of the true and random associations, respec-       offset distribution between FSC and WISE per FSC source, which
tively. For f(r), we assume a symmetric Gaussian distribution as a          contains true and random associations. We fit our model
function of orthogonal positional coordinates. So, f(r) is a Rayleigh
distribution,                                                               N (r) dr = E × f (r) dr + ρ × b(r) dr                                      (4)
             r                                                            to the observed histogram to determine E = 0.30 ± 0.01, σr =
f (r)dr = 2 exp −r 2 /2σr2 dr,                                    (2)
            σr                                                              5.78 arcsec ± 0.20 arcsec, and ρ = 0.93 ± 0.03 arcsec−2 . The best-
where the scale parameter of the Rayleigh distribution σ r is where         fitting radial distribution of the true and random associations are
f(r) peaks. The positional distribution of random associations can          plotted as the solid line and the dotted line in the top panel in Fig. 1.
be written as                                                               In the bottom panel in Fig. 1, we plot the average 60-to-3.4 μm
                                                                            colour distribution of all FSC–WISE matches per FSC source and
b(r)dr = 2πr dr,                                                     (3)    per randomized FSC source. The former contains both real and

MNRAS 442, 2739–2750 (2014)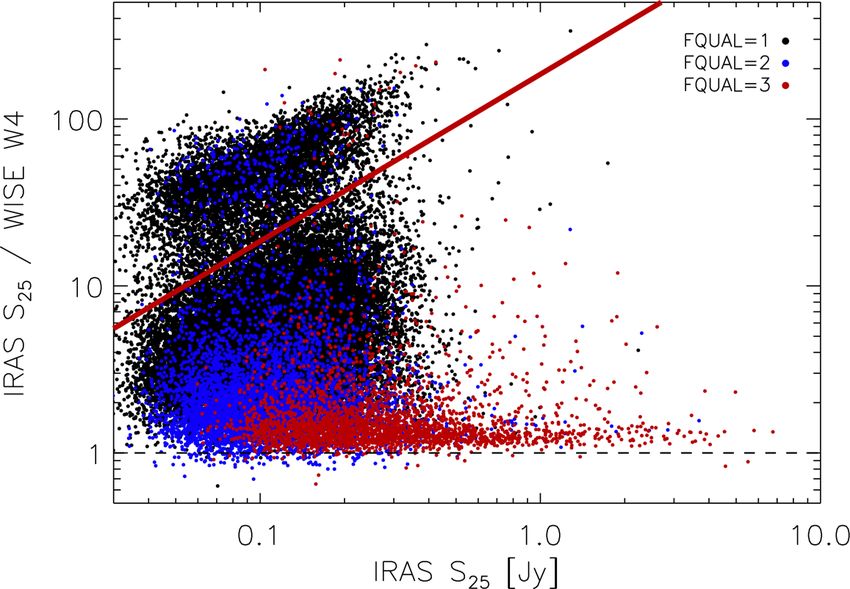
The Revised IRAS-FSC Redshift Catalogue                             2741
                                                                                 2.2 Cross-match with GALEX
                                                                                 Galaxy Evolution Explorer (GALEX) has undertaken a number of
                                                                                 surveys covering large areas at a variety of depths. The largest two
                                                                                 are the All-Sky (AIS) and Medium Imaging Surveys (MIS). The
                                                                                 AIS is much shallower than the MIS but it covers a much larger
                                                                                 area. The standard GALEX data base contains all detected sources
                                                                                 including many duplicate as well as spurious sources. To addres\
                                                                                 these problems, two catalogues, namely the GASC and the GALEX
                                                                                 Medium Imaging Survey Catalog (GMSC), have been constructed
                                                                                 (Seibert et al. in preparation). Sources are selected if detected in the
                                                                                 near-ultraviolet (NUV) with SNR >3. Covering 26 300 deg2 , the
                                                                                 GASC consists of all GALEX observations to a depth of NUV 21
                                                                                 and 40 million unique sources. Following Budavári et al. (2009) and
                                                                                 Heinis, Budavári & Szalay (2009), we match GALEX sources and

                                                                                                                                                               Downloaded from http://mnras.oxfordjournals.org/ at Imperial College London Library on November 14, 2014
                                                                                 FSC sources with WISE positions, using a radius of 5 arcsec. 31 552
Figure 2. The normalized LR distribution for all matches between FSC
                                                                                 matches are found which correspond to 31 537 unique FSC sources.
and WISE (solid line), all matches between the randomized FSC and WISE
                                                                                 Only 10 FSC sources have multiple GALEX matches and we simply
(dashed line) and the final cross-matched FSC–WISE catalogue (dot–dashed
line). Only the relative ordering of the LR matters.                             select the closest GALEX source as the correct association.

random associations. The latter contains only 3.4 μm sources un-                 2.3 Cross-match with SDSS DR10
correlated with FSC sources. We generate the randomized FSC
by locally randomizing positions and randomly swapping 60 μm                     The original IIFSCz matched FSC with SDSS DR6. The match-
fluxes. The colour distribution per randomized FSC source can be                 ing was complicated as the probability of chance association is
characterized by an exponential increase towards larger values of                ∝ nπd 2 , where n is the surface density of background optical ob-
log10 (S60 /S3.4 ) (fainter 3.4 μm flux densities) followed by an expo-          jects and d is the matching radius. The positional accuracy of the
nential decrease due to incompleteness. The colour distribution can              FSC sources matched with WISE improved drastically. Following
be characterized by a Gaussian distribution for the true counterparts            Yan et al. (2013), we matched IRAS sources with WISE positions
and a double exponential form for the random associations. To avoid              and SDSS DR10 using a radius of 3 arcsec. The SDSS photomet-
incompleteness, we fit a Gaussian and an exponential function to                 ric DR10 survey covered a total unique area of 14 555 deg2 (Ahn
the colour distribution at log10 (S60 /S3.4 ) < 3.4.                             et al. 2013). 25 553 SDSS sources are found within 3 arcsec of the
   We now calculate the LR for FSC–WISE matched sources. The                     IRAS–WISE sources. Only primary objects4 are selected. 20 277
LR value is unimportant, only the relative ordering matters. In Fig. 2,          FSC sources have unique SDSS ids, 2531 FSC sources have mul-
we plot the LR distribution of all matches between FSC and WISE                  tiple SDSS matches. We simply assign the closest SDSS object as
(the solid histogram) and all matches between the randomized FSC                 the correct ID for FSC sources. For some large, nearby galaxies this
and WISE (the dashed histogram). At log LR < −9, the solid his-                  can lead to incorrect associations. We have corrected this where
togram becomes identical to the dashed histogram, indicating that                possible.
most real matches have log LR < −9. We select FSC–WISE matches
with log LR ≥ −5 which corresponds to ∼4 per cent false identifi-
cation rate.2 When more than one WISE source are matched to one                  2.4 Cross-match with 2MASS
FSC source,3 the one with the highest LR is selected. In total, 48 603           The 2MASS survey has imaged the whole sky in J (1.24 μm), H
IRAS sources are matched with a 3.4 μm counterpart. In Fig. 3, we                (1.66 μm) and Ks (2.16 μm) (Skrutskie et al. 2006). The 2MASS
plot the 2D distribution in S60 /S3.4 and r of all matches between FSC           All-Sky Release Point Source Catalog (PSC) contains over 470 mil-
and WISE (left), all matches between randomized FSC and WISE                     lion sources. The 2MASS All-Sky Data Release Extended Source
(middle), and the final LR matched FSC–WISE catalogue (right).                   Catalog (XSC; Jarrett et al. 2000) contains over 1.6 million objects
   In Fig. 4, we compare the IRAS 25 μm to WISE 22 μm flux ratio                 which are resolved relative to the point spread function.
and the IRAS 25 μm flux for sources with SNR > 2 in the WISE                        Association information cross-referencing WISE sources with the
22 μm band. A generally good agreement can be seen for sources                   2MASS PSC is provided in the All-Sky Source Catalog. In total,
with high-quality IRAS fluxes. WISE fluxes are systematically below              there are 45 892 sources in the 2MASS PSC matched to 48 603 FSC
IRAS fluxes even after taking into account the band difference. This             sources which have received WISE positions. We also matched the
trend can be removed after making aperture correction at the WISE                48 603 FSC sources with the 2MASS XSC. In total, 35 772 out of
bands (see Section 3.1). A similar comparison between the IRAS                   the 48 603 FSC sources found a 2MASS XSC counterpart.
12 μm and the WISE 12 μm fluxes can be made. However, the
number of IRAS sources with high-quality fluxes at 12 μm is too
small.                                                                           2.5 Cross-match with Planck
                                                                                 The first public release (PR1) of the Planck Catalogue of Compact
2 The false identification rate is the ratio of the number of matches between    Sources (PCCS; Planck Collaboration XXVIII 2013) includes nine
the randomized FSC and WISE above the chosen LR threshold to the total           single-frequency all-sky catalogues of compact sources, from 30 to
number of matches.
3 For all FSC sources matched with WISE counterparts with log LR ≥ −5,

25 per cent of them have more than one WISE match. However, this percent-        4 Whenever the SDSS makes multiple observations of the same object, the

age depends on the chosen LR threshold.                                          one with the best photometry will be assigned as the ‘primary’ observation.

                                                                                                                      MNRAS 442, 2739–2750 (2014)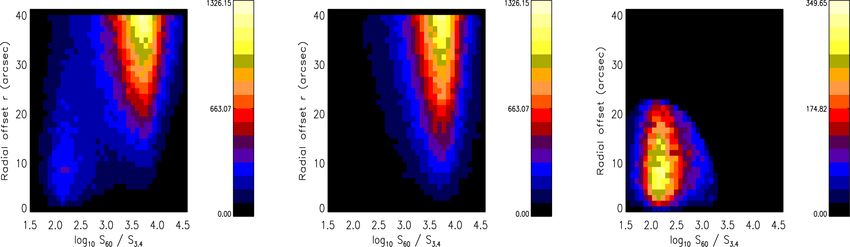
2742         L. Wang et al.

                                                                                                                                                                     Downloaded from http://mnras.oxfordjournals.org/ at Imperial College London Library on November 14, 2014
Figure 3. Left: the 2D distribution in S60 /S3.4 and radial offset r of all matches between FSC and WISE, which contains both real matches and random
associations. The colour coding is based on the number of matches in a given cell in the positional offset versus colour plane. Middle: the 2D distribution of all
matches between randomized FSC and WISE, which contains only random associations. Right: the 2D distribution of the final matched FSC–WISE catalogue
of 48 603 sources, using the LR technique.

                                                                                    Figure 5. 100 µm flux versus 857 GHz (350 µm) flux for IRAS-Planck
Figure 4. IRAS 25 µm flux density versus WISE 22 µm flux density for                matched sources. A generally good correlation can be seen.
FSC–WISE matched sources. A generally good agreement between WISE
and IRAS can be seen for sources with high-quality IRAS flux density mea-           2.6 Spectroscopic redshift compilation
surements (FQUAL=3). WISE fluxes are systematically below IRAS fluxes
even after taking into account the band difference. This trend can be removed       The SDSS spectroscopic DR10 survey covered a total unique area
after making aperture correction at the WISE bands (see Section 3.1). Above         of 9274 deg2 (Ahn et al. 2013). We get 11 749 redshift by matching
the red line, sources are below the WISE 5σ sensitivity at 22 µm.                   IRAS sources with WISE positions and SDSS. The 2MASS Redshift
                                                                                    Survey (2MRS; Huchra et al. 2012) aims to determine redshifts for
                                                                                    all galaxies in the 2MASS XSC to K = 12.2. The second phase
                                                                                    of 2MRS is now complete, providing an all-sky survey of 45 000
                                                                                    galaxies to K = 11.75. We retrieve 9264 redshifts by matching IRAS
857 GHz. We match the PR1 857 GHz catalogue with the RIFSCz                         sources with WISE positions and 2MASS. An NED all-sky query
using a radius of 3 arcmin. The full width at half-maximum of the                   of FSC sources at |b| > 20◦ with spec-z and S60 > 0.1 Jy returned
Planck beam at 857 GHz is 4.33 arcmin. The 857 GHz catalogue                        28 222 objects. 9523 new redshifts (not in SDSS DR10 or 2MRS)
also includes aperture photometry at 217 (1382 μm), 353 (850 μm)                    are obtained. We also get 4557 spec-z from the PSC Redshift Survey
and 545 GHz (550 μm). In total, there are 4136 matched sources.                     (PSCz; Saunders et al. 2000), the 6dF Galaxy Survey and the FSS
Only ∼30 Planck sources have more than one FSC sources within                       redshift survey (FSSz; Oliver, PhD thesis). To summarize, we have
3 arcmin. The histogram of positional differences between IRAS                      33 956 spec-z from SDSS DR10, 2MRS, NED, FSSz, PSCz and
and Planck peaks at 40 arcsec. The comparison between Planck                        6dF, which comprises 56 per cent of the RIFSCz. Table 1 shows a
857 GHz and IRAS 100 μm flux densities exhibits a good general                      breakdown of the multiwavelength photometric data and Table 2
correlation as shown in Fig. 5.                                                     shows a summary of spectroscopic data for the RIFSCz.
   There are 1200 RIFSCz sources with a Planck detection bet-
ter than 5σ in at least one of the 350, 550, 850 or 1382 μm
                                                                                    3 P H OT O M E T R I C R E D S H I F T
bands (and 2364 sources with a Planck detection better than 3σ ).
These are the most reliable Planck point sources at |b| > 20◦ , since               Our starting point is the RIFSCz sample of 60 303 sources
sources unassociated with an IRAS extragalactic source are likely to                associated with GALEX, SDSS, 2MASS, WISE, Planck and
be cirrus.                                                                          NVSS. 33 956 sources have spec-z. We estimate phot-z for the

MNRAS 442, 2739–2750 (2014)
The Revised IRAS-FSC Redshift Catalogue 2743
Table 1. Summary of the multiwavelength photometric data for
the RIFSCz (containing 60 303 galaxies). The statistics shown for
the GALEX and Planck data require SNR >3. The statistics for
the IRAS data require flux density quality ≥ 2.
Source Number
GALEX NUV, FUV 31 537/25 074
SDSS u, g, r, i, z 21 503
2MASS PSC J, H, K 45 892
WISE W1, W2, W3, W4 48 603/48 603/48 591/48 588
IRAS 12, 25, 100 µm 4 476/9 606/30 942
Planck 217, 353, 545, 857 GHz 150/616/1152/2275
NVSS 1.4 GHz 23 703
Table 2. Summary of the spectroscopic red-
Downloaded from http://mnras.oxfordjournals.org/ at Imperial College London Library on November 14, 2014
shift data for the RIFSCz. The number shown
for a given spectroscopic survey or data base
does not exclude objects which are found
elsewhere.
Source of zspec Number Fraction
Figure 6. The 3.4 µm flux density (in mJy) S3.4 versus the 3.4-to-
SDSS DR10 11 749 19 per cent
4.6 µm flux density ratio log10 S3.4/S4.6, exhibiting increased scatter at
2MRS 9 264 15 per cent
S3.4 < 1 mJy (below the dashed line). Red dots are galaxies and blue dots
NED 26 953 45 per cent
are quasars in the RIFSCz.
IRAS FSSz 568 0.9 per cent
IRAS PSCz 1 972 3.3 per cent The left-hand panel in Fig. 8 shows the IRAS 12 μm flux versus
6dF Galaxy Survey 2 794 4.6 per cent
the aperture-corrected WISE 12 μm flux. The right-hand panel in
Total 33 956 56 per cent Fig. 8 shows the IRAS 25 μm flux versus the aperture-corrected
WISE 22 μm flux. The agreement is good in both cases, except for a
remainder using the 0.361–4.6 μm data. We use SDSS model tail of sources where the WISE fluxes appear to be underestimated.
magnitudes and 2MASS extended fluxes, where available. We ap- The alternative interpretation, that the IRAS fluxes are overestimated
ply a template-fitting method, six galaxy templates (E, Sab, Sbc, does not fit well with SEDs.
Scd, Sdm and starburst) and three Quasi-Stellar Object (QSO) Derivation of fluxes for extended WISE sources from WISE data
templates, which have been used to construct the Spitzer Wide- is a project currently in progress (M. Cluver, private communi-
area InfraRed Extragalactic survey Photometric Redshift Catalogue cation). When the WISE extended source fluxes are available, we
(Rowan-Robinson et al. 2008 and references therein). Initially, we will no longer need to make empirical aperture corrections. Pho-
use only a single pass through the data and a resolution of 0.002 in tometric redshifts for RIFSCz sources matched with WISE will be
log10 (1 + z). re-estimated.
Fig. 6 shows the WISE 3.4/4.6 μm colour versus 3.4 μm flux S3.4.
There is increased scatter at the faintest 3.4 μm fluxes. Thus, we only 3.2 Stellarity
use 3.4 and 4.6 μm fluxes in the phot-z estimation if S3.4 > 1 mJy
and S4.6 > 1 mJy. We also require S12 > 1 mJy, S24 > 5 mJy To distinguish reliably between galaxies and QSOs without gener-
(corresponding roughly to the 5σ WISE limits). ating excessive aliasing, a measure of stellarity is needed. SDSS
sources with type=‘STAR’ and NED sources with type=‘QSO’
are given a stellar flag. In addition, we assume that sources with
3.1 Aperture corrections Jext − J > −0.3 are stellar.
The left-hand panel in Fig. 7 shows the J-band aperture correction
delmag = (Jext − J) versus(z − Jext ), illustrating that the SDSS 3.3 Identification of AGN dust tori
model magnitudes and 2MASS extended magnitudes have well-
matched aperture corrections. The right-hand panel in Fig. 7 shows A feature of the codes developed for estimating phot-z for Spitzer
(Jext − J) versus (Kext − m(3.4)), showing a strong dependence galaxies (Rowan-Robinson et al. 2005, 2008) is the use of 3.6 and
of colour on J-band aperture correction. We found that the WISE 4.5 μm data. This is effective in reducing catastrophic outliers.
3.4 μm magnitudes need an aperture correction = 0.6 × delmag. However, it becomes important to identify galaxies with signifi-
We have applied this same aperture correction to the WISE 4.6 μm cant active galactic nucleus (AGN) dust tori, since the torus can
data. dominate over starlight (or AGN continuum) down to 1 μm. We
We have also explored whether the WISE 12 and 22 μm fluxes choose a key diagnostic introduced by Rowan-Robinson & Craw-
need aperture correction, and found optimum results with ford (1989), the 12-25-60 μm colour–colour diagram. Fig. 9 shows
a plot of log10 S60/S22 versus log10 S22/S12, with WISE 12 and
log10 S12corr = log10 S12 − 0.16 × delmag (5) 22 μm fluxes and IRAS 60 μm flux. Sources left of the line in Fig. 9
are assumed to have significant dust tori and these (together with
and
sources identified as QSOs) go through a second phot-z pass in
log10 S22corr = log10 S22 − 0.10 × delmag. (6) which each template has added to it 10 different amplitudes of an
MNRAS 442, 2739–2750 (2014)2744 L. Wang et al.
Downloaded from http://mnras.oxfordjournals.org/ at Imperial College London Library on November 14, 2014
Figure 7. Left: (Jext − J) versus (z − Jext ), illustrating that the SDSS model magnitudes and 2MASS extended magnitudes have well-matched aperture
corrections. Right: (Jext − J) versus(Kext − m(3.4)), illustrating that the WISE 3.4 µm magnitudes need an aperture correction =0.6 × the 2MASS J-band
aperture correction.
Figure 8. Left: IRAS 12 µm fluxes versus aperture corrected WISE 12 µm fluxes. The k value is the coefficient in the WISE 12 µm aperture correction in
equation (5). Right: IRAS 25 µm fluxes versus aperture corrected WISE 22 µm fluxes. The k value is the coefficient in the WISE 22 µm aperture correction in
equation (6). There is a good agreement in both panels except for a few sources where the WISE fluxes seem to be underestimated. The alternative explanation
that the IRAS fluxes of these sources are overestimated does not fit the SED modelling.
AGN dust torus (Rowan-Robinson et al. 2013). WISE data are used three photometric bands and reduced χ 2 < 3. The approximately
only in the second pass, for sources suspected to contain AGN dust power-law form of the optical continua of QSOs leads to some
tori. For galaxies without dust tori, WISE data did not improve the redshift aliasing. To summarize, we have 33 956 spec-z, 15 406
phot-z solution, perhaps due to inadequate aperture correction of phot-z, 37 sources with photometry but no successful redshift due
extended sources. to inconsistencies among the photometric data, and 10 941 sources
with no spec-z or phot-z.
Fig. 11 shows SEDs of galaxies (and one QSO) which are outliers
3.4 Performance
in Fig. 10. GALEX data are used in the plots, where available, but not
The red dots in Fig. 10 shows spec-z versus phot-z for galaxies with in the phot-z solution. The spec-z, indicated near each object, look
at least eight photometric bands and reduced χ 2 < 3. The fraction plausible in all cases. The phot-z appears to be pulled away from
of catastrophic outliers, i.e. (1 + zphot ) differs from (1 + zspec ) by the correct value by small mismatches in the SDSS and 2MASS
more than 15 per cent, is 0.17, 3.4 and 3.5 per cent for sources aperture corrections, and by aliasing caused by dust extinction.
with 8, 5 and 3 photometric bands, respectively. The rms accuracy, Where the aperture-corrected SDSS and 2MASS fluxes are highly
excluding outliers, is 3.5, 4.0 and 3.8 per cent for sources with 8, 5 discrepant we have used only 2MASS in the phot-z solution.
and 3 photometric bands, respectively. These represent a good phot- In Wang & Rowan-Robinson (2009), we also explored photo-
z performance (cf. Rowan-Robinson et al. 2008, 2013). The blue metric redshifts derived via a neural network approach. Bilicki
dots in Fig. 10 shows spec-z versus phot-z for QSOs with at least et al. (2014) have carried out a similar neural network analysis
MNRAS 442, 2739–2750 (2014)The Revised IRAS-FSC Redshift Catalogue 2745
Downloaded from http://mnras.oxfordjournals.org/ at Imperial College London Library on November 14, 2014
Figure 11. SEDs of outliers in Fig. 10, offset vertically for clarity. Dotted
curves correspond to the M82 template, short-dashed curves correspond
to the Arp 220 template, and the long-dashed curves correspond to the
Figure 9. 22-to-12 µm flux ratio versus 60-to-22 µm flux ratio with QSOs AGN dust torus template. Starlight and total emission are both shown as
shown in red. Objects left of the line are assumed to have significant dust continuous curves. The spec-z, indicated near each object, seem plausible
tori and thus go through a second phot-z pass. in all cases. The phot-z could be pulled away from the correct value by
small mismatches in the SDSS and 2MASS aperture corrections, and/or by
aliasing caused by dust extinction.
the optical–near-infrared SED. We have only used our photometric
redshifts in the following discussion.
4 I N F R A R E D T E M P L AT E F I T S
Mid- and far-infrared data from IRAS and WISE and sub-mm
data from Planck were fitted initially, following the methodol-
ogy of Rowan-Robinson et al. (2005, 2008), with a combination
of four templates (cirrus, M82, Arp220 starbursts and AGN dust
torus). While it works well for many sources, the 350–850 μm
fluxes often require colder dust than is incorporated in our ba-
sic templates. The two new templates used here are taken from
the range of optically thin interstellar medium (‘cirrus’) templates
developed by Rowan-Robinson (1992) and Efstathiou & Rowan-
Robinson (2003). The key parameter determining the temperature
of the dust grains is the intensity of the radiation field, charac-
terized by the ratio of intensity of radiation field to the local in-
terstellar radiation field, ψ. The standard cirrus template ψ = 5
Figure 10. Spec-z versus phot-z for galaxies (red) and QSOs (blue), with at is used by Rowan-Robinson (1992) to fit the central regions of
least eight photometric bands for galaxies and three bands for QSOs, and re- our Galaxy. ψ = 1 corresponds to the interstellar radiation field
duced χ 2 < 3. The thick diagonal line corresponds to zphot = zspec . Galaxies around the Sun. Some galaxies also need a much lower intensity
outside the two thin diagonal lines are outliers with |z/(1 + zspec )| > 0.15.
radiation field with ψ = 0.1. The grain temperatures for the two
QSOs with |z/(1 + zspec )| > 0.26 are outliers.
new templates are in the ranges 14.5–19.7 K and 9.8–13.4 K, re-
spectively (Rowan-Robinson 1992). Details of the templates are at
for 2MASS galaxies and supply photometric redshifts for 31 268 http://astro.ic.ac.uk/mrr/swirephotzcat/templates/readme. Follow-
of our galaxies. As found by Wang & Rowan-Robinson (2009), the ing the analysis of Rowan-Robinson & Efstathiou (2009) of the
neural network approach gives a better performance at low redshift Spoon et al. (2007) diagnostic diagram, we also introduced a young
(z < 0.1), but tends to underestimate higher redshifts (z > 0.2) be- starburst (ysb) template, more extreme than Arp220.
cause the method is not capable of making predictions outside the Our code uses two cirrus templates (ψ = 5, 1), three starburst
range of the training set. We have included the Bilicki et al. (2014) templates (M82, Arp220, ysb) and an AGN dust torus template.
redshifts in our catalogue and incorporated 513 spectroscopic red- These templates provide a good fit to the mid- and far-infrared, and
shifts not located in our analysis of Section 2.6 above. We have sub-mm data for most sources. Fig. 12 shows the 25 (or 22)-60-
also examined 80 galaxies where the Bilicki et al. (2014) spectro- 100 μm colour–colour diagram, colour-coded by the template mak-
scopic redshift differs from ours by more than 0.2 and in the case ing the dominant contribution to the infrared luminosity. Sources
of 60, preferred their spectroscopic redshift as more consistent with whose SEDs are dominated by standard cirrus (ψ = 5) or cool
MNRAS 442, 2739–2750 (2014)2746 L. Wang et al.
Downloaded from http://mnras.oxfordjournals.org/ at Imperial College London Library on November 14, 2014
Figure 14. S350/S550 versus S60/S350 for IRAS–Planck sources, colour-
Figure 12. 25 (or 22)-60-100 µm colour–colour diagram, colour-coded by coded by infrared template type. Galaxies from the IRAS Large Optical
the template making the dominant contribution to the infrared luminosity. Galaxy Catalog (Rice et al. 1988) are shown as open hexagons. The loca-
Location of individual templates are shown. Standard cirrus (ψ = 5) or cool tions of our templates, and mixture lines between M82 and the three cirrus
cirrus (ψ = 1) dominated sources have colder 60–100 µm colours, while templates are shown.
starburst or AGN-dominated sources have warmer 60–100 µm colours.
detections, z > 0.01, 8 optical and near-infrared bands and χ 2 > 10.
cirrus (ψ = 1) have colder 60–100 μm colours, while starburst or A further two (not shown) are QSOs (3C273, OJ287), which are not
AGN-dominated sources have warmer 60–100 μm colours. expected to be fitted by our templates. For 19 of these sources, the
The reduced χ 2 of the infrared and sub-mm fit is good for most fit is improved by adding cold cirrus. One source (F01464+1954)
sources, and especially for warmer sources. We have modelled the is a candidate-lensed galaxy.
SEDs of all sources with sub-mm data and χ 2 > 10. For many
cases, the poor χ 2 is simply due to incorrect aperture corrections,
4.1 The IRAS-Planck sources
especially for the WISE fluxes. For very large galaxies in the IRAS
Large Optical Galaxy Catalog (Rice et al. 1988) with delmag < −3, There are 1200 RIFSCz sources matched to a Planck detection bet-
we do not use the WISE fluxes in the phot-z or infrared template fit ter than 5σ in at least one of the 350, 550, 850 and 1382 μm bands
solutions. In most cases, there is a need for the cold cirrus (ψ = 0.1), (and 2386 sources with a Planck detection >3σ ). They are of great
as found by Rowan-Robinson et al. (2010) and Planck Collaboration interest because for these sources we have the strongest constraints
XVI (2011). Fig. 13 shows SEDs for 21 sources with good 350 μm on their far-infrared and sub-mm spectrum. Fig. 14 shows the
Figure 13. SEDs for sources with good Planck 350 µm detections and poor χ 2 for the infrared and sub-mm template fit. Blue line denotes the cool cirrus
(ψ = 1) template, green line denotes the cold cirrus (ψ = 0.1) template and red line denotes a candidate gravitational lens. For most sources, the fit can be
improved by adding a cold cirrus template.
MNRAS 442, 2739–2750 (2014)The Revised IRAS-FSC Redshift Catalogue 2747
Downloaded from http://mnras.oxfordjournals.org/ at Imperial College London Library on November 14, 2014
Figure 15. Infrared luminosity versus redshift, colour-coded by the dom-
inant infrared template. Sources above the dashed line are hyper luminous
infrared galaxies (LIR > 1013 L ), mostly M82 or A220 type starbursts.
60–350–550 μm colour–colour diagram for 5σ Planck sources.
The location of the different templates (at z = 0) are indicated,
together with mixture lines between M82 and cirrus templates. This
further illustrates the need for cold cirrus.
4.2 Infrared luminosity, star formation rate, stellar mass and
dust mass
Fig. 15 shows infrared luminosity versus redshift colour-coded by
infrared template type. Where sources selected cirrus templates with
log10 Lfir > 12.5, or have Lcirrus > Lopt , they go through a second pass
as such unphysical cirrus luminosities not permitted. Many sources
found acceptable fits with other templates. Those that had poor
reduced χ 2 may be a consequence of mis-association of the IRAS
source with other catalogues, or of incorrect redshifts, or may be
gravitationally lensed objects. 178 galaxies are found to be hyper Figure 16. Top: SFR versus stellar mass, colour-coded by the dominant
infrared template. The colour coding is the same as in Fig. 16. Black lines
luminous (Lfir > 1013 L ) (cf. Rowan-Robinson 2000), of which
show e-folding times for stellar mass of 1, 10 and 100 Gyr. Most galaxies
61 have spec-z. This is very similar to the 179 found by Rowan-
lie below the 10 Gyr line, indicating that they must have formed stars at a
Robinson & Wang (2010) in the earlier version of the IIFSCz. higher rate in the past. The red broken line is the ‘main-sequence’ locus of
It would be worthwhile to obtain redshifts for the remaining 118 Elbaz et al. (2011). Bottom: dust mass versus stellar mass. The straight lines
candidate hyper-luminous objects. correspond, from the right, to Mdust /M = 10−6 , 10−4 and 10−2 .
We follow Rowan-Robinson et al. (2008) to calculate stellar
masses, star formation rates (SFR) and dust masses. We estimate the line loci correspond to the time-scales to make this mass of stars,
rest-frame 3.6 μm luminosity νLν (3.6) which is converted to stellar forming stars at this rate. While many galaxies are forming stars at
mass M using the ratio (M /M )/(νLν (3.6)/L ) derived from a rate broadly consistent with that required to generate the observed
stellar synthesis models. To estimate SFR, we use the conversion stellar mass over ∼10 Gyr, most local galaxies lie to the right of the
recipes of Rowan-Robinson et al. (1997, 2001), 10 Gyr line and must have formed stars at a higher rate at some time
−1
SFR = 2.2 10−10 (L60 /L ), (7) in the past. The zone occupied by our complete and all-sky sample
of local quiescent galaxies, lies to the right of the ‘main-sequence’
where is the fraction of UV light absorbed by dust, taken as 2/3. locus of Elbaz et al. (2011) and of the 10 Gyr line, consistent
To estimate the approximate dust mass, we use radiative transfer with the fact that these galaxies are forming stars at a much lower
models and the recipe rate than they did in the past (at z = 1−3). Galaxies in Fig. 16 have
been colour-coded by their dominant infrared template as in Fig. 15.
Mdust /M = kLIR /L , (8)
The quiescent, optically thin galaxies, i.e. those whose SEDs are
−2 −3 −3 −4
where k = 6.5 × 10 , 6.5 × 10 , 1.1 × 10 , 1.1 × 10 and dominated by cirrus, lie on the right-hand edge of the distribution,
4.4 × 10⁻⁴ for cirrus (ψ = 0.1, 1, 5), M82 and A220, respectively while galaxies whose infrared SEDs are dominated by starbursts
(A. Efstathiou, 2007, private communication). The left-hand panel lie to the left, with higher specific SFR. The right-hand panel in
in Fig. 16 shows SFR (M y−1 ) versus stellar mass (M ). Straight Fig. 16 shows dust mass versus stellar mass, with most galaxies
MNRAS 442, 2739–2750 (2014)2748 L. Wang et al.
http://www.astro.dur.ac.uk/ lwang83/RIFSCz.tar.gz. The long ver-
sion contains all the information (e.g. positional, photometric or
spectroscopic) we have either assembled or derived in the process
of constructing the RIFSCz. Then short version contains the most
important information and should suffice for most users. The format
of the long and short version of the RIFSCz catalogue is explained
in the Appendix. As pointed out in Section 3.1, we will re-run our
photometric redshift estimation and the subsequent infrared tem-
plate fitting for RIFSCz sources matched with WISE, when the
WISE extended fluxes are available. Future updates of the cata-
logue, including incorporation of AKARI infrared fluxes, improved
fluxes for WISE extended sources, and improved treatment of very
extended optical galaxies, will be released from the RIFSCz web
site.
To summarize, the revised IRAS-FSC Redshift Catalogue
Downloaded from http://mnras.oxfordjournals.org/ at Imperial College London Library on November 14, 2014
(RIFSCz) contains 60 303 galaxies, selected at 60 μm from the IRAS
Faint Source Catalog, covering ∼61 per cent of the sky. 56 per cent
of the RIFSCz have spectroscopic redshifts from NED, FSSz, PSCz,
Figure 17. Infrared to UV luminosity ratio (IRX) versus the slope of the 6dF and the SDSS DR10 and 26 per cent have photometric redshifts
UV spectrum (β) for the RIFSCz (black dots: galaxies with SNR ≥5 UV from the template-fitting method. At a flux limit of S60 = 0.36 Jy
detections and reduced χ 2 of the infrared SED fit ≤3; yellow dots: a subset (90 per cent completeness limit of the FSC), 93 per cent of the
of the black dots detected at 350 µm), compared with other relations in the
galaxies in the RIFSCz have either spectroscopic or photometric
literature. Typical statistical error of the infrared luminosity (LIR ) for the
black dots and yellow dots is ∼0.3 and 0.1 dex, respectively.
redshifts. The process of retrieving spectroscopic redshifts, mul-
tiwavelength identification and photometric redshift estimation is
described in detail. Users should be aware of issues such as the
intrinsic FSC completeness limit, the redshift completeness varia-
having Mdust /M∗ in the range 10−6 –10−2 . Galaxies dominated by tions across the sky and the varying quality of photometric redshifts
cool cirrus tend to require higher specific dust masses. derived for different subsets of the catalogue.
5 CONCLUSIONS AND DISCUSSIONS
AC K N OW L E D G E M E N T S
The RIFSCz represents the best all-sky far-infrared (60 μm) se-
lected galaxy catalogue with multiwavelength information. Several LW and PN acknowledge support from an ERC StG grant (DEGAS-
extragalactic science programmes can be carried out with this data 259586). PN also acknowledges the support of the Royal Society
set. For example, we can examine the relation between the ratio of through the award of a University Research Fellowship.
the infrared to UV luminosity (the infrared excess: IRX) and the This research has made use of the NASA/IPAC Extragalactic
slope of the UV spectrum (β). This relation is critical to estimating Database (NED) which is operated by the Jet Propulsion Laboratory,
dust attenuation and hence the true SFR. In Fig. 17, we plot IRX California Institute of Technology, under contract with the National
versus β for RIFSCz galaxies with GALEX UV detections at SNR Aeronautics and Space Administration.
≥ 5 and reduced χ 2 of the infrared SED fit ≤3 and a subset of these Funding for SDSS-III has been provided by the Alfred P. Sloan
galaxies which are detected at 350 μm by Planck. Our β values are Foundation, the Participating Institutions, the National Science
derived using the recipe from Kong et al. (2004). A compilation of Foundation, and the US Department of Energy Office of Science.
the IRX–β relations from the literature is also plotted. The Calzetti The SDSS-III web site is http://www.sdss3.org/. SDSS-III is man-
et al. (2000) and Overzier et al. (2011) relations are derived from aged by the Astrophysical Research Consortium for the Partic-
UV-selected samples. The Boquien et al. (2012) relation is derived ipating Institutions of the SDSS-III Collaboration including the
from a K-band selected sample. The Muñoz-Mateos et al. (2009) University of Arizona, the Brazilian Participation Group,
relation is derived from the Spitzer Infrared Nearby Galaxies Sur- Brookhaven National Laboratory, Carnegie Mellon University,
vey (SINGS) sample (Kennicutt et al. 2003) of 75 local galaxies University of Florida, the French Participation Group, the
spanning a large range in morphology, luminosity, SFR and opac- German Participation Group, Harvard University, the Instituto de
ity. The Hao et al. (2011) relation is derived from SINGS combined Astrofisica de Canarias, the Michigan State/Notre Dame/JINA Par-
with a sample of local galaxies covering the full range of optical ticipation Group, Johns Hopkins University, Lawrence Berkeley
spectral characteristics (Moustakas & Kennicutt 2006). There is a National Laboratory, Max Planck Institute for Astrophysics, Max
large dispersion among the different relations derived from samples Planck Institute for Extraterrestrial Physics, New Mexico State Uni-
with different selection criteria and our far-infrared selected sample versity, New York University, Ohio State University, Pennsylvania
show a general good agreement with these relations. In addition, our State University, University of Portsmouth, Princeton University,
far-infrared selected sample also seems to cover regions with high the Spanish Participation Group, University of Tokyo, University
IRX but low β values which are not represented in other relations. of Utah, Vanderbilt University, University of Virginia, University
Detailed investigations are required to fully understand the causes of Washington and Yale University.
of the difference between our IRX–β relation based on far-infrared This publication makes use of data products from the Two
selection and the other relations. Micron All Sky Survey, which is a joint project of the Univer-
We provide a long version and a short version of the RIF- sity of Massachusetts and the Infrared Processing and Analysis
SCz, available from http://astro.ic.ac.uk/public/mrr/fss/readme and Center/California Institute of Technology, funded by the National
MNRAS 442, 2739–2750 (2014)The Revised IRAS-FSC Redshift Catalogue 2749
Aeronautics and Space Administration and the National Science APPENDIX A: THE LONG VERSION OF THE
Foundation. R I F S C Z C ATA L O G U E
This publication makes use of data products from the Wide-
Notes on the catalogue columns for the long version.
field Infrared Survey Explorer, which is a joint project of the
Col 1–7. IRAS source name, GALEX source ID, SDSS object
University of California, Los Angeles and the Jet Propulsion
ID, 2MASS source designation, WISE source designation, Planck
Laboratory/California Institute of Technology, funded by the
source name and NED source name.
National Aeronautics and Space Administration.
Col 8–10. SDSS type, NED type, stellar flag
(1=galaxy/extended, −1 = stellar/QSO and 0 = unknown).
Col 11–25. IRAS positions, SDSS positions, 2MASS posi-
REFERENCES tions, WISE positions, Planck positions, NED positions, rec-
Ahn C. P. et al., 2013, ApJS, 211, 17
ommended position and flag (1=SDSS, 2=2MASS, 3=WISE,
Bilicki M., Jarrett T. H., Peacock J. A., Cluver M. E., Steward L., 2014, 4=NED, 5=FSC and prioritized in the same order).
ApJS, 210, 9 Col 26–30. SDSS spectroscopic redshift, 2MRS redshift, NED
Boquien M. et al., 2012, A&A, 539, A145 redshift, recommended spectroscopic redshift and flag (1=SDSS,
Downloaded from http://mnras.oxfordjournals.org/ at Imperial College London Library on November 14, 2014
Brusa M. et al., 2007, ApJS, 172, 353 2=PSCz, 3=FSSz, 4=6dF, 5=NED, 6=2MRS and 7=Bilicki5 ).
Budavári T. et al., 2009, ApJ, 694, 1281 The priority order is NED>SDSS>2MRS>PSCz>FSSz>6dF.
Calzetti D., Armus L., Bohlin R. C., Kinney A. L., Koornneef J., Storchi- Col 31. Photometric redshift for sources with optical or near-
Bergmann T., 2000, ApJ, 533, 682 infrared photometry.
Chapin E. L. et al., 2011, MNRAS, 411, 505 Col 32. Recommended redshift which is equal to spectroscopic
Efstathiou A., Rowan-Robinson M., 2003, MNRAS, 343, 322
redshift (if available) or photometric redshift.
Elbaz D. et al., 2011, A&A, 533, A119
Hao C.-N., Kennicutt R. C., Johnson B. D., Calzetti D., Dale D. A.,
Col 33 - 37. The number of bands used in the photometric redshift
Moustakas J., 2011, ApJ, 741, 124 fit, optical template type, extinction AV, reduced χ 2 of the best fit,
Heinis S., Budavári T., Szalay A. S., 2009, ApJ, 705, 739 and the absolute B magnitude.
Huchra J. P. et al., 2012, ApJS, 199, 26 Col 38–41. GALEX far-UV flux and error, GALEX near-UV flux
Jarrett T. H., Chester T., Cutri R., Schneider S., Skrutskie M., Huchra J. P., and error.
2000, AJ, 119, 2498 Col 42–51. SDSS magnitudes and errors at u, g, r, i, z.
Jarrett T. H. et al., 2011, ApJ, 735, 112 Col 52–63. 2MASS PSC magnitudes and errors at J, H, Ks ,
Jones D. H. et al., 2004, MNRAS, 355, 747 2MASS XSC magnitudes and errors at J, H, Ks .
Jones D. H., Saunders W., Read M., Colless M., 2005, PASA, 22, 277 Co 64–71. WISE magnitudes and errors at 3.4, 4.6, 12 and
Kennicutt R. C., Jr, et al., 2003, PASP, 115, 928
22 μm.
Kong X., Charlot S., Brinchmann J., Fall S. M., 2004, MNRAS, 349, 769
Moshir M., Kopman G., Conrow T. A. O., 1992, in Moshir M., Kopman
Col 72–79. IRAS fluxes and quality flags at 12, 25, 60 and
G., Conrow T. A. O., eds, Pasadena: Infrared Processing and Analysis 100 μm.
Center. California Institute of Technology, Pasadena, CA Col 80–87. Planck fluxes and errors at 350, 550, 850 or 1382 μm.
Moustakas J., Kennicutt R. C., Jr, 2006, ApJS, 164, 81 Col 88–89. Integrated 1.4 GHz flux density and error.
Muñoz-Mateos J. C. et al., 2009, ApJ, 701, 1965 Col 90–102. Aperture correction, aperture corrected u, g, r, i, z,
Overzier R. A. et al., 2011, ApJ, 726, L7 J, H, Ks , 3.4, 4.6, 12 and 22 μm fluxes.
Planck Collaboration I et al., 2013, preprint (arXiv:1303.5062) Col 103–106. Redshift flag (1=spectroscopic redshift,
Planck Collaboration XVI et al., 2011, A&A, 536, A16 2=photometric redshift, 3=no redshift), IR template type
Planck Collaboration XXVIII et al., 2013, preprint (arXiv:1303.5088) (1=cirrus, 2=M82, 3=A220, 4=AGN dust torus, 5=young star-
Rice W., Lonsdale C. J., Soifer B. T., Neugebauer G., Kopan E. L., Lloyd
burst, 6=cool cirrus), reduced χ 2 for the IR template fit, number of
L. A., de Jong T., Habing H. J., 1988, ApJS, 68, 91
Rodighiero G. et al., 2011, ApJ, 739, L40
bands used in the IR template fit.
Rowan-Robinson M., 1992, MNRAS, 258, 787 Col 107–112. Fraction of contribution at 60 μm of each of the
Rowan-Robinson M., 2000, MNRAS, 316, 885 six IR templates.
Rowan-Robinson M., Crawford J., 1989, MNRAS, 238, 523 Col 113–119. Fraction of IR luminosity in each of the six IR
Rowan-Robinson M., Efstathiou A., 2009, MNRAS, 399, 615 templates, total IR luminosity.
Rowan-Robinson M., Wang L., 2010, MNRAS, 406, 720 Col 120–133. Predicted fluxes at 12, 25, 60, 90, 100, 110, 140,
Rowan-Robinson M. et al., 1997, MNRAS, 289, 490 160, 250, 350, 550, 850, 1250 and 1380 μm.
Rowan-Robinson M. et al., 2005, AJ, 129, 1183 Col 134–136. Stellar mass, SFR, dust mass.
Rowan-Robinson M. et al., 2008, MNRAS, 386, 687 Col 137–221. array of reduced χ 2 , minimized over all templates,
Rowan-Robinson M. et al., 2010, MNRAS, 409, 2
in bins of 0.01 in log10 (1 + z), from 0 to 0.85.
Rowan-Robinson M., Gonzalez-Solares E., Vaccari M., Marchetti L., 2013,
MNRAS, 428, 1958
Salpeter E. E., 1955, ApJ, 121, 161
Saunders W. et al., 2000, MNRAS, 317, 55
Skrutskie M. F. et al., 2006, AJ, 131, 1163 5 When comparing the RIFSCz and the Bilicki et al. (2014) catalogue, we
Spoon H. W. W., Marshall J. A., Houck J. R., Elitzur M., Hao L., Armus L., found that there are 80 galaxies where the Bilicki et al. spec-z differs from
Brandl B. R., Charmandaris V., 2007, ApJ, 654, L49 the RIFSCz spec-z by more than 0.2. For 60 out of these 80 galaxies, the
Sutherland W., Saunders W., 1992, MNRAS, 259, 413 Bilicki et al. spec-z have better agreement with the optical to near-infrared
Wang L., Rowan-Robinson M., 2009, MNRAS, 398, 109 SED. As a result, we have adopted the spec-z from the Bilicki et al. catalogue
Wang L. et al., 2013, preprint (arXiv:1312.0552) for these 60 galaxies. In addition, there are 513 new spec-z from the Bilicki
Wright E. L. et al., 2010, AJ, 140, 1868 et al. catalogue which are not included in our spec-z compilation described
Yan L. et al., 2013, AJ, 145, 55 in Section 2.6. So, in total, we have adopted 573 spec-z from the Bilicki
York D. G. et al., 2000, AJ, 120, 1579 et al. catalogue.
MNRAS 442, 2739–2750 (2014)2750 L. Wang et al.
Col 222. Bilicki et al. (2014) photometric redshift derived from Co 41–48. WISE magnitudes and errors at 3.4, 4.6, 12 and
the artificial neural network approach. 22 μm,
Col 49–56. IRAS fluxes and quality flags at 12, 25, 60 and
100 μm,
A P P E N D I X B : T H E S H O RT V E R S I O N O F T H E
Col 57–64. Planck fluxes and errors at 350, 550, 850 or 1382 μm.
R I F S C Z C ATA L O G U E
Col 65–66. Integrated 1.4 GHz flux density and error.
Notes on the catalogue columns for the short version. Col 67–78. Aperture corrected ugriz, J, H, Ks , 3.4, 4.6, 12 and
Col 1. IRAS source name. 22 μm fluxes.
Col 2. Stellar flag (1=galaxy/extended, −1=stellar/QSO and Col 79–82. Redshift flag (1=spectroscopic redshift,
0=unknown). 2=photometric redshift, 3=no redshift), Infrared template
Col 3–5. Recommended position and flag (1=SDSS, 2=2MASS, type (1=cirrus, 2=M82, 3=A220, 4=AGN dust torus, 5=young
3=WISE, 4=NED, 5=FSC and prioritized in the same order). starburst, 6=cool cirrus), reduced χ 2 for the IR template fit,
Col 6–7. Recommended spectroscopic redshift and number of bands used in the IR template fit
flag (1=SDSS, 2=PSCz, 3=FSSz, 4=6dF, 5=NED, Col 83–88. Fraction of contribution at 60 μm of each of the six
6=2MRS and 7=Bilicki). The priority order is IR templates.
Downloaded from http://mnras.oxfordjournals.org/ at Imperial College London Library on November 14, 2014
NED>SDSS>2MRS>PSCz>FSSz>6dF. Col 89–95. Fraction of IR luminosity in each of the six IR tem-
Col 8. Photometric redshift for sources with optical or near- plates, total IR luminosity.
infrared photometry Col 96–109. Predicted fluxes at 12, 25, 60, 90, 100, 110, 140,
Col 9. Recommended redshift which is equal to spectroscopic 160, 250, 350, 550, 850, 1250 and 1380 μm.
redshift if it is available or photometric redshift. Col 110–112. Stellar mass, SFR, dust mass.
Col 10–14. The number of bands used in the photometric redshift Col 113. Bilicki et al. (2014) photometric redshift derived from
fit, optical template type, extinction AV, reduced χ 2 of the best fit, the artificial neural network approach.
and the absolute B magnitude.
Col 15–18. GALEX far-UV and near-UV flux and error.
Col 19–28. SDSS magnitudes and errors at u, g, r, i, z.
Col 29–40. 2MASS PSC magnitudes and errors at J, H, Ks ,
2MASS XSC magnitudes and errors at J, H, Ks . This paper has been typeset from a TEX/LATEX file prepared by the author.
MNRAS 442, 2739–2750 (2014)You can also read