The Role of Data in Tackling Urban Air Pollution: Siemens City Performance Tool - IEMA
←
→
Page content transcription
If your browser does not render page correctly, please read the page content below
The Role of Data in Tackling Urban Air Pollution: Siemens City
                          Performance Tool

•   By 2050, more than 70 percent of the global population will live in urban areas
•   City leaders face the challenge of making cities more sustainable whilst driving growth
•   By translating data into intelligent insights, city leaders can address societal challenges

Setting the scene
Currently, over 4 billion people – more than half the global population – live in cities, with forecasts
suggesting that by 2050, more than 70 percent of the global population will live in urban areas. Cities
are regarded as important engines of economic growth in an increasingly urbanised and connected
world, as they generate more than 80 percent of global GDP1. The challenge, therefore, for city leaders
around the world, is to develop and implement plans to address the speed and scale of urbanisation
whilst continuing to drive economic growth. In addition to this monumental challenge, they will also need
to understand and adapt to a number of other megatrends that are redefining the ways in which cities
function. Some of these include the proliferation of technologies that are transforming energy grids,
mobility systems and the built environment. Furthermore, the imperative to make cities and human
settlements inclusive, safe, resilient and sustainable has been established as one of the 17 Sustainable
Development Goals (SDGs) at the heart of the 2030 Agenda for Sustainable Development which was
adopted by all United Nations Member States in 2015.

There is now widespread recognition, across all sections of society, that economic growth should not
come at the expense of society’s most pressing environmental and social concerns. Among these
concerns, the issue of ambient air pollution has come to the fore in recent times due to growing
awareness of the public health and economic implications. For example, air pollution has been
described as the single largest environmental health risk in Europe, with the European Environment
Bureau (EEB) estimating that up to 430,000 premature deaths annually are caused by air pollution in
the EU, while the European Environment Agency (EEA) estimates that around 85 percent of the urban
population in the EU28 were exposed to pollutant levels that are much higher than recommended
thresholds. On a global scale, the World Health Organization (WHO) estimates that 4.2 million
premature deaths are linked to air pollution, mainly from health conditions such as heart disease, stroke,
chronic obstructive pulmonary disease, lung cancer, and acute respiratory infections in children2. From
an economic perspective, the health-related external costs of air pollution in Europe could be as much
as €300 billion3, while it is estimated to cost around £3.7 billion in London alone 4.

The role of governments and other stakeholders in addressing this critical challenge is now widely
acknowledged, leading to a number of initiatives aimed at curbing the emission of harmful pollutants.
Some notable measures include the recent introduction of an Ultra Low Emission Zone (ULEZ) in
London, considered one of the most radical anti-pollution schemes in the world. Based on the ‘polluter
pays’ principle, the scheme levies a daily charge on older, more polluting cars driving into London with
the aim of reducing air pollution in central London by 15 percent and more broadly by 4 percent. Public
Health England, the government agency tasked with protecting the population’s health, have also called
for the establishment of “clean air” zones in other areas of high population density. Further afield, cities
such as Paris, Madrid, Athens and Mexico City have announced their intention to ban the use of diesel
vehicles by 2025. While these measures are expected to contribute to improving urban air quality,
evidence from a number of studies of low emission zones (LEZ) in Denmark, Germany, the Netherlands,
Italy and the UK suggests that their efficacy varies depending on a number of factors. Some of these
factors include vehicle categories (passenger cars, heavy duty vehicles, motorbikes, etc. included in
the schemes) and pollutants considered. Furthermore, separating the direct effects of a LEZ from the
effects of other policy measures, the economy and normal renewal of the vehicle fleet is challenging,

1
  Urban Development. World Bank, 2019. https://www.worldbank.org/en/topic/urbandevelopment/overview
2
   Ambient air pollution: Health Impacts. World Health Organization, 2019. https://www.who.int/airpollution/ambient/health-
impacts/en/
3
  European Commission, 2013. Commission Staff Working Document, Impact Assessment – Accompanying the Communication
from the Commission to the Council, the European Parliament, the European Economic and Social Committee and the Committee
of Regions – A Clean Air Program for Europe, SWD (2013), European Commission, Brussels.
4
  https://www.theguardian.com/uk-news/2019/may/16/ulez-cuts-number-of-worst-polluting-cars-in-central-london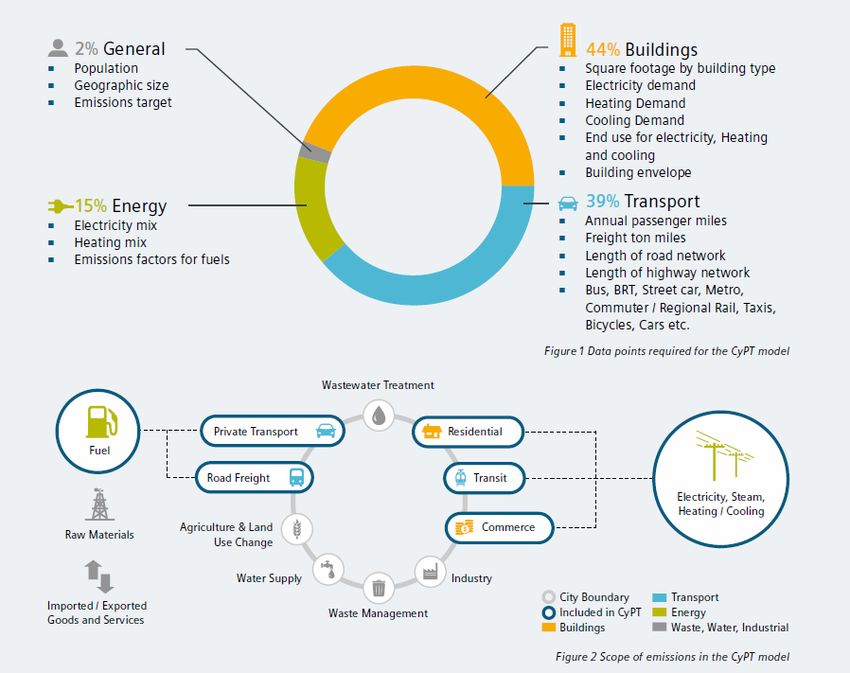
and may impact the findings5, underscoring the need for solutions that enable data-informed decision-
making. As a responsible corporate citizen, Siemens is playing a leading role in developing solutions
that transform data into insights to support decision makers tackle the sustainability challenges we face
as a society.

The City Performance Tool (CyPT): converting data into insights
In order to help cities make more informed strategic decisions about the impact of technology and
infrastructure on sustainability goals, Siemens developed the City performance Tool (CyPT) which
identifies the best performing technologies in the energy, real estate and transport sectors for reducing
greenhouse gas (GHG) emissions and improving air quality. The tool utilises information about a city’s
population size and growth projections, power generation and consumption, modes of travel around the
city and other activity data, and generates a baseline emissions profile based on emission factors for
the aforementioned activities. The tool then analyses the impact of different technology and
infrastructure scenarios from a selection of over 70 technologies at specified implementation rates and
generates a shortlist of the most cost-effective solutions to help the city meet its environmental
sustainability goals.

CyPT-Air is a further development of the CyPT with a particular focus on air pollution from the transport
sector which examines the potential impacts of more than 40 transport-related technologies and
infrastructure. The WHO has identified transport as a significant and growing contributor to air pollution,
with road transport estimated to be responsible for up to 30 percent of particulate matter (PM) emissions
in European cities and up to 50 percent in OECD countries – mostly attributed to diesel vehicles.
However, it should be noted that the contribution of transport to PM emissions can vary widely and can
constitute from 12 to 70 percent of the total pollution mix 6. Other transport-related air pollutants include
ground level ozone (O3), as well as its precursors nitrogen oxides (NOx) and carbon monoxide (CO).
CyPT-Air assesses how transport-related measures might reduce traffic for example, less time spent in
traffic searching for parking spaces; induce modal shifts e.g. increased public transport utilisation
instead of private cars; or increase efficiency (e.g. automated trains), thereby reducing overall city
emissions.

5
  Holman, C, Harrison, R and Querol, X 2015, 'Review of the efficacy of low emission zones to improve urban air quality in
European cities' Atmospheric Environment, vol. 111, pp. 161-169. https://doi.org/10.1016/j.atmosenv.2015.04.009
6
  World Health Organisation (WHO), 2019. Health and sustainable development: Air pollution. https://www.who.int/sustainable-
development/transport/health-risks/air-pollution/en/
A strategic air quality plan for the city of Nuremberg
Nuremberg – the second largest city in the German federal state of Bavaria and home to around half a
million inhabitants – is listed among the top 25 cities in the 2019 Mercer Quality of Living City Ranking7
not least due to its progressive environmental policies. Nuremberg is a pilot city for many measures
aimed at reducing air pollutants and greenhouse gas emissions and is taking a lead role in the region.
Notwithstanding, a number of air quality monitoring stations in the city were found to be non-compliant
with threshold values for air pollutants. The city therefore, partnered with Siemens to assess the
potential impact of a number of technology and infrastructure measures to improve its air quality.
Nuremberg complies with the EU’s particulate matter limit for PM10, although the World Health
Organisation (WHO) recommendation for good air quality (20 μg/m3 annual mean) has not been
achieved across all measuring stations. The mean annual NO2 limit value is currently not yet complied
with at the urban traffic air quality measuring point of the Bavarian state monitoring programme. The
primary cause for exceedances of NO2 is local traffic. As part of the city's air pollution plan update,
Siemens piloted its new CyPT-Air with Nuremberg. After a comprehensive data collection process with
the support of several city departments, agencies and local companies, the traffic system and its
emissions of airborne and CO2eq emissions were analysed with the subsequent development of a
business as usual (BAU) scenario up to 2030. This was followed by an investigation into a large number
of potential pollutant reduction measures (levers). The city developed three scenarios for 2020 and
2025 in a subsequent workshop with participants from various departments and local companies based
on the results of this analysis. The scenarios are summarised below.
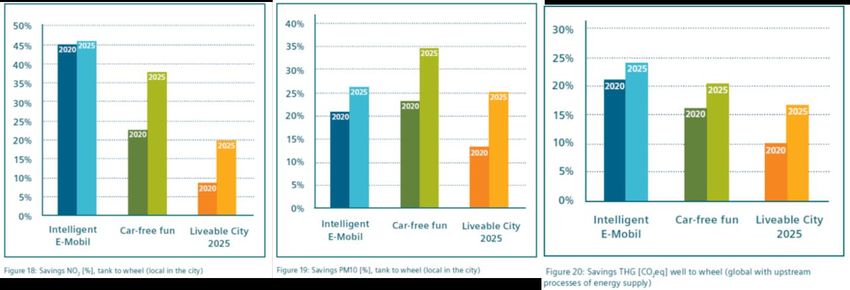
The first scenario aims at a short to medium-term reduction of local NO2 emissions by 2020. The most
effective measures are the low emission zone with a blue badge, limiting access to EURO 6 vehicles,
city tolling and a realistic electrification of bus, taxis and car fleets. The scenario achieves a 45%
reduction in transport-related NO2 emissions as compared to the BAU scenario by 2020. This would
ensure compliance with the limit values, for example at the urban air quality measuring station located
near traffic in Von-der-Tann-Strasse.
Lever 2020 2025
Electric buses 20% 50%
Intelligent traffic light control 40% 80%
Reduction of car traffic 5% 10%
Electric car fleet share 10% 20%
Electric taxis fleet share 10% 20%
Bicycle highways 2 km per 100k inhabitants 4 km per 100k inhabitants
City tolling: cars and motorcycles 15% 15%
Low emission zones for cars EURO 6 EURO 6
The second scenario has the primary goal of significantly reducing greenhouse gas emissions and
particulate matter by 2025. The scenario relies on modal shifts and uses city tolling as a push effect
and the significant expansion of public transport, electric car sharing and cycle highways for a pull effect.
Alternative drives are also used for buses and cars. These measures will achieve annual greenhouse
gas reductions (CO2eq) of 20% and a particulate
matter emission reduction (PM10) of 35% by 2025.
Lever 2020 2025
Electric buses 20% 50%
Metro: route extension 0 6 new km
Reduction of car traffic 5% 10%
Hydrogen car fleet share 10% 20%
eCar sharing 3 per 1,000 inhabitants 6 per 1,000 inhabitants
Tram: new line 0 2 new lines
Bicycle highways 2 km per 100k inhabitants 4 km per 100k inhabitants
City tolling: cars and motorcycles 20% 20%
E-ticketing public transport 25% 50%
The third scenario aims to create a modern, intermodal urban transportation system. The scenario
encourages behavioural changes through many pull effects, such as the expansion of the rail-based
7
https://mobilityexchange.mercer.com/Insights/quality-of-living-rankingspublic transport system through new routes and reduced train headways, an annual public transport subscription for 365€ per year and easy e-ticketing. Bicycles and electric car sharing represent an alternative to public transport. Despite renouncing undesirable push effects, the measures achieve a 22% reduction in particulate matter and a 16% reduction in greenhouse gas emissions. Lever 2020 2025 Metro: route extension 0 6 new km Reduction of car traffic 5% 10% eCar sharing 1 per 1,000 inhabitants 2 per 1,000 inhabitants Intermodal Traffic Management (app) 25% 50% Bike sharing 4 km 8 km Tram: new line 0 4 new lines Metro: reduced headway 15% 30% Bicycle highways 2 km per 100k inhabitants 4 km per 100k inhabitants E-ticketing public transport 40% 80% 365€ p.a. public transport subscription 365€ 365€ Measures selected for all three targets are cycle highways and a general reduction in car traffic. The actions to reduce emissions significantly all rely on city tolling and electric buses. The most popular long-term measures are the expansion of the metro and tram network, the introduction of an e-ticketing system and the implementation of an eCar sharing system. For more information about the City Performance Tool (CyPT), contact: klaus.heidinger@siemens.com For more details on the Nuremberg case study, contact: florian_ansgar.jaeger@siemens.com www.siemens.com/cypt
You can also read