The Silent Housing Crisis: A Snapshot of Current and Future Conditions - HO USING A MERIC A' S FA MILI E S
←
→
Page content transcription
If your browser does not render page correctly, please read the page content below
The Silent
Housing Crisis:
A Snapshot of
Current and Future Conditions

    j. R O N A L D T ERW I L L I G ER
    F O U N D A T I O N
                          for

    H O U S I N G A M E R I C A’ S F A M I L I E S
J. Ronald Terwilliger Foundation for Housing America’s Families

         J. Ronald Terwilliger, Chairman
                                                         Advisory Board
         Pamela H. Patenaude, President                  Carin Barth

                                                         Ed Brady

                                                         Raphael Bostic
         Executive Committee
                                                         Al DelliBovi
         Scott Brown
                                                         Carol Galante
         Henry Cisneros
                                                         Renee Glover
         Rick Lazio
                                                         Bart Harvey
         Nic Retsinas
                                                         Jeb Mason

                                                         Rick Rosan

                                                         Dave Stevens

         About the Foundation
         Established in 2014, the J. Ronald Terwilliger Foundation for Housing Amer-

         ica’s Families seeks to recalibrate federal housing policy so that it more

         effectively addresses our nation’s critical affordable housing challenges and

         meets the housing needs of future generations. The Foundation will offer a

         set of practical suggestions for tax, spending, and mortgage finance reform

         that is responsive to the ongoing crisis in housing and the profound demo-

         graphic changes now transforming America.

   2                                                      The Silent Housing Crisis: A Snapshot of Current and Future Conditions
“                The Housing Act of 1949 also establishes as a national objective
                                                                                     the achievement as soon as feasible of a decent home and a suitable living
                                                                                      environment for every American family, and sets forth the policies to be
                                                                                      followed in advancing toward that goal. These policies are thoroughly
                                                                                       consistent with American ideals and traditions. They recognize and
                                                                                        preserve local responsibility, and the primary role of private enterprise,
                                                                                         in meeting the Nation’s housing needs. But they also recognize clearly

                                                                                                                                   ”
                                                                                          the necessity for appropriate Federal aid to supplement the resources
                                                                                          of communities and private enterprise.

                                                                                                                               Statement by President Harry Truman
                                                                                                                               upon signing the Housing Act of 1949
Photo: Wally Gobetz/flickr.com

                                 The Silent Housing Crisis: A Snapshot of Current and Future Conditions                                          3
➧
The Silent Housing Crisis:
A Snapshot of Current and Future Conditions
        Introduction
        Today, nearly six years after the Great Recession officially ended, our nation’s
        housing system remains in a state of crisis. Soaring rental demand, an acute
        shortage of affordable rental homes, significantly tougher mortgage under-
        writing standards, and an uneven economic recovery have all combined to
                                     make housing a source of distress and instability
                                       for millions of Americans. With little relief in
                                        sight, growing numbers of families find them-
                                        selves stuck between a rental market they can
                                       no longer afford and a homeownership market
                                        for which they do not qualify.

                                         A legacy of the Great Recession, the dire state
                                         of housing in our country is a “silent” crisis
                                       often overlooked by policymakers, ignored by
                                       the media and underestimated by the general
                                       public, despite deeply impacting millions of
                                     families and clouding our nation’s future.

                                      Having access to safe and
                                      affordable housing has long been
                                      recognized as a critical part of
                                      America’s social compact with its citizens.

   4                                             The Silent Housing Crisis: A Snapshot of Current and Future Conditions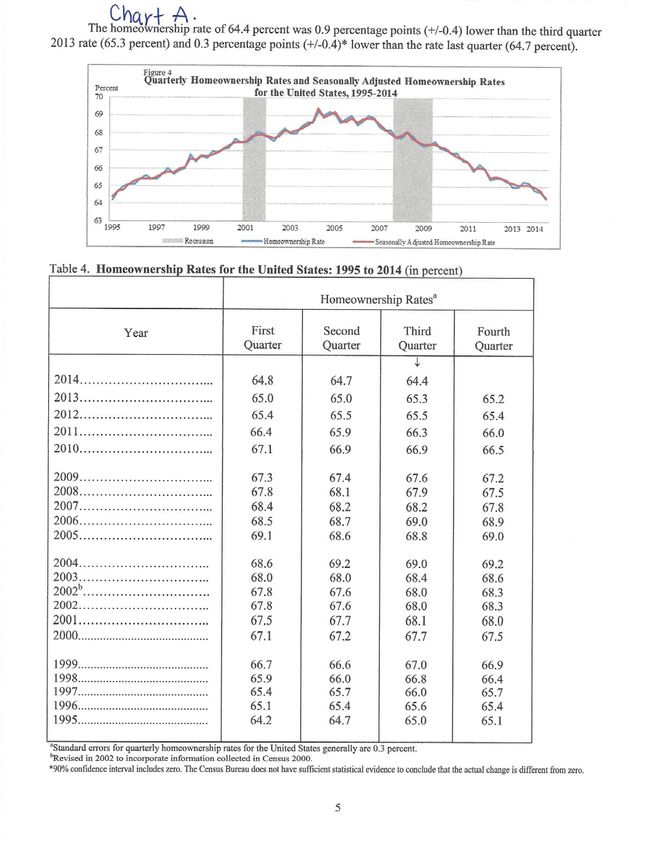
➧
Consider these facts:
n Housing affordability is a significant
    and growing challenge for millions of
    American families who live in housing
    that exceeds their means. Nearly 20
    million families spend more than half
    their income on housing and more
    than one-third of all U.S. households,
    almost 41 million in total, pay in excess
    of 30 percent of their incomes just
    to cover housing costs.1 While our
    nation’s lowest-income households
    have been hit the hardest, over the past
    decade, some of the sharpest increases
    in housing cost burdens have been
    among moderate-income families.2

n For renter households the affordability
    situation is particularly alarming. The
    percentage of cost-burdened renter
    households has doubled over the past
    50 years. More than 11 million renter
    households, constituting 27 percent of
                                                                         n A major factor contributing to this
                                                                            “rent squeeze” is the acute shortage
                                                                            of rental homes affordable to families
                                                                            with the lowest incomes. For every 100
                                                                            extremely low-income families who
                                                                            rent, there are just 29 affordable units
                                                                            available in the marketplace, translat-
                                                                            ing into a total shortfall of more than 8
                                                                            million units.4 The production of new
                                                                            rental homes that are affordable to
                                                                            those at the lowest end of the income
                                                                            spectrum is woefully insufficient.
                                                                                                                        ...according to the
                                                                                                                        Urban Institute,
                                                                                                                        62 percent of new
                                                                                                                        housing demand
                                                                                                                        will be rental
                                                                                                                        during this decade
                                                                                                                        (2010-2019).

    all renters, now pay more than half their
    incomes for housing. In addition, 20.6
    million renters, or half of the total renter
                                                                         n Federal rental assistance provides
    population, pay in excess of 30 percent.3
                                                                            much-needed help for lower-income
    These rent burdens are national in scope,
                                                                            families, but only about one in five
    affecting families in rural, suburban, and
                                                                            households eligible for assistance actu-
    inner-city areas. Today, rents continue
                                                                            ally receives it.5 In many communities,
    to rise in communities throughout the
                                                                            federal rental assistance is often allo-
    country, often forcing many lower-income
                                                                            cated through waitlists that can span
    renters to forego purchasing nutritious
                                                                            several years or by lottery.
    food, seeking medical help when a health
    issue arises, or buying clothing and other                           n The national homeownership rate (sea-
    essentials for their families.                                          sonally adjusted) now stands at 63.9
                                                                            percent, its lowest level in 20 years,6

The Silent Housing Crisis: A Snapshot of Current and Future Conditions                                                   5
falling from its peak of 69.4 percent in          it is expected that 8.9 million net new minor-
                            2004. This precipitous drop is the result,        ity households will form, accounting for 77
                                                                              percent of total household growth during this
                            in part, of the estimated 5.2 million
                                                                              period.10 From 2020 to 2030, minorities are pro-
                            home foreclosures that have been com-             jected to account for a staggering 88 percent
...our nation is            pleted since September 2008.7                     of household growth. With significantly lower
                                                                              incomes and overall wealth than their white
unprepared for           n The share of total home purchases by               counterparts, many of these households –
                            first-time homebuyers has hit a 27-year           while desiring homeownership – will simply
the tremendous                                                                not have the resources to meet mortgage-
                            low8, with student loan debt and higher
challenges that a                                                             underwriting requirements. As a result, renting
                            rents among the factors making it
                                                                              will be their only housing option.
                            more difficult for young adults to save
rapidly expanding                                                             Unfortunately, our nation is unprepared for the
                            for a mortgage down payment.
                                                                              tremendous challenges that a rapidly expand-
renter population will   n More than a decade of stagnating                   ing renter population will pose to the already-
                                                                              strained housing system. Absent a compre-
pose to the already-        household incomes, a phenomenon
                                                                              hensive and sustained policy response, it is
                            that began in the late 1990s, continues
strained housing            to weigh heavily on family budgets
                                                                              likely that rental cost burdens will only grow in
                                                                              intensity and scope, undermining the stabil-
system. Absent a            and puts homeownership out of reach               ity and dampening the hopes of millions of
                            for many lower- and moderate-income               American families. These conditions, in turn,
comprehensive and           families. Some experts predict that
                                                                              will exacerbate income inequality, diminish
                                                                              the prospects of social mobility for countless
sustained policy            the national homeownership rate                   individuals, make us less competitive in the
                            could eventually stabilize somewhere              global marketplace, and ultimately hinder
response, it is likely      between a high of 62 percent and a                America’s economic growth.
that rental cost            low of 60 percent.                                The stakes are high. Having access to safe and
                                                                              affordable housing has long been recognized
burdens will only                                                             as a critical part of America’s social compact
                         If these facts are not enough to give you            with its citizens. In the Housing Act of 1949,
grow in intensity        pause, consider that over the next five years,       Congress first established a clear national
                         America’s changing demographics are likely           policy objective: the realization as soon as
and scope, under-        to exacerbate the troubled conditions that           feasible of “a decent home and suitable living
                         define housing today. New household forma-           environment for every American family.”
mining the stability     tion by the Millennials, the increasing diver-
                                                                              It has been more than 65 years since
and dampening the        sity of the U.S. population, higher expected
                                                                              Congress enacted this landmark legisla-
                         levels of immigration, and the aging of the 78
                                                                              tion, yet achievement of this worthy goal
hopes of millions of     million Baby Boomers will all converge in a
                                                                              remains elusive.
                         way that substantially increases the already-
American families.       strong demand for rental housing. In fact,           The following pages more fully describe the
                         according to the Urban Institute, 62 percent         conditions that define the silent housing crisis
                         of new housing demand will be rental during          in America. A clear understanding of these
                         this decade (2010 to 2019).9                         conditions is necessary if we are to develop
                                                                              new, more effective approaches to help meet
                         Most significantly, minorities will be the driving
                                                                              the housing needs of the American people
                         force behind new household formation for
                                                                              both today and in the years ahead.
                         the foreseeable future. From 2010 to 2020,

                   6                                                          The Silent Housing Crisis: A Snapshot of Current and Future Conditions
The Silent Housing Crisis: A Snapshot of Current and Future Conditions 7
New Market Realities
                               Motivated by an understandable desire to                    With the 2007-2008 financial crisis and the
                               expand the benefits of homeownership to a                   collapse of the homeownership market,
                               wider segment of the U.S. population, both                  these numbers have tumbled: As of the
...the national                President Bill Clinton and President George                 fourth quarter of 2014, the national home-
                               W. Bush made increasing the percentage of                   ownership rate stands at 63.9 percent, more
homeownership                  homeowner households a high priority of                     than five percentage points below its high
                               their administrations. Policies such as feder-              in 2004 and comparable to the rate that
rate stands at                 ally–supported down payment assistance for                  existed between1965 and 1995 and before
                               first-time homebuyers and a strengthening                   the federal push for homeownership took
63.9 percent,                  of the affordable housing goals for Fannie                  off in earnest (See Chart A). The homeown-
                               Mae and Freddie Mac were designed to                        ership rates for African-Americans and His-
more than five                 expand the opportunity for homeownership                    panics have also dropped dramatically. For
                               to lower- and moderate-income families.                     African-American households, the rate now
percentage points              These policies, combined with a favorable                   stands at just 42.1 percent, and for Hispan-
                               low-interest rate environment as well as                    ics, the rate is 44.5 percent.11
below its high
                               other factors (including the emergence of
                                                                                           Absent a turbo-charged U.S. economy in
in 2004 and                    “subprime” mortgage products), led to the
                                                                                           which income growth is sustained over
                               addition of millions of American families to
                                                                                           a significant period of time, the histori-
comparable to the              the homeownership ranks. In fact, by the
                                                                                           cally high homeownership rates recorded
                               second quarter of 2004, the national home-
                                                                                           in the run-up to the Great Recession are
rate that existed              ownership rate had reached an historic high
                                                                                           unlikely to repeat themselves any time in
                               – 69.4 percent – and some observers were
between 1965                   contemplating a rate that would soon hit 70
                                                                                           the foreseeable future. More likely, we have
                                                                                           returned to the “old normal” where the
                               percent. During this period, the homeowner-
and 1995.                      ship rates for minority households soared:
                                                                                           national homeownership rate rarely crosses

      80                       By the second quarter of 2004, the rate for
                               African-Americans set a new record – 49.7
                                                                                           the 65-percent threshold. In fact, during
                                                                                           the 30-year period from 1965 to 1995, the
                                                                                           homeownership rate hovered between 63
                               percent – and one year later in 2005 the rate
                                                                                           percent and 65 percent with little variation
                               for Hispanic households reached 50 percent
                                                                                           outside these two boundaries.12
                               for the first time ever.

        Chart A

       Homeownership Rates for the United States: 1965 to the Present
       (Percent)                                                                                                                                 Recession

      7070
        69
                                       Homeownership Rate
                                       Seasonally Adjusted Homeownership Rate
        68
        66
        65
        64
        63
        62
             1965       1970         1975          1980          1985         1990          1995            2000            2005            2010          2014

      60     Source: Current Population Survey/Housing Vacancy Survey, Series H-111, U.S. Census Bureau, Washington, DC 20233.
             The seasonally adjusted homeownership rates are unavailable prior to 1980.

                    8                                                                      The Silent Housing Crisis: A Snapshot of Current and Future Conditions
Other analyses, however, are less optimistic                             ownership opportunities for many young
and suggest we are headed toward a “new                                  adults. The Consumer Financial Protection
normal” in which the national homeowner-                                 Bureau reports that student loan debt is
ship rate continues its decline and will fall                            approaching $1.2 trillion, an all-time high
well below 63 percent. For example, the                                  and the second highest form of consumer
Urban Institute projects that, by 2030, the                              debt behind mortgages.14 In 2013, nearly
homeownership rate could drop to as low as                               70 percent of graduating college seniors
60.3 percent and barely exceed 62 percent                                carried student loans, with the average
even under the most favorable scenario.13                                borrower owing more than $28,000.15 With
                                                                         so many young adults burdened with so
                                                                         much debt as they enter the job market and
Homeownership Headwinds                                                  start their careers, it is not surprising that in
                                                                         2014 the share of first-time homebuyers fell
Moderate- and lower-income families face
a number of powerful headwinds in today’s
homeownership market. In the short term,
more conservative underwriting standards
in the form of higher down payment and
tougher credit score requirements will
continue to make achieving homeownership
more difficult, even for those creditworthy
households who are prepared to assume
the obligations and risks that come with
owning a home.

To promote more mortgage lending, the
Federal Housing Administration (FHA) and
the Federal Housing Finance Agency (FHFA)
are attempting to reduce the use of “credit
overlays” by lenders who are concerned
about being held responsible by the agen-
cies for loan defaults when there are minor
defects in underwriting. To help expand
access to mortgage credit, the FHFA – along
with Fannie Mae and Freddie Mac – have
initiated low down payment programs for
first-time homebuyers. The FHA has also
proposed to reduce the insurance premiums
it charges, which have been cited as a major
homeownership obstacle for moderate- and
lower-income families. Even if successful,
these efforts are unlikely to unleash a wave
of new mortgage lending to those house-
holds with average credit records. In the
short term at least, caution will continue to
dominate the underwriting process.

Student loan debt is undermining home-

The Silent Housing Crisis: A Snapshot of Current and Future Conditions                                                       9
to its lowest point in nearly three decades,             (falling from $75,423 in 2000 to $67,065),
                                    according to a survey by the National                    and 8.7 percent lower for Hispanics (falling
The Consumer                        Association of Realtors.16 New regulatory                from $44,867 in 2000 to $40,963).19
                                    requirements, such as the “qualified mort-
                                                                                             In addition, since the late 1990s, household
Financial Protection                gage” (QM) rule that imposes a maximum
                                                                                             incomes at just about every income level -
                                    43 percent debt-to-income limit for a loan to
                                                                                             from the 10th percentile right on up to the
Bureau reports that                 achieve favorable QM status, will likely act
                                                                                             95th - have either stagnated or declined.20
                                    as a deterrent to would-be homeowners car-
student loan debt is                rying these sizable student loan burdens.17              Most problematic for the homeownership
                                                                                             market, the Great Recession has profoundly
approaching $1.2                    Perhaps the strongest homeownership
                                                                                             impacted the household incomes of those
                                    headwind of all is the accumulated impact
                                                                                             between the ages of 25 and 44, the group
trillion, an all-time               of more than a decade of household income
                                                                                             most likely to purchase a home for the first
                                    stagnation and decline. In 2013, the U.S.
high and the second                                                                          time. Between 2007 and 2012, the real
                                    median household income was $51,939, 8
                                                                                             median household incomes of those aged
                                    percent lower than the median income of
highest form of                     $56,436 in 2007 (on the eve of the Great
                                                                                             25 to 34 declined by 8 percent, while those
                                                                                             aged 35 to 44 experienced a 7 percent
                                    Recession) and 8.7 percent lower than the
consumer debt                       median household income peak of $56,895
                                                                                             decline.21 Today, the real incomes of young
                                                                                             and middle-aged households are at near-
                                    that occurred in 1999.18 As Chart B demon-
behind mortgages.                                                                            record lows.22
                                    strates, for households of all racial groups,
                                    real median income in inflation-adjusted                 The obvious point here is that without
                                    dollars has fallen from the peak levels that             adequate incomes potential homebuyers
                                    occurred prior to the 2001 recession: In                 will find it even more difficult to accumulate
                                    2013, household income was 5.6 percent                   enough cash for a down payment and be
                                    lower for whites (falling from $61,733 in                able to meet monthly mortgage payments,
                                    1999 to $58,270), 13.8 percent lower for Afri-           particularly if underwriting standards remain
                                    can-Americans (falling from $40,131 in 2000              as strict as they are today. (Of course,
                                    to $34,598), 11.1 percent lower for Asians               stagnating incomes have also made renting

                 Chart B

                Real Median Household Income by Race and Hispanic Origin: 1967 to 2013
                2013 Dollars

                80,000
                70,000                                                                                                                              $67,065
                                                                          Asian
                60,000                                                                                                                              $58,270
                50,000          White, not Hispanic                                                                                                 $51,939
                                 All Races                                                                                                          $40,963
                40,000
                                 Hispanic (any race)
                                                                                                                                                    $34,598
                30,000
                                     Black
   Recession    20,000
                10,000
                    0
                         1960       1965     1970      1975     1980      1985      1990       1995         2000         2005        2010    2013

                         Note: Median household income data are not available prior to 1967.
                         Source: U.S. Census Bureau, Current Population Survey, 1968 to 2014 Annual Social and Economic Supplements.

                    10                                                                       The Silent Housing Crisis: A Snapshot of Current and Future Conditions
more expensive for many families.) While C ha rt C
historically low interest rates, combined with
Generating a Surge in Renter Household Growth
sharply reduced home values following the
crash of the housing market, have helped Average Annual Growth in Renter Households (Millions)
make homeownership more affordable,23
1.4
these conditions are unlikely to persist. In
1.2
fact, home values are gradually rising in
many communities, in part because of a 1.0
reduction in the number of foreclosed and 0.8
distressed homes available for sale. In addi- 0.6
tion, interest rates are likely to head upward 0.4
as the full effects of the Federal Reserve’s
0.2
decision to terminate its “quantitative
easing” policy are felt in the bond markets. 0.0
1960s 1970s 1980s 1990s 2000s 2010s
Decennial Census HVS CPS
The Growing Number Source: Joint Center for Housing Studies of Harvard Uni-
of Renter Households versity, America’s Rental Housing: Evolving Markets and Needs
(2013). JCHS tabulations of US Census Bureau, Decennial
Censuses, Current Population Surveys (CPS), and Housing
The flip side of a declining homeownership Vacancy Surveys (HVS)
rate is the tremendous rise in demand for
rental housing that has occurred in recent households rent homes in properties with
years. According to the Current Population two to four units. The largest group of ...the Great
Survey sponsored by the Census Bureau renters, those living in buildings with five or
and the Bureau of Labor Statistics, more more units, accounts for nearly 18 million
Recession has
than one million new households were households.26
added annually to the rental ranks between
profoundly
2005 and 2013, a pace that was more than Families choose to rent their homes for a
twice the 400,000 annual average in any number of reasons – greater mobility, prox- impacted the
imity to jobs and transportation, the inability
decade since the 1960s. Other government
to come up with a down payment, and the
household
surveys show strong growth in the number
desire to forego responsibility for costly
of renter households in recent years (See incomes of those
Chart C).24 Many of these new renters are maintenance and upkeep are all commonly
from groups that have traditionally rented cited as reasons. But a major factor contrib- between the ages
– young adults, single persons, and low- uting to the decision to rent has traditionally
income families; but older households, been its affordability. With annual incomes of 25 and 44, the
many of whom were former homeowners, ($32,466) that are less than half that of the
have also contributed significantly to the typical homeowner household ($67,298), the group most likely
growth in the renter population.25 comparative affordability of rental housing
has been a critical reason why many renter to purchase a
Today, more than 43 million households rent households do not buy a home.27
their homes. These households represent home for the
more than 104 million individuals, account- Unfortunately, this affordability proposition
ing for approximately 33 percent of the has deeply eroded over the past decade first time.
U.S. population. Nearly 17 million of these and will only continue to deteriorate if the
households rent single-family residences status quo is preserved. One measure of the
or mobile homes, while close to 8 million increasing unaffordability of rental housing
The Silent Housing Crisis: A Snapshot of Current and Future Conditions 11can be found in HUD’s “worst case needs”*
report. According to the most recent report,
the number of renters with “worst case
needs” stood at 7.7 million in 2013, growing
an astounding 49 percent since 2008.28
Not surprisingly, rental cost burdens affect
While stagnating
those with the lowest incomes most acutely.
incomes and a According to Harvard’s Joint Center for
Housing Studies, in 2012, more than four
weak economy out of five households with incomes below
$15,000 (the equivalent one would earn
have helped fuel working full-time at the federal minimum
wage) paid more than 30 percent of their
today’s rental incomes for housing, while more than two- reported that, as of 2013, for every 100
thirds of these renters paid in excess of 50 “very low-income” renter households (those
affordability crisis, percent.29 These cost burdens force many with incomes between 30 and 50 percent
low-income renters to forego purchasing nutri- of the area median), there were just 65
a major contributing tious food, health care, and other essentials in affordable and available units.34 Competi-
factor has been the order to ensure there are sufficient funds avail- tion from higher-income households further
able to pay the rent each month.30 This situ- limits the supply of affordable rental homes
acute shortage of ation is all the more troubling since families that would otherwise be available to these
with children constitute the largest group of lowest-income households.
rental homes that households with severe rental cost burdens.31
The millions of foreclosed single-family
While stagnating incomes and a weak
are both affordable homes that have entered the rental market
economy have helped fuel today’s rental in recent years have helped respond to
and available to affordability crisis, a major contributing factor the increased demand for rentals. In fact,
has been the acute shortage of rental homes more than 3 million foreclosed single-family
those households that are both affordable and available to homes were converted to rental from 2007
those households with the lowest incomes. to 2011.35 New construction of multifamily
with the lowest properties (those with 5 units or more) has
The Urban Institute estimates that, for every
also picked up significantly in the wake of
incomes. 100 “extremely low-income” renter house-
the Great Recession with annual starts at
holds (those with incomes at or below 30
339,000 units as of December 2014, approx-
percent of the area median), there are just
imating the annual average in the period
29 affordable units available in the mar-
before the Great Recession.36
ketplace, translating into a total shortfall
of approximately 8.2 million units.32 HUD Despite these developments, it is virtu-
recently reported a slightly more favorable ally certain that supply will not catch up to
but still unacceptable situation, estimating increased demand in many local markets
that, as of 2013, there were 39 affordable absent a concerted effort by the public,
and available units for every 100 extremely private, and non-profit sectors to stimulate
low-income renter households.33 HUD also and support new production. In fact, just
* HUD defines “worst case needs” as very low-income renters with incomes below 50 percent of the Area
Median Income who do not receive government housing assistance and who either paid more than half
of their income for rent or lived in severely inadequate conditions, or who faced both of these challenges.
In its latest survey, HUD found that inadequate housing caused only three percent of “worst case needs,”
with lack of affordability being the overwhelming challenge for renters.
12 The Silent Housing Crisis: A Snapshot of Current and Future Conditionsto keep pace, the production of new units oper if certain affordable housing conditions
must not only help meet expected demand are met. Meeting these conditions, as well
but also replace those units no longer in use as complying with land-use, zoning and other
due to obsolescence, fire, and conversion to regulatory restrictions, can be complex, time-
market-rate condominiums. consuming, and costly. As a result, a signifi- Policymakers
cant level of subsidy is generally necessary
One major concern is the ongoing loss of
low-cost rentals, which tend to be older than
to make these developments economically must also contend
viable. In an era of fiscal austerity and budget
other rental homes. Although representing sequestration, unprecedented reductions with the tens of
a relatively small share of the total rental in federal housing subsidies have adversely
stock, 650,000 low-cost homes (many of impacted production of affordable housing. thousands of
them single-family and in properties with
fewer than five units) that rented for less Policymakers must also contend with the multifamily units
than $400 per month accounted for more tens of thousands of multifamily units
than a one-third of the total rentals removed that become obsolete each year and are that become
from the market from 2001 to 2011.37 removed from the market. Complicating
matters further is the fact that the “afford- obsolete each
In addition, supplying multifamily housing ability” restrictions on some 2 million gov-
for our nation’s lowest-income families is ernment-subsidized affordable rental homes
year and are
extremely challenging because of the sub- are expected to expire at some point over
stantial gap between development costs and
removed from
the next decade. While many of these units
what these families can afford to pay in rent. will remain in the affordable stock, others the market.
In practice, most affordable housing develop- (particularly in those in communities where
ments depend upon a number of different rental demand is strong) will likely covert
subsidized financing streams, both equity to market-rate properties with considerably
and debt, that are only available to a devel- higher rents.38
The Silent Housing Crisis: A Snapshot of Current and Future Conditions 13Demographic Trends
In the absence of remedial action, today’s
high rental cost burdens – triggered by a
weak economy, the lack of household income
growth, higher demand as millions of house-
holds have transitioned from homeowner-
ship, and the severe shortage of affordable
...few groups and available homes for our nation’s lowest-
income families – may be further exacerbated
suffered more by new pressures stemming from the chang-
ing demographics of America.39
from the economic
The key elements of these
downturn than changing demographics are: demand will be rental during the decade
of 2010 to 2019, while 56 percent will be
young adults n New household formation by rental during the decade of the 2020s. To
young adults; put these figures in perspective, the mix
whose median between ownership and rental demand was
n The increasing diversity of the reversed during the two previous decades:
incomes have U.S. population; 72 percent of new housing demand was for
ownership housing during the 1990s and 55
dropped to levels n Higher expected annual immigration
percent during the 2000s (See Chart D).40
levels; and
not seen since
n The aging of the 78 million
the 1970s. Baby Boomers. New Household
Together, these demographic trends will Formation by Millennials
all converge in a way that substantially The Great Recession and the weak recovery
increases the already-strong demand for that followed put a tremendous damper on
rental housing. In fact, according to the the formation of households by our nation’s
Urban Institute, 62 percent of new housing young adults. With the nation’s economy in
disarray, millions of Millennials opted to sit
Cha r t D on the housing sidelines, many living with
Most New Housing Demand will be Rental their parents or “doubling up” with room-
mates. From 2000 to 2007, the number of
Annual Household Growth (Millions)
new households formed each year aver-
1.6 aged approximately 1.2 million. Yet, as the
economy faltered, annual new household
1.4
growth declined dramatically, with estimates
Renters 1.2 28% of new households averaging between
1.0 600,000 and 800,000 during the years
0.8 45% 2007 to 2013.41 Much of the decline in new
62% 56%
Owners household growth is due to the reluctance of
0.6
72% Millennials to strike out on their own in the
0.4
55% housing market. Even today, with a stronger
0.2 38% 44%
economy, new household formation by Mil-
0.0 lennials remains relatively weak: half of those
1990s 2000s 2010s 2020s
aged 20 to 24 and one-fifth of those aged
Source: Urban Institute 25 to 29 still live with their parents.42
14 The Silent Housing Crisis: A Snapshot of Current and Future ConditionsThe huge pent-up demand represented by C ha rt E
the Millennials offers great potential for the Race Trends, 2000-2030
housing market. If the economy continues
Distribution of age and race from 2020 to 2030.
to improve, household formation among
(assume average rates of birth, death, and migration)
Millennials – many of whom have delayed
(Millions) Race
marriage and remain childless – will likely
increase as well. But few groups suffered
more from the economic downturn than
200M
• • • • White
young adults whose median incomes
have dropped to levels not seen since the Hispanic
1970s. As they form households, many 100M
will initially choose to rent, often in urban • •
• •
• • •
•
Black
areas close to jobs and other opportuni-
ties, thereby increasing demand for the • • •
0.0 Other
existing rental stock and putting additional 2000 2010 2020 2030
pressure on the need for more affordable
Source: Mapping America’s Future / urban.org / Urban Institute
rental housing. We are already seeing the
effect of this demand in the 25 largest the U.S. population will grow from more
rental markets, where rents have increased, than 320 million today to nearly 334 million
sometimes substantially, over the past year in 2020 and more than 358 million by 2030
(See Table 1, page 23). (assuming average rates of birth, death, and
migration).43
During this period, America will become
The Increasing
increasingly diverse with minorities
Diversity of America expected to constitute 40 percent of the
Unlike many industrialized nations, the U.S. population by 2020 and exceeding 44
population of the United States is poised percent by 2030.44 The rapid and substantial
to increase significantly in the coming growth in the number of Hispanics will be a
decades. The Urban Institute projects that big part of this story (See Chart E).
Photo: The Bozzuto Group
The Silent Housing Crisis: A Snapshot of Current and Future Conditions 15Minorities will be the driving force behind
new household formation over the coming
decades. According to the Urban Institute,
from 2010 to 2020, 8.9 million net new
minority households will form, accounting for
77 percent of projected household growth
during this period. From 2020 to 2030, an
Minorities will additional 9.1 million net new minority house-
holds will form, accounting for a staggering
be the driving 88 percent of projected household growth
in this decade.45 In short, the future vital-
force behind ity of the housing market will depend upon
new household meeting the housing needs of these new
minority households (See Chart F).
formation over the Unfortunately, the median incomes of
was also very low – just $13,700, about ten
times less than that of whites (See Chart
African-American and Hispanic families
coming decades. continue to lag significantly behind those
G).46 While the Great Recession negatively
impacted the net wealth of all racial groups,
of their white counterparts. Remarkably,
the subsequent decline in wealth has been
in 2012, the median income of a minor-
most pronounced among African-American
ity household aged 25 to 34 was $20,000
and Hispanic families, many of whom lost a
below that of a white household of the same
major asset – their home – following the col-
age. In addition, minority household wealth
lapse of the homeownership market.
is extremely low. According to a recent anal-
ysis by the Pew Research Center, in 2013, Consistent with these findings, the median
the median net worth of an African-Ameri- net wealth of minority renters is particularly
can household was just $11,000, nearly 13 low. Harvard’s Joint Center for Housing
times less than the $141,900 median net Studies calculated that, in 2010, the median
worth of white households. In 2013, the net worth of African-American renters was
median net worth of Hispanic households just $2,100, and was $4,500 for Hispanic
C har t F
Housing Demand will Increase, Largely Driven by Minorities
Net New Households (Millions)
Projected 14
Household Growth, 12 100%
2010-2020 100%
10 88%
77%
8
6 46%
39%
Projected
4 23%
Household Growth, 19% 18% 24%
12% 18%
2020-2030 2
2.7 1.3 4.6 4.8 2.2 1.9 2.1 2.5 8.9 9.1 11.6 10.4
0
White Hispanic Black, Other, Total Minority Total
Non-Hispanic Non-Hispanic
Source: Urban Institute
16 The Silent Housing Crisis: A Snapshot of Current and Future ConditionsChart G
Racial, Ethnic Wealth Gaps Have Grown Since Great Recession
Median Net Worth of Households, in 2013 Dollars
White Net Worth White Net Worth
13x Greater 10x Greater
1,000,000 1,000,000
$192,000 $192,000
$141,900 $141,900
• • • • • •
•• • • • • •• • • • •
White White
100,000 • 100,000 •
8x 17x 7x 7x 6x 6x 7x 10x 8x 13x 11x 14x 10x 6x 10x 11x 9x 8x 9x 10x
• • • • • • • • • • • • • •
10,000 • $19,200
• 10,000
• • •
Black • $11,000 Hispanic
$23,600 $13,700
Great Recession Great Recession
1,000 1,000
‘83 ‘86 ‘89 ‘92 ‘95 ‘98 ‘01 ‘04 ‘07 ‘10 ‘13 ‘83 ‘86 ‘89 ‘92 ‘95 ‘98 ‘01 ‘04 ‘07 ‘10 ‘13
Source: Pew Research Center, “Wealth inequality has widened along racial, ethnic lines since end of Great Recession”
(December 12, 2014). Note: Blacks and whites include only non-Hispanics. Hispanics are of any race.
renters. Cash savings accounted for less sion and household formation among the
than $1,000 of this new worth, “leaving all of foreign-born fell as the economy faltered
these renters without much cushion against and employment opportunities dried up. In
emergencies, let alone funds for a down fact, in 2009 and 2010, the number of for-
payment on a home.”47 eign-born households in the U.S. registered
a net decline.49 More recently, however,
In the coming years, the homeownership
prospects for many minority families, who immigration to the U.S. has picked up and
will constitute an increasingly larger share of the foreign-born share of overall household
the U.S. population, will be severely limited. growth has expanded to nearly 40 percent.50
While desiring homeownership, many will If net annual immigration returns to the
simply not have the resources in the form of levels recorded prior to the Great Reces-
income and wealth to meet mortgage down sion – ranging from 900,000 to 1.2 million
payment and other requirements. As a result, between 2000 and 2006 – this trend will
renting will be their only housing option. have a significant impact on the housing
market and will certainly spur increased
demand for rental housing. Soon after their
Higher Annual Immigration Levels arrival to the United States, foreign-born
The foreign-born population in the United households often seek out multifamily rental
States has traditionally been a strong source housing in high-density areas near jobs and
of housing demand. From 2001 to 2007, other opportunities.51 Many are attracted to
foreign-born households accounted for “gateway cities” such as Houston, Miami,
30 percent of overall household growth.48 Los Angeles and New York where they can
However, immigration to the U.S. slowed live close to others who have also settled
considerably as a result of the Great Reces- there from their home countries.52
The Silent Housing Crisis: A Snapshot of Current and Future Conditions 17The Aging of the Baby Boomers
The aging of the Baby Boomers (those born
between 1946 and 1964 and one of the
Photo: The Bozzuto Group
largest demographic cohorts in American
history) will have a major impact on the
future housing market. By 2030, the number
Housing of Americans aged 65 or older is expected
to increase to nearly 73 million and those
affordability will
over 85 will near nine million. By 2040, the
also continue to number of Americans aged 65 or older will
of total rental household growth.54 Many will
approach the 80-million mark (See Chart
be a challenge H). At the same time, older Americans will likely seek rental homes close to transporta-
constitute an increasingly larger share of the tion options and in communities where other
for seniors in the total U.S. population. seniors live. Ensuring these rental homes
have the necessary structural features and
coming years. Most seniors will seek to “age in place” access to services to support senior living
as long as possible in their own homes, will be a significant concern.
but many homes lack the basic structural
features that can support safe, independent Housing affordability will also continue to
living.53 Other seniors will seek to down- be a challenge for seniors in the coming
size to smaller rentals injecting additional years. Today, among those aged 65 and
demand into the rental market. According to over, about half of all renters and half of
Harvard’s Joint Center for Housing Studies, those homeowners still holding mortgages
the number of renters over the age of 65 pay thirty percent or more of their incomes
will increase by 2.2 million over the coming just to cover housing costs.55 In addition, 30
decade and account for a significant share percent of senior renters and 23 percent of
senior owners with mortgages have housing
Chart H cost burdens that exceed 50 percent of their
U.S. Population Aged 65 and Older incomes.56 As minorities become an increas-
ingly larger share of the overall U.S. popula-
Annual Household Growth (Millions) tion, these cost burdens among the elderly
are likely to intensify and grow.
80
Substantial housing costs will affect the
70
ability of seniors to access and finance long-
65 years 60
term services and supports (LTSS). An esti-
and older
50 mated seventy percent of those who reach
40 age 65 will eventually require some form of
30 LTSS to assist with the activities of daily living
85 years
such as bathing, dressing, and medication
and older 20
management.57 The fact that homeowners
10
are carrying larger mortgage balances later
0 into the senior years will also affect the ability
2000 2010 2020 2030 2040
of seniors to live independently and finance
Source: 2000 and 2010 counts from U.S. Census Bureau, “Summary File their retirement needs (See Chart I). Adding to
1, Matrices DP-1. Profile of General Demographic Characteristics: 2000
and 2010.” Decennial Census ( Washington, D.C.: 2001 and 2012); projec-
these concerns is the fact that large numbers
tions from U.S. Census Bureau, “Table 2, Projections of the Population by of seniors and those approaching retirement
Selected Age Groups and Sex for the United States: 2015 to 2060.” 2012
National Population Projections: Summary Tables. have little or no personal savings.58
18 The Silent Housing Crisis: A Snapshot of Current and Future ConditionsChart I
Households Are Carrying Much More Mortgage Debt into Their Retirement Years
Share of Owners with Mortgage Debt by Age Group Average Loan-to-Value Ratio for Owners with Mortgages by
(Percent) Age Group (Percent)
50-64 65 and Over
80 60
70
50
60
40
50
40 30
30
20
20
10 10
0 0
1992 1998 2004 2007 2010 1992 1998 2004 2007 2010
Source: Joint Center for Housing Studies of Harvard University, Housing America’s Older Adults (2014).
Based on JCHS tabulations of Federal Reserve Board, Surveys of Consumer Finances.
Estimates include only owner households with mortgages on primary residences.
The Silent Housing Crisis: A Snapshot of Current and Future Conditions 19Conclusion
Today, we find ourselves in an unprec- forming America will only magnify these
Fashioning a edented situation: Millions of families are challenges in the years ahead and strain a
shut out of the homeownership market housing system that is already overmatched.
new federal because they are unable to qualify for a Fashioning a new federal housing policy
housing policy mortgage. For many, accumulating the nec- that effectively responds to both current
essary funds for a down payment or to make and future conditions in the housing market
that effectively the monthly mortgage payment are the is an urgent national imperative. Ensuring
major obstacles, but higher credit-score and that Americans have access to decent,
responds to other requirements also serve as barriers. affordable housing is critical to our nation’s
At the same time, a tremendous infusion of economic growth and future prosperity. We
both current and rental demand has sent rents soaring. The can no longer afford to stand by as housing
future conditions number of renter households who are now becomes a cause of distress for more and
severely cost-burdened has reached new more of our fellow citizens rather than the
in the housing highs. The demographic trends now trans- source of stability it should be.
market is an
Photo: The Bozzuto Group
urgent national
imperative.
20 The Silent Housing Crisis: A Snapshot of Current and Future ConditionsChart E Rent Trends in the 25 Largest Rental Markets Median rent for Y-o-Y % change Median rent for 2-bedroom as share of # U.S. Metro in rents, Dec 2014 2-bedroom, Dec 2014 average local wage 1 Miami, FL 7.4% 2300 57% 2 Los Angeles, CA 7.0% 2450 53% 3 New York, NY 9.3% 3200 52% 4 Oakland, CA 11.6% 2400 45% 5 San Francisco, CA 10.8% 3600 45% 6 Riverside-San Bernardino, CA 5.0% 1500 44% 7 Orange County, CA 7.4% 2050 44% 8 San Diego, CA 4.1% 1950 42% 9 Cambridge-Newton-Framingham, MA 6.8% 2250 39% 10 Boston, MA 4.3% 2300 39% 11 Newark, NJ 7.1% 2100 37% 12 Chicago, IL 6.0% 1750 37% 13 Baltimore, MD 8.7% 1550 35% 14 Washington, DC 2.9% 2000 34% 15 Denver, CO 14.1% 1500 31% 16 Philadelphia, PA 7.5% 1500 31% 17 Seattle, WA 6.1% 1700 31% 18 Portland, OR 8.8% 1300 30% 19 Tampa-St. Petersburg, FL 7.5% 1100 29% 20 Dallas, TX 5.4% 1400 29% 21 Atlanta, GA 5.9% 1250 28% 22 Minneapolis-St. Paul, MN 3.2% 1300 28% 23 Houston, TX 3.1% 1400 27% 24 Phoenix, AZ 8.6% 1050 26% 25 St. Louis, MO 8.5% 900 22% Source: Trulia Rent Monitor The Silent Housing Crisis: A Snapshot of Current and Future Conditions 21
Endnotes
       1    Joint Center for Housing Studies of Harvard Univer-     13   Laurie Goodman and Rolf Pendall, Changing
            sity, State of the Nation’s Housing 2014 (2014), p.          Demographics: Implications for the Housing
            27. A housing unit is generally considered “afford-          Market, presentation to the J. Ronald Terwil-
            able” if monthly housing costs do not exceed 30              liger Foundation for Housing America’s Families,
            percent of income.                                           January 7, 2015, Table 4: Homeownership rates by
       2    See Daniel McCue, The Burden of High Housing                 race/ethnicity.
            Costs, Cascade (No. 86, Winter 2015), Federal           14   Rohit Chopra, Consumer Financial Protection
            Reserve Bank of Philadelphia.                                Bureau, Student Debt Swells, Federal Loans Now
       3    Ibid.                                                        Top a Trillion (July 17, 2013).

       4    See Housing Assistance Matters Initiative,              15   The Project on Student Loan Debt, Institute for
            Mapping America’s Rental Housing Crisis, Urban               College Access and Success, State by State Data,
            Institute (accessed on February 2, 2015), available          available here: http://projectonstudentdebt.org/
            here: http://www.urban.org/housingaffordabil-                state_by_state-data.php.
            ity. The U.S. Department of Housing and Urban           16   National Association of Realtors, NAR Annual
            Development defines an “extremely low-income                 Survey Reveals Notable Decline in First-time Buyers
            household” as one making 30 percent or less of               (November 3, 2014), available here: http://www.
            the area median income.                                      realtor.org/news-releases/2014/11/nar-annual-
       5    In 2011, approximately 5 million out of a total of 27        survey-reveals-notable-decline-in-first-time-buyers.
            million renter households with incomes below 80         17   See Scott Stucky, Burden of Student Loans Stifles
            percent of the area median income, the eligibility           the Housing Market, American Banker (March 24,
            threshold for new admissions to rental assistance            2014).
            through the U.S. Department of Housing and              18   Carmen DeNavas-Walt and Bernadette D. Proctor,
            Urban Development, reported receiving such assis-            U.S. Census Bureau, Current Population Reports,
            tance.                                                       P60-249, Income and Poverty in the United States:
       6    See U.S. Census Bureau, Residential Vacancies                2013, U.S. Government Printing Office, Washing-
            and Homeownership in the Fourth Quarter 2014                 ton, DC, 2014, 7.
            (January 29, 2015); see also Homeownership hits         19   Ibid. at 5.
            20-year low in 4Q14, HousingWire (January 29,
                                                                    20   Judgment based on information contained in
            2015).
                                                                         Income and Poverty in the United States: 2013,
       7    See CoreLogic Reports 46,000 Foreclosures                    Table A-2; see also R.A., Stagnation for Everyone,
            Completed in September (October 29, 2014),                   The Economist (September 17, 2013), available
            available here: http://www.multivu.com/players/              here: http://www.economist.com/blogs/freeex-
            English/71280520-corelogic-national-foreclosure-             change/2013/09/incomes.
            report-september/.
                                                                    21   Joint Center for Housing Studies of Harvard Univer-
       8    National Association of Realtors, NAR Annual                 sity, The State of the Nation’s Housing 2014 (2014),
            Survey Reveals Notable Decline in First-time Buyers          3.
            (November 3, 2014), available here: http://www.
                                                                    22   Ibid. at 15. A recent study by Fannie Mae shows
            realtor.org/news-releases/2014/11/nar-annual-
                                                                         that the homeownership rate even for “prime”
            survey-reveals-notable-decline-in-first-time-buyers.
                                                                         first-time home-buying candidates (households
       9    Laurie Goodman and Rolf Pendall, Changing                    with a median age ranging from 30 to 32, college-
            Demographics: Implications for the Housing                   educated, with incomes exceeding $95,000 in
            Market, presentation to the J. Ronald Terwil-                2012 dollars, and consisting of married couples
            liger Foundation for Housing America’s Families,             with minor children) fell by 8.6 percentage points
            January 7, 2015, Slide 6.                                    between the housing market peak in 2006 and
       10   Ibid. at Slide 5.                                            2012. Fannie Mae, Upper-Income, Educated,
       11   U.S. Census Bureau, Residential Vacancies and                Married with Children, and Still Not Buying: Declin-
            Homeownership in the Fourth Quarter 2014                     ing Homeownership among “Prime” First-Time
            (January 29, 2015), Table 7.                                 Home Buying Candidates, Fannie Mae Housing
                                                                         Insights (August 18, 2014). In addition to student
       12   See U.S. Census Bureau, Housing Vacancies and                loan debt and tighter underwriting standards,
            Homeownership (CPS/HVS), Historical Tables,                  the study suggests that lowered expectations
            Table 14. Quarterly Homeownership Rates for the              about future income gains, fear of future job loss,
            U.S. and Regions: 1965 to the Present, available             and changing assessments of the future invest-
            here: http://www.census.gov/housing/hvs/data/                ment returns on homeownership have negatively
            histtabs.html.                                               impacted the homeownership rate among these
                                                                         “prime” first-time home-buying candidates.

  22                                                                The Silent Housing Crisis: A Snapshot of Current and Future Conditions
23 See National Association of Realtors, Housing 40 Laurie Goodman and Rolf Pendall, Changing
Affordability Index, available here: http://www. Demographics: Implications for the Housing
realtor.org/sites/default/files/reports/2015/embar- Market, presentation to the J. Ronald Terwil-
goes/hai-11-2014/hai-11-2014-housing-affordability- liger Foundation for Housing America’s Families,
index-01-09-2015.pdf. January 7, 2015, Slide 6.
24 The State of the Nation’s Housing 2014, 4, 22. 41 State of the Nation’s Housing 2014, 12-13.
25 Ibid. at 22. 42 Ibid. at 13.
26 This information was taken from National Mul- 43 See The Urban Institute, Mapping America’s
tifamily Housing Council, Quick Facts: Resident Futures, available here: http://datatools.urban.org/
Demographics (http://www.nmhc.org/Content. features/mapping-americas-futures/#map.
aspx?id=4708) (accessed on February 3, 2015). 44 Ibid. See the section entitled “Age and Race
27 American Community Survey, Median Household Trends, 2000-2030.”
Income the Past 12 Months (in 2013 Inflation- 45 Laurie Goodman and Rolf Pendall, Changing
Adjusted Dollars) by Tenure, 2009-2013 American Demographics: Implications for the Housing
Community Survey 5-Year Estimates, U.S. Census Market, presentation to the J. Ronald Terwil-
Bureau. liger Foundation for Housing America’s Families,
28 U.S. Department of Housing and Urban Develop- January 7, 2015, Slide 5.
ment, Office of Policy Development and Research, 46 Rakesh Kochnar and Richard Fry, Wealth inequality
Worst Case Housing Needs: 2015 Report to Con- has widened along racial, ethnic lines since end of
gress, Executive Summary, released on February Great Recession, Pew Research Center (December
4, 2015. This report did note, however, a modest 12, 2014), available here: http://www.pewre-
drop in “worst case needs” from 2011 to 2013, search.org/fact-tank/2014/12/12/racial-wealth-gaps-
largely the result of higher renter incomes stem- great-recession/.
ming from an improving economy.
47 Joint Center for Housing Studies of Harvard Uni-
29 State of the Nation’s Housing 2014, 27. versity, State of the Nation’s Housing 2013 (2013),
30 Ibid. at 32. 14.
31 Barry Steffen et al., Worst Case Housing Needs 48 Ibid. at 13.
2011: Report to Congress, U.S. Department of 49 Ibid.
Housing and Urban Development (August 2013),
50 State of the Nation’s Housing 2014, 13. Immigration
5.
to the U.S. did decline modestly in 2013 after three
32 See Housing Assistance Matters Initiative, years of growth. See Neil Shah, Fewer Immigrants
Mapping America’s Rental Housing Crisis, Urban Came to the U.S. Last Year, Wall Street Journal,
Institute (accessed on February 2, 2015), available January 23, 2014.
here: http://www.urban.org/housingaffordability.
51 Demographic Challenges and Opportunities for
33 See Worst Case Housing Needs: 2015 Report to U.S. Housing Markets, 37, 46; see also Housing
Congress, Executive Summary, released on Febru- America’s Future: New Directions for National
ary 4, 2015. Policy, 20.
34 Ibid. 52 Ibid.
35 State of the Nation’s Housing 2014, 18. 53 Henry Cisneros, “New Visions for Aging in Place,”
36 U.S. Department of Commerce, New Residential in Independent for Life: Home and Neighborhoods
Construction in November 2014 (December 16, for an Aging America, ed. Henry Cisneros, Marga-
2014), available here: http://www.census.gov/ ret Dyer-Chamberlain, and Jane Hickie, Stanford
construction/nrc/pdf/newresconst.pdf. Center on Longevity (2012), 8.
37 America’s Rental Housing: Evolving Markets and 54 State of the Nation’s Housing 2014, 26.
Needs, 19. 55 Joint Center for Housing Studies of Harvard Uni-
38 See D. McCue, The Burden of High Housing Costs. versity, Housing America’s Older Adults: Meeting
39 For a good overview of these changing demo- the Needs of an Aging Population (2014), 3.
graphics, see State of the Nation’s Housing 2014, 56 Ibid.
12-16; Bipartisan Policy Center, Housing America’s 57 See Henry Cisneros, The Bipartisan Policy Center,
Future: New Directions for National Policy (Febru- The Health and Housing Nexus (December 8,
ary 2013), 17-20; and Rolf Pendall et al., The Urban 2014), available here: http://bipartisanpolicy.org/
Institute, Demographic Challenges and Opportuni- blog/the-health-and-housing-nexus/.
ties for U.S. Housing Markets (2011).
58 Polyana da Costa, Bankrate.com, Survey: 36
percent not saving for retirement, (August 18,
2014), available here: http://www.bankrate.com/
finance/consumer-index/survey-36-percent-not-
saving-for-retirement.aspx.
The Silent Housing Crisis: A Snapshot of Current and Future Conditions 23j. R O N A L D T ERW I L L I G ER
F O U N D A T I O N
for
H O U S I N G A M E R I C A’ S F A M I L I E S
1922 Tysons Trace Drive
Vienna, VA 22182
202.470.3389
For more information please contact:
Meghan C. Patenaude
Senior Policy Analyst
J. Ronald Terwilliger Foundation for Housing America’s Families
Meghan.Patenaude@JRTHOUSING.orgC ha r t B
Real Median Household Income by Race and Hispanic Origin: 1967 to 2013
80,000
70,000 $67,065
Asian
60,000 $58,270
50,000 White, not Hispanic $51,939
2013 All Races $40,963
40,000
Dollars Hispanic (any race)
$34,598
30,000
Black
20,000
10,000
0
1960 1965 1970 1975 1980 1985 1990 1995 2000 2005 2010 2013 Recession
Note: Median household income data are not available prior to 1967.
Source: U.S. Census Bureau, Current Population Survey, 1968 to 2014 Annual Social and Economic Supplements.
Cha r t C
Generating a Surge in Renter Household Growth
Average Annual Growth in Renter Households (Millions) C ha rt D
1.4
Most New Housing Demand will be Rental
1.2 Annual Household Growth (Millions)
1.0 1.6
0.8 1.4
0.6 1.2
Renters 28%
0.4 1.0
0.2 0.8 45%
62% 56%
0.0 Owners
0.6
1960s 1970s 1980s 1990s 2000s 2010s 72%
0.4
Decennial Census HVS CPS 55%
0.2 38% 44%
Note: Renter growth in 2013 in the HVS was calculated by averag-
ing the number of renters in the first and second quarters of the year
0.0
and subtracting the average number of renters in the first and second 1990s 2000s 2010s 2020s
quarters of 2012.
Source: JCHS tabulations of US Census Bureau, Decennial Censuses, Source: Urban Institute
Current Population Surveys (CPS), and Housing Vacancy Surveys (HVSChar t G
Housing Demand will Increase, Largely Driven by Minorites
Net New Households (Millions) Projected
Household
16 Growth,
14 2010-2020
12 100%
100%
10
77% 88%
Projected
8
Household
6
39% 46% Growth,
4 23% 2020-2030
12%
19% 18% 18% 24%
2
2.7 1.3 4.6 4.8 2.2 1.9 2.1 2.5 8.9 9.1 11.6 10.4
0
White Hispanic Black, Other, Total Minority Total
Non-Hispanic Non-Hispanic
Source: Urban Institute
Chart F
Race Trends, 2000-2030
Distribution of age and race from 2020 to 2030.
(assume average rates of birth, death, and migration) Race
(Millions)
White
200M
• • • •
Hispanic
100M Black
• •
• •
• • •
•
• • • Other
0.0
2000 2010 2020 2030
Source: Mapping America’s Future / urban.org / Urban Institute
28%• • • • •
• • •
• •
•
• •
Chart H
Chart H
Racial, Ethnic Wealth Gaps Have Grown Since Great Recession
Median Net Worth of Households, in 2013 Dollars
White Net Worth White Net Worth
13x Greater 10x Greater
1,000,000 1,000,000
$192,000 $192,000
$141,900 $141,900
• • • • • •
•• • • • • •• • • • •
White White
100,000 • 100,000 •
8x 17x 7x 7x 6x 6x 7x 10x 8x 13x 11x 14x 10x 6x 10x 11x 9x 8x 9x 10x
• • • • • • • • • • • • • •
10,000 • $19,200
• 10,000
• • •
Black • $11,000 Hispanic
$23,600 $13,700
Great Recession Great Recession
1,0000 1,0000
‘83 ‘86 ‘89 ‘92 ‘95 ‘98 ‘01 ‘04 ‘07 ‘10 ‘13 ‘83 ‘86 ‘89 ‘92 ‘95 ‘98 ‘01 ‘04 ‘07 ‘10 ‘13
Notes: Blacks and whites include only non-Hispanics. Hispanics are of any race. Chart scale is logarithmic; each gridline
is ten times greater than the gridline below it. Great Recession began Dec. ‘07 and ended June ‘09.
Source: Pew Research Center tabulations of Survey of Consumer Finances public-use data
C har t I
U.S. Population Aged 65 and Older
Annual Household Growth (Millions)
80,000
70,000
65 years
60,000 and older
50,000
40,000
85 years
30,000
and older
20,000
10.000
0
2000 2010 2020 2030 2040
Source: 2000 and 2010 counts from U.S. Census Bureau, “Summary File 1, Matrices
DP-1. Profile of General Demographic Characteristics: 2000 and 2010.” Decennial Census
( Washington, D.C.: 2001 and 2012); projections from U.S. Census Burear, “Table 2,
Projections of the Population by Selected Age Groups and Sex for the United States:
2015 to 2060.” 2012 National Population Projections: Summary Tables.You can also read