THE STATE OF THE GLOBAL EDUCATION CRISIS: A PATH TO RECOVERY - UNICEF
←
→
Page content transcription
If your browser does not render page correctly, please read the page content below
THE STATE OF THE
GLOBAL EDUCATION CRISIS:
A PATH TO REC OVERY
A J O I N T U N E S C O , U N I C E F, A N D W O R L D B A N K R E P O R T
THE STATE OF THE
GLOBAL EDUCATION CRISIS:
             A PATH TO REC OVERY

    A J O I N T U N E S C O, U N I C E F, A N D W O RL D B A N K RE P O RT
© 2021 International Bank for Reconstruction and Development / The World Bank, UNESCO and UNICEF

UNESCO ISBN: 978-92-3-100491-9

This work is a co-publication of The World Bank, UNESCO and UNICEF.

The findings, interpretations, and conclusions expressed in this work do not necessarily reflect the views of The World Bank, its Board
of Executive Directors, or the governments they represent, or those of UNESCO or UNICEF.

The World Bank, UNESCO and UNICEF do not guarantee the accuracy, completeness, or currency of the data included in this
work and do not assume responsibility for any errors, omissions, or discrepancies in the information, or liability with respect to the
use of or failure to use the information, methods, processes, or conclusions set forth. The boundaries, colors, denominations, and
other information shown on any map in this work do not imply any judgment on the part of The World Bank, UNESCO, or UNICEF
concerning the legal status of any territory or the endorsement or acceptance of such boundaries.

Nothing herein shall constitute or be construed or considered to be a limitation upon or waiver of the privileges and immunities of The
World Bank, all of which are specifically reserved.

Rights and Permissions

This publication is available in Open Access under the Creative Commons Attribution-ShareAlike 3.0 IGO (CC-BY-SA 3.0 IGO) license
(http://creativecommons.org/licenses/by-sa/3.0/igo/). Under this license, you are free to copy, distribute, transmit, and adapt this work,
including for commercial purposes, under the following conditions:

Attribution—Please cite this publication as follows: The World Bank, UNESCO and UNICEF (2021). The State of the Global Education
Crisis: A Path to Recovery. Washington D.C., Paris, New York: The World Bank, UNESCO, and UNICEF. Please cite the data as follows:
The World Bank, UNESCO and UNICEF (2021). The State of the Global Education Crisis: A Path to Recovery. Washington D.C., Paris,
New York: The World Bank, UNESCO, and UNICEF.

Share Alike - If you remix, transform, or build upon the material, you must distribute your contributions under the same license as
the original.

Translations—If you create a translation of this work, please add the following disclaimer along with the attribution: This translation
was not created by The World Bank, UNESCO or UNICEF and should not be considered an official World Bank, UNESCO or UNICEF
translation. The World Bank, UNESCO and UNICEF shall not be liable for any content or error in this translation.

Adaptations—If you create an adaptation of this work, please add the following disclaimer along with the attribution: This is an
adaptation of an original work by The World Bank, UNESCO and UNICEF . Views and opinions expressed in the adaptation are the sole
responsibility of the author or authors of the adaptation and are not endorsed by The World Bank, UNESCO and UNICEF .

UNICEF Photographs—UNICEF photographs are copyrighted and are not to be reproduced in any medium without obtaining prior
written permission from UNICEF.. Requests for permission to reproduce UNICEF photographs should be addressed to UNICEF,
Division of Communication, 3 United Nations Plaza, New York 10017, USA (email: nyhqdoc.permit@unicef.org).

Third-party content—The World Bank, UNESCO and UNICEF do not necessarily own each component of the content contained within the
work. The World Bank, UNESCO and UNICEF therefore do not warrant that the use of any third-party-owned individual component or part
contained in the work will not infringe on the rights of those third parties. The risk of claims resulting from such infringement rests solely with
you. If you wish to re-use a component of the work, it is your responsibility to determine whether permission is needed for that re-use and to
obtain permission from the copyright owner. Examples of components can include, but are not limited to, tables, figures, or images.

All queries on rights and licenses, including subsidiary rights, should be addressed to World Bank Publications, The World Bank
Group, 1818 H Street NW, Washington, DC 20433, USA; fax: 202-522-2625; e-mail: pubrights@worldbank.org.

Designed by Big Yellow Taxi, Inc.

Cover photos (top to bottom, left to right): © UNICEF/UN0517129/Panjwani; © UNICEF/UN0360754/; © UNICEF/UN0506301/Ijazah;
© UNICEF/UNI366076/Bos; © UNICEF/UN0419388/Dejongh; © UNICEF/UNI304636/Ma

 2   THE STATE OF THE GLOBAL EDUCATION CRISIS: A PATH TO RECOVERY
© UNIC EF/U N0520818/ WILANDER

ACKNOWLEDGEMENTS                                                Ellinore Ahlgren, Marie-Helene Cloutier), under the
First and foremost, the United Nations Educational,             overall guidance of Stefania Giannini, Robert Jenkins,
Scientific and Cultural Organization (UNESCO), the              and Jaime Saavedra. The team thanks Omar Arias,
United Nations Children’s Fund (UNICEF), and the World          Ciro Avitabile, Luis Crouch, Laura Gregory, Shwetlena
Bank would like to thank all the ministries of education,       Sabarwal, Yevgeniya Savchenko, Norbert Schady, Lars
teachers, and families that have worked tirelessly to protect   Sondergaard, Nobuyuki Tanaka, Alfonso Sanchez, and
the learning of millions of students during the pandemic.       Michael Crawford for their inputs and comments. The
                                                                support of communication colleagues Cynthia Guttman,
This report was prepared by a core team consisting of           Ann Marie Wilcock, Kristyn Schrader-King, and Stefano
the following colleagues: UNESCO (Borhene Chakroun,             De Cupis was greatly appreciated. Production assistance
Gwang-Chol Chang), UNICEF Headquarters (Suguru                  was provided by Nancy Vega (UNICEF). We apologize
Mizunoya, Nicolas Reuge), UNICEF Office of Research –           for any omissions and express our sincerest thanks to
Innocenti (Matt Brossard, Jessica Lynn Bergmann), and           everyone, whether named here or not, who graciously
the World Bank (João Pedro Azevedo, Halsey Rogers,              gave their time and expertise.

3   THE STATE OF THE GLOBAL EDUCATION CRISIS: A PATH TO RECOVERY
FOREWORD
The global disruption to education caused by the COVID-
19 pandemic constitutes the worst education crisis on
record. Most countries in the world closed schools and          This crisis has in many ways exacerbated
higher education institutions as part of their strategies to    existing inequalities in education, which is
combat the pandemic. The costs have been immense. The
magnitude of the shock is still not fully understood, but
                                                                why a focus on equity and learning recovery is
emerging evidence is deeply concerning. The State of the        paramount as children return to school.
Global Education Crisis: A Path to Recovery takes stock of
the state of education around the world after prolonged         students at their current levels of learning will be crucial.
school closures that affected nearly all the world’s            Introducing a learning recovery program composed of
students and offers a set of recommendations for the            evidence-based strategies to boost learning can help
recovery. The paper presents updated global simulations         bring students back up to speed. The success of learning
of learning losses and a review of the evidence, to date,       recovery will largely depend on the teachers who are on
of actual measures of learning losses due to COVID-19.          the front lines of delivering learning recovery programs
These data show substantial losses in math and reading,         and supporting students’ wellbeing; those teachers
in high-, middle-, and low-income countries alike, that         need our support. Implementing such programs will
disproportionately affect the most marginalized students.       require significant political and financial commitment
                                                                to strengthen education systems’ capacity and invest
As education systems pivoted to remote learning in              well in their future. To date, less than three percent of
early 2020, many moved quickly to deploy multi-modal            governments’ stimulus packages have been allocated
strategies like online, TV, and radio education, as well        to education; and in low- and lower-middle-income
as print materials and instant messaging, to promote            countries, the share is less than one percent. Much more
learning continuity. However, the quality of remote learning    funding will be needed for immediate learning recovery,
initiatives varied greatly, as did access, with marginalized    let alone for the transformed education that the world’s
students often least likely to access remote learning           children and youth deserve and need.
opportunities. This crisis has in many ways exacerbated
existing inequalities in education, which is why a focus        The State of the Global Education Crisis: A Path to
on equity and learning recovery is paramount as children        Recovery provides a stark reality check for education
return to school.                                               systems worldwide and presents a menu of policy
                                                                actions for recovering learning and using this crisis as
With Mission: Recovering Education 2021, UNESCO,                an opportunity to reinvent education—to make it more
UNICEF, and the World Bank joined forces to provide             resilient, more equitable, and more efficient in delivering
guidance and support to countries navigating the crisis.        learning for all. This opportunity must be seized. Now
The collaboration of the three organizations is ongoing         is the time to act, to prevent this generation of students
as education systems continue to weather the storm of           from suffering permanent losses in their learning
the unfolding pandemic. Reopening schools, assessing            and future productivity, and to protect their ability to
students’ learning levels and wellbeing, and teaching           participate fully in society.

Stefania Giannini,                               Robert Jenkins,                                  Jaime Saavedra,
Assistant Director-General                       Global Director, Education                       Global Director,
for Education                                    UNICEF                                           Education Global Practice
UNESCO                                                                                            The World Bank

4   THE STATE OF THE GLOBAL EDUCATION CRISIS: A PATH TO RECOVERY
© UNICEF/UN0527672/SUJAN
EXECUTIVE SUMMARY

T
              he global disruption to education caused by the      school, with younger and more marginalized children often
              COVID-19 pandemic is without parallel, and its       missing out the most. Students in São Paulo (Brazil) learned
              effects on learning have been severe. The crisis     only 28 percent of what they would have in face-to-face
              brought education systems across the world to        classes and the risk of dropout increased more than
              a halt, with school closures affecting more than     threefold. In rural Karnataka (India), the share of grade three
              1.6 billion learners. While nearly every country     students in government schools able to perform simple
in the world offered remote learning opportunities for             subtraction fell from 24 percent in 2018 to only 16 percent in
students, the quality and reach of such initiatives varied         2020. The global learning crisis has grown by even more
greatly, and they were at best partial substitutes for in-person   than previously feared: this generation of students now risks
learning. Now, 21 months later, schools remain closed for          losing $17 trillion in lifetime earnings in present value as a
millions of children and youth, and millions more are at risk      result of school closures, or the equivalent of 14 percent of
of never returning to education. Growing evidence on the           today’s global GDP, far more than the $10 trillion estimated in
impacts of school closures on children’s learning depicts a        2020. In low- and middle-income countries, the share of
harrowing reality. Learning losses have been large and             children living in Learning Poverty—already over 50 percent
inequitable: recent learning assessments show that children        before the pandemic—will rise sharply, potentially up to 70
in many countries have missed out on most or all of the            percent, given the long school closures and the varying
academic learning they would ordinarily have acquired in           quality and effectiveness of remote learning.

 5   THE STATE OF THE GLOBAL EDUCATION CRISIS: A PATH TO RECOVERY
The crisis exacerbated inequality in education. Globally, full     Reopening schools should be countries’ highest priority.
and partial school closures lasted an average of 224 days.         The cost of keeping schools closed is steep and threatens
But in low- and middle-income countries, school closures           to hamper a generation of children and youth while
often lasted longer than in high-income countries, and the         widening pre-pandemic disparities. Reopening schools
response was typically less effective. Teachers in many low-       and keeping them open should therefore be the top
and middle-income countries received limited professional          priority for countries, as growing evidence indicates
development support to transition to remote learning,              that with adequate measures, health risks to children
leaving them unprepared to engage with learners and                and education staff can be minimized. Reopening is the
caregivers. At home, households’ ability to respond to the         single best measure countries can take to begin reversing
shock varied by income level. Children from disadvantaged          learning losses.
households were less likely to benefit from remote
learning than their peers, often due to a lack of electricity,
connectivity, devices, and caregiver support. The youngest
students and students with disabilities were largely left out
of countries’ policy responses, with remote learning rarely
designed in a way that met their developmental needs.
                                                                   Reopening schools should be countries’ highest
Girls faced compounding barriers to learning amidst school         priority. The cost of keeping schools closed is steep
closures, as social norms, limited digital skills, and lack of     and threatens to hamper a generation of children
access to devices constrained their ability to keep learning.
                                                                   and youth while widening pre-pandemic disparities.
Progress made for children and youth in other domains has
stagnated or reversed. Schools ordinarily provide critical         To tackle the learning crisis, countries must first address
services that extend beyond learning and offer safe spaces         the learning data crisis, by assessing students’ learning
for protection. During school closures, children’s health and      levels. While substantial losses in reading and math have
safety was jeopardized, with domestic violence and child           now been documented in several countries and show
labor increasing. More than 370 million children globally          variations across countries, grades, subjects and students
missed out on school meals during school closures, losing          characteristics, evidence on learning loss generally
what is for some children the only reliable source of food and     remains scarce. It is critical for policymakers, school
daily nutrition. The mental health crisis among young people       administrators, and teachers to have access to learning
has reached unprecedented levels. Advances in gender               data that reflect their context, and for learning data to
equality are threatened, with school closures placing an           be disaggregated by various sub-groups of students, so
estimated 10 million more girls at risk of early marriage in the   that they can target instruction and accelerate students’
next decade and at increased risk of dropping out of school.       learning recovery.

The COVID-19 crisis forced the global education community          To prevent learning losses from accumulating once
to learn some critical lessons, but also highlighted that          children are back in school, countries should adopt
transformation and innovation are possible. Despite the            learning recovery programs consisting of evidence-based
shortcomings of remote learning initiatives, there were            strategies. Evidence from past disruptions to education,
bright spots and innovations. Remote and hybrid education,         such as the 2005 Pakistan earthquake, show that without
which became a necessity when the pandemic hit, has                remedial measures, learning losses may grow even after
the potential to transform the future of learning if systems       children return to school, if the curriculum and teaching
are strengthened and technology is better leveraged to             do not adjust to meet students’ learning needs. Learning
complement skilled and well-supported teachers.                    recovery programs can prevent this and make up the losses
                                                                   with a contextually appropriate mix of proven techniques
Building on the close collaboration of UNESCO, UNICEF, and         for promoting foundational learning: consolidating the
the World Bank under the Mission: Recovering Education,            curriculum, extending instructional time, and making
this report presents new evidence on the severity of the           learning more efficient through targeted instruction,
learning losses incurred during school closures and charts         structured pedagogy, small-group tutoring, and self-guided
a path out of the global education crisis, towards more            learning programs. In addition to recovering lost learning,
effective, equitable, and resilient education systems.             such measures can improve learning outcomes in the long

 6   THE STATE OF THE GLOBAL EDUCATION CRISIS: A PATH TO RECOVERY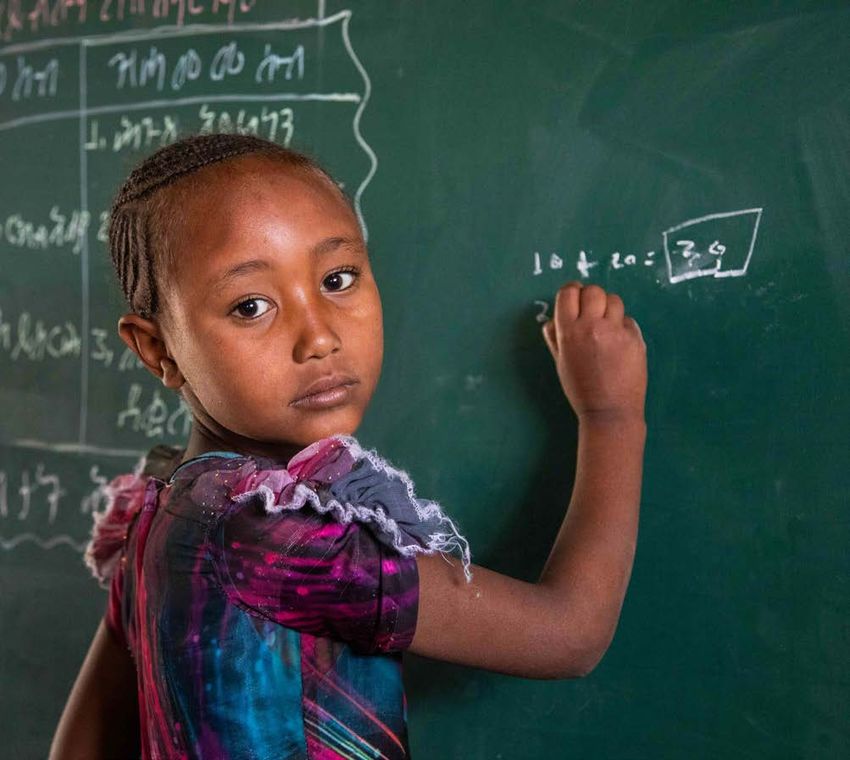
run, by improving systems’ responsiveness to students’        Building back better requires countries to measure how
learning needs. But countries must act now to make that       effective their policy responses are at mitigating learning
happen, taking advantage of the opportunity to improve        loss and to analyze their impact on equity—and then to
their systems before the learning losses become permanent.    use what they learn to keep improving. Improving systems
                                                              to generate timely and reliable data is critical to evaluate
Beyond addressing learning losses, addressing children's      policy responses and generate lessons learned for the next
socioeomotional losses is essential. School closures not      disruption to education. The implementation gap between
only disrupted education, but also affected the delivery      policy and improved student learning requires more
of essential services, including school feeding, protection   research to understand what works and how to scale what
and psychosocial support, impacting the overall wellbeing     works to the system level.
and mental health of children. Reopening schools and
supporting them to provide comprehensive services             Countries have an opportunity to accelerate learning and
promoting wellbeing and psychosocial support is a priority.   make schools more efficient, equitable, and resilient by
This will happen only if teachers are adequately equipped     building on investments made and lessons learned during
and trained to support the holistic needs of children. All    the crisis. Now is the time to shift from crisis to recovery—
teachers should be supported and prepared for remedial        and beyond recovery, to resilient and transformative
education, mental health and psychosocial support, and        education systems that truly deliver learning and wellbeing
remote learning.                                              for all children and youth.

                                                                                                                              © UNICE F/UN049 5427 /POUGET

7   THE STATE OF THE GLOBAL EDUCATION CRISIS: A PATH TO RECOVERY
TABLE OF CONTENTS CLICK ON ANY ITEM TO
NAVIGATE PUBLICATION
EXECUTIVE SUMMARY ................................................................................ 5
PA R T 1
INTRODUCTION. . . . . . . . . . . . . . . . . . . . . . . . . . . . . . . . . . . . . . . . . . . . . . . . . . . . . . . . . . . . . . . . . . . . . . . . . . . . . . . . . . . . . . . . . . . 9
PA R T 2
IMPACT OF COVID-19 ON LEARNING. . . . . . . . . . . . . . . . . . . . . . . . . . . . . . . . . . . . . . . . . . . . . . . . . . . . . . . . . . . . 11
PA R T 3
INEQUALITY IS GROWING IN LEARNING AND BEYOND. . . . . . . . . . . . . . . . . . . . . . . . . . . . . . . . . . 21
PA R T 4
POLICY RESPONSES FOR MITIGATING THE EFFECTS OF SCHOOL CLOSURES.29
PA R T 5
CREATING MORE RESILIENT SYSTEMS.. . . . . . . . . . . . . . . . . . . . . . . . . . . . . . . . . . . . . . . . . . . . . . . . . . . . . . . 35
PA R T 6
CONCLUSION: ACT NOW TO RECOVER LEARNING. . . . . . . . . . . . . . . . . . . . . . . . . . . . . . . . . . . . . . . . . 41
ENDNOTES. . . . . . . . . . . . . . . . . . . . . . . . . . . . . . . . . . . . . . . . . . . . . . . . . . . . . . . . . . . . . . . . . . . . . . . . . . . . . . . . . . . . . . . . . . . . . . . . 43
REFERENCES.. . . . . . . . . . . . . . . . . . . . . . . . . . . . . . . . . . . . . . . . . . . . . . . . . . . . . . . . . . . . . . . . . . . . . . . . . . . . . . . . . . . . . . . . . . . . 46
APPENDIX. . . . . . . . . . . . . . . . . . . . . . . . . . . . . . . . . . . . . . . . . . . . . . . . . . . . . . . . . . . . . . . . . . . . . . . . . . . . . . . . . . . . . . . . . . . . . . . . . 53
8 THE STATE OF THE GLOBAL EDUCATION CRISIS: A PATH TO RECOVERY
© UNICEF/UN0462045/MUSSAPP
PA R T 1
INTRODUCTION
E
ven before COVID-19 hit, the world was already A MOUNTING CRISIS WITHIN A CRISIS
experiencing a learning crisis. 258 million COVID-19 resulted in an unprecedented disruption to
primary- and secondary-school age children education worldwide, affecting more than 1.6 billion
and youth were out of school.1 Many children students and amplifying the pre-existing learning crisis.
who were in school were learning very little: 53 Education systems have attempted to mitigate the effects
percent of all ten-year-old children in low- and of school closures by implementing a range of remote
middle-income countries were experiencing Learning learning modalities to support students continued learning,
Poverty, meaning that they were unable to read and including online platforms, TV and radio programming, and
understand a simple age-appropriate text at age 10.2 The take-home print packages. But the deployment, uptake,
learning crisis was already distributed unequally and and effectiveness of such programs has varied greatly,
disproportionately affected the most vulnerable children. In and in most countries, offered an inadequate substitute for
low-income countries, the Learning Poverty rate was close in-person learning.5
to 90 percent, compared with just nine percent in
high-income countries.3 Globally, the average learning In early 2020, there were warnings of the detrimental effects
adjusted years of schooling (LAYS) stood at just 7.9 years, that school closures resulting from the COVID-19 pandemic
reinforcing that for many of the world’s children and youth, could have, risking reversing decades of advancement in
schooling is not the same as learning.4 education and hindering progress toward the Sustainable
9 THE STATE OF THE GLOBAL EDUCATION CRISIS: A PATH TO RECOVERYDevelopment Goals. Simulations showed that school closures countries adopted to boost access to and effectiveness of
of just seven months could lead to a ten percent increase remote learning.15
in the share of students in Learning Poverty and cost this
generation of students $10 trillion in lifetime earnings.6,7 An With the future of an entire generation at stake, the
estimated 24 million students from pre-primary to tertiary World Bank, UNICEF, and UNESCO launched Mission:
were deemed at risk of permanently dropping out of school.8 Recovering Education 2021 focused on three priorities:
As countries moved into a second year of the pandemic (1) bringing all children back to schools, (2) recovering
and school closures for many countries continued, potential learning losses, and (3) preparing and supporting
losses in learning and life-time earnings were expected to teachers. We joined forces to help governments and school
grow. A mounting body of evidence confirms that learning authorities achieve this critical mission and engaged with
losses as a result of COVID-19 school closures are real, with governments to prioritize education financing for these
stark disparities for marginalized students worldwide. Globally, three objectives. We provided technical assistance and
27 percent of country education systems remained fully or financial support for the return to school, for supporting
partially closed as of September 2021, some still without classroom activities to accelerate learning and implement
plans for reopening.9 remedial education schemes, and for supporting teachers’
professional development. Our three organizations remain
In addition to the effects on learning, the COVID-19 health committed to sounding the alarm on the urgency of the
crisis directly affected children, youth, and their families along crisis in education, and this report highlights the growing
multiple dimensions. Nearly five million individuals have died evidence of learning losses and widening inequalities,
due to COVID-19, and more than one million children around together with the need to take immediate actions to
the world have lost a parent or caregiver to COVID-19.10,11 recover learning and build more equitable, efficient and
Restrictions on mobility and economic activity that were resilient learning systems.
put in place to mitigate the health impacts of the pandemic
have led to huge economic disruption, with an estimated REPORT OVERVIEW
124 million people pushed into poverty.12 At the same time, This report spotlights how COVID-19 has deepened the
countries experienced economic contractions and budget education crisis and charts a course for creating more
cuts, creating a perfect storm that disproportionately affected resilient education systems for the future. The next section
vulnerable populations and widened inequities across documents COVID-19’s impacts on learning levels by
countries and within countries. A growing concern is that the presenting updated simulations and bringing together
recovery may be similarly inequitable13 and that the effects of the latest documented evidence on learning loss from
COVID-19 will be long-lasting. over 28 countries. Section three explores how the crisis
has widened inequality and had greater impacts on
MISSION: RECOVERING EDUCATION 2021 already disadvantaged children and youth. Section four
At the beginning of the COVID-19 pandemic, the World reviews evidence on learning recovery from past crises
Bank, UNICEF, and UNESCO partnered to monitor national and highlights current policy responses that appear most
education responses to school closures and support likely to have succeeded in stemming learning losses,
policymakers to assess the global impacts of the pandemic. while recognizing that the evidence is still in a nascent
The first joint report, published in October 2020, offered stage. The final section discusses how to build on the
analysis on the actions that countries took to implement investments made and the lessons learned during the
remote learning, the support they offered to parents and pandemic to accelerate learning recovery and emerge from
teachers, their plans and safety measures for school the crisis with increased education quality, resilience, and
reopening, and the financial resources they needed for equity in the longer term.
the national education response to the pandemic. The
early survey results illustrated how COVID-19 could widen
inequities between and within countries, as a result of
lost opportunities for learning.14 Eight months further into
the pandemic, the second joint report published in June This report spotlights how COVID-19 has deepened
2021 provided a progress report on school closures and
reopenings, measures education systems had taken for
the education crisis and charts a course for creating
assessing student learning and learning loss, and policies more resilient education systems for the future.
10 THE STATE OF THE GLOBAL EDUCATION CRISIS: A PATH TO RECOVERY© UNIC EF/U N050 6605/IJAZAH
PA R T 2
IMPACT OF COVID-19 ON LEARNING
T
o assess the impact of COVID-19 on learning, it ineffective teaching. Various studies simulate the potential
is important to define what we mean by learning losses associated with the pandemic or, as data
learning loss. This report defines the term becomes available, report on the actual observed learning
“learning loss” as any loss of knowledge or skills losses as systems reengage with students. Two main types
and/or deceleration of or interruption to of learning losses are often discussed in the literature:
academic progress, most commonly due to “forgetting,” which refers to the loss of previously acquired
extended gaps or discontinuities in a student’s education. learning, and “forgone” learning, which means expected
Learning loss is not a new concept in the education policy learning that does not take place as schools are closed to
debate and can be driven by summer breaks, interruptions in-person learning. When estimating the “forgone”
to formal education, dropouts, school absence, and learning, some authors estimate a counterfactual using
11 THE STATE OF THE GLOBAL EDUCATION CRISIS: A PATH TO RECOVERYempirical data, such as previous cohorts attained learning children’s future learning trajectories. If children lost
levels, while others use normative criteria such as essential building blocks for future learning during
grade-level expectations.16 To distinguish between school closures and are not helped to recover them,
empirical and normative counterfactuals, this paper refers learning will continue at a slower pace than before.
to learning losses and learning gaps. While the former can Figure 1 illustrates the elements described above using
be attributed to a shock such as COVID related school a hypothetical learning progression (slope) given by the
closures, the latter was a problem prior to the pandemic, learning trajectory pre-COVID. It shows that COVID-
as students in many systems were already performing related school closures between period t1 and t2 can
below expectations. The focus of this report is learning yield learning losses (both in terms of forgetting and
losses, rather than learning gaps.17 forgone). Such losses can be measured at t2 (present
time) as schools reopen. Since learning is progressive, if
On top of forgetting and forgone learning, additional it is not recovered, students might be pushed towards a
learning losses could accumulate even after students new learning trajectory (post-COVID learning trajectory)
return to school. Learning is a cumulative process, with with a flatter slope, which will result in a level of learning
new skills building on existing ones. Evidence from past at t3 that would be lower than would have been expected
emergencies documents that school closures often do if students had remained at the pre-COVID rate of
long-term damage: affected cohorts of children end learning. This difference is referred to in the figure as
up with lower educational attainment, as well as lower future learning losses. The current crisis presents an
earnings and higher unemployment in adulthood.18,19,20,21 opportunity, since to recover learning losses, students
Some evidence shows that part of the long-term losses must be put on an accelerated learning recovery
are attributable to slower learning once children return trajectory. This rate of learning can bring students back
to school. 22 Consequently, learning losses associated to the expected pre-pandemic learning levels at t3,
with the pandemic may result in compounded negative and change the future expected learning levels of this
consequences for this generation of students by harming generation beyond t3.
FIGURE 1. Learning trajectories pre- and post-COVID, showing implications of current learning losses on future learning
ACCELERATE LEARNING
LEARNING PROGRESSION
RECOVERY TRAJECTORY
POST-COVID
COVID
RELATED SCHOOL CLOSURES TAKE LEARNING TRAJECTORY
PLACE BETWEEN T1 AND T2 PRE-COVID
l3 FUTURE
l2
FORGETTING LEARNING
AND LOSS
l3' FORGONE LEARNING TRAJECTORY
POST-COVID
l2'
WHERE,
• FORGETTING AND FORGONE AT THE
END OF THE PANDEMIC, T2, IS (L2-L2')
• FUTURE LEARNING LOSS AT T3 IS (L3-L3')
• ASSUMING THAT STUDENTS DO NOT GET
BACK ON TRACK, LEARNING LOSSES WILL
CONTINUE TO ACUMULATE, AND
(L3-3') > (L2-L2').
t1 t2 t3 TIME
Source: authors’ illustration.
12 THE STATE OF THE GLOBAL EDUCATION CRISIS: A PATH TO RECOVERY2.1 UPDATED GLOBAL SIMULATIONS SHOW Simulations at the end of 2020, 9 months into the
LEARNING LOSSES LARGER THAN FEARED pandemic, suggested that school closures lasting seven
The quantity of schooling lost is momentous. At its school months could cost this generation of students an
peak, school closures affected 1.6 billion children in 188 estimated $10 trillion in lifetime earnings in present value
countries,23 with over one billion of these children living in the intermediate scenario—or as much as $16 trillion
in low- and middle-income countries. Globally, from under a pessimistic scenario. World Bank simulations in
late February 2020 until early August 2021, education 2020 expected to see a global loss of 0.9 learning-adjusted
systems were on average fully closed for 121 instructional years of schooling (LAYS), driving the global average down
days and partially closed for 103 days, with the world’s from 7.8 LAYS to 6.9 LAYS.25 Under this scenario, a typical
poorest children disproportionately affected.24 While some student would lose $25,000 in lifetime earnings in present
countries quickly reopened schools, many kept all schools value terms, and this generation of students could lose an
closed for exceptionally long periods or reopened, but only estimated $16 trillion in earnings. And with that duration of
partially. For example, some education systems reopened school closures, learning poverty was expected to increase
but offered access to face-to-face schooling only in certain by 10 percentage points, reaching 63 percent.26
areas, to certain grades, or to all students on a part-time
basis, adopting a hybrid model where students rotate in
receiving in-person instruction.
FIGURE 2. Hundreds of millions of students in low- and middle-income countries have been affected by full and partial
school closures since the start of the pandemic
140
1.2
120
1.0
100
NUMBER OF STUDENTS (IN BILLIONS)
0.8
NUMBER OF COUNTRIES
80
0.6
60
0.4
40
0.2 20
0
0.0
20
20
20
20
20
0
20
0
20
20
20
21
1
21
1
1
1
1
21
20
02
02
2
2
2
2
02
20
20
20
20
20
20
20
20
20
20
20
20
20
20
20
20
20
L2
P2
L2
N
B
R
AY
N
G
T
V
C
N
B
AR
R
AY
N
G
AR
JU
JU
SE
OC
FE
AP
NO
DE
FE
AP
AU
AU
JA
JU
JA
JU
M
M
M
M
STUDENTS AFFECTED BY CLOSURES (FULLY CLOSED; BILLIONS) NUMBER OF COUNTRIES FULLY CLOSED
NUMBER OF COUNTRIES PARTIALLY CLOSED
STUDENTS AFFECTED BY CLOSURES (PARTIALLY CLOSED; BILLIONS)
NUMBER OF COUNTRIES AFFECTED BY CLOSURES (FULL OR PARTIAL)
Source: authors’ calculations using UNESCO school closure database.
13 THE STATE OF THE GLOBAL EDUCATION CRISIS: A PATH TO RECOVERYUpdated learning loss simulations show that results under Many education systems have reopened schools, even
a pessimistic scenario are worse and this generation of if partially, which may help prevent further losses. In
students could lose $17 trillion in lifetime earnings at the intermediate scenario of potential learning losses
present value. 27 This projected loss is equivalent to 14 by August 2021, schools are assumed to be partially
percent of today’s global GDP. The new simulations indicate opened, mitigation measures are assumed to be slightly
a shift in the distribution of learning losses by income more effective and an average of 25 percent of students
groupings: a larger share of losses is now expected to have assumed to be back in schools during the weeks in
taken place in middle-income countries, because their which the system is partially closed. In this scenario,
reported school closures have been longer than those in LAYS is expected to have fallen from 7.8 to 7.1, with $12
high- and low-income countries. trillion losses in lifetime earnings and Learning Poverty
expected to have increased to 67 percent (see Figure 3).
In the pessimistic scenario, Learning Poverty is expected In this report we are giving more weight to the pessimistic
to increase to as much as 70 percent in low- and middle- scenario, because: (1) we have no reliable evidence that
income countries. In both new simulated scenarios, remote learning during the pandemic has effectively
remote learning is expected to have performed in the same mitigated learning losses in the majority of countries29;
way, and in line with the pessimistic scenario of November and (2) most evidence from middle-income countries
2020, and schools are assumed to be fully closed.28 suggest that that partial school reopening has often
Results by income groups (see Figure A.1 in the appendix) benefited a negligible share of the student population.
indicate that Learning Poverty is likely to worsen most
in upper- and lower-middle-income countries; Learning
Poverty might increase up to 23 and 10 percentage points
respectively. In contrast, in low-income countries, Learning
Poverty might increase only 1 percentage point (although
starting from a very high base of 90 percent).
FIGURE 3. Learning Poverty is likely to get worse
70 262 268
14
11 250
60 10
223
56 56
50 53 194
40
30
20
10
0
NOV/2020 SIMULATIONS NOV/2021 SIMULATIONS NOV/2021 SIMULATIONS
(PESSIMISTICSCENARIO) (INTERMEDIATE SCENARIO) (PESSMISTIC SCENARIO)
PRE-COVID BASELINE COVID
Notes: (1) results for low- and middle-income countries; (2) Nov/2020 pessimistic scenario
assumes 70 percent of school closure and about 10 percent of the learning losses while schools
are closed will be fully mitigated in high-income countries, but in the developing world, 7
© UNI CEF /UNI 21727 4/K OK IC
percent as described in Azevedo (2020); (3) Nov/2021 simulations build on the same remote
learning effectiveness parameters as in Azevedo (2020), however, actual length of school
closure information builds on UNESCO database (as used in Figure 2); Intermediate scenario:
partial reopening is assumed to be at 50 percent of the system; Pessimistic scenario: Partial
reopening is assumed to be negligible, or that the system was fully closed. For details on the
November/2021 simulation update see Azevedo, Cloutier et al (2021). (4) baseline learning
poverty values reflected July 1st, 2021 country updates and revisions (see Azevedo, Montoya et
al (2021) for details). This update included the latest data for Sub-Saharan Africa and East Asia
and the Pacific.
14 THE STATE OF THE GLOBAL EDUCATION CRISIS: A PATH TO RECOVERY2.2 GROWING EVIDENCE CONFIRMS for fourth graders were 27 percent higher for girls than boys.
LEARNING LOSSES ARE REAL In Kenya, a non-representative sample of motivated primary
tudies from low- and middle-income countries show major
S school children who maintained use of the online Math-
systemwide learning losses. Results from two states in Whizz tutoring platform before and during the pandemic via
Mexico show significant learning losses in reading and in Project iMlango lost an equivalent of three and a half months
math for students aged 10-15. The estimated learning losses of learning in math.34 Primary school children in Ethiopia
range from 0.34 - 0.45 standard deviations in reading and learned only 30-40 percent as much in math as they would
0.62 – 0.82 standard deviations in math, varying by students’ during a normal year, and the learning gap between urban
socioeconomic status, gender, and age.30 The study confirms and rural students increased.35 In Ghana, evidence suggests
that the share of students who cannot not read or understand that inequalities in learning outcomes were exacerbated
a simple text is set to increase markedly, rising by 15 during the pandemic. Students of higher socioeconomic
percentage points for students of high socioeconomic status status outperformed students of lower socioeconomic status
and 25 percentage points for students of low socioeconomic in math and reading, which may be a result of their higher
status, aligned with the simulation results. In rural Pakistan, engagement rates in remote learning and their schools and
results for primary students in grades 1-5 declined in math, caregivers providing more support during school closures.36
as well as in reading in Urdu/Sindhi/Pashto, but remained
flat in English.31 In Russia, school closures in one region had Figure 4 below highlights some of the learning losses from
heterogenous impacts on learning across grades. While there selected low-and-middle income countries, presented in
were no observed learning losses in reading among fourth terms of the share of a school year’s worth of learning each
graders, sixth graders lost the equivalent of 3-4 months of loss represents. Evidence from some countries suggest that
learning and eighth graders lost the equivalent of nearly on average, the learning losses are roughly proportional
a year and half of learning in science literacy.32 In South to the length of school closures. However, there is a great
Africa, early-grade students suffered learning losses in deal of heterogeneity, as illustrated in the figure below. Note
reading after missing on average 60 percent of school days that the studies that gathered data on learning loss are
in 2020. Second graders experienced losses of between measuring learning in different grades, for different subjects,
57 and 70 percent of a year of learning. Fourth graders at different scales, with varying timelines and have relied on
experienced losses of between 62 and 81 percent of a year of different designs (see footnote of Figure 4 for more details).
learning.33 While girls in South Africa typically outperform boys However, the main takeaway remains: children around the
in reading, evidence indicates that learning losses in English world have experienced substantial learning losses.
FIGURE 4. Changes in learning as shares of learning normally expected in one school year, non-standardized and
standardized by the length of closures (selected Low- and Middle-Income countries)
FORGETTING AND
FORGONE (SAME
FORGETTING ONLY (SAME STUDENTS) FORGETTING AND FORGONE (DIFFERENT COHORTS, SAME GRADE)
STUDENTS, ESTIMATED
COUNTERFACTUAL)
KENYA PAKISTAN BRAZIL SOUTH AFRICA RUSSIA BRAZIL ETHIOPIA
M M L M L L L L L L S L M M M
G8 G3-G8 G5 G5 G2 G2 G4 G4 G4 G6 G8 G5 G5 G6 G6
50
SHARE OF LEARNING EXPECTED
0
IN ONE SCHOOL YEAR (%)
-50
-100
-150
-200 SHARE OF LEARNING EXPECTED IN ONE SCHOOL YEAR
-250 SHARE OF LEARNING EXPECTED IN A SCHOOL YEAR
STANDARDIZED BY LENGTH OF SCHOOL CLOSURES
-300
Notes: (1) “Forgetting” refers to learning that students forgot during school closures, while “forgone” learning refers to learning that would normally take place but did not take place during school closures. While most studies report
them in a combined measurement, some distinguish between the two, and a few only measured the forgetting; (2) Some studies track the results of the same students before and during the pandemic (using a panel or pseudo-panel
design), while others compare the results of the same grade across different cohorts, a pre-pandemic cohort compared to a cohort affected by the pandemic (using a repeated cross-sections design); (3) G refers to grade, and the
number denotes which grade. E.g., G2 = grade two; (4) L refers to language, M to math, S to science literacy; and (5) Selected countries are those for which the study provides data required to compute the effect in share of school year.
Source: Authors’ calculations using data from multiple studies, all available in Table 1 in the appendix.
15 THE STATE OF THE GLOBAL EDUCATION CRISIS: A PATH TO RECOVERYDetailed data from São Paulo state in Brazil demonstrate scoring lower than the 2019 cohort in every grade, with
the erosion of learning progress during school closures. larger losses for younger students.38 Figure 5a illustrates
A study from São Paulo in Brazil, shows that on average, the learning trajectory for fifth graders in Portuguese,
students learned only 28 percent of what they would have in while Figure 5b shows math. These results are particularly
face-to-face classes and the risk of dropout increased more striking, as they illustrate how the shock has eliminated a
than threefold.37 São Paulo's state-wide exams in 2021 show decade or more of steady learning progress.
learning losses across the board, with the 2021 cohorts
FIGURE 5A: São Paulo: Timeline for 5th grade students in Math, National Basic Education Assessment System (SAEB)
vs. sample evaluation
300
275
250 243 250
237 239
SAEB SCORES
220
225 213
200 SIMILAR RESULTS: 196 TODAY, 194 IN
2007. STUDENTS TODAY ARE BACK AT 196
LEARNING LEVELS FROM 14 YEARS AGO!
175
150
2011 2013 2015 2017 2019 2021 2021
(BEGINNING) (END)
SAEB RESULTS SAEB PROJECTION STUDENT RESULTS
Source: authors’ calculations using data from SEDUC-SP, 2021.
FIGURE 5B: São Paulo: Timeline for 5th grade students in Language, National Basic Education Assessment System
(SAEB) vs. sample evaluation in São Paulo
250
240
230 226 223 230
219
220
210
SAEB SCORES
202
200
192 SIMILAR RESULTS: 194 TODAY, 192 POINTS
IN 2011. STUDENTS TODAY ARE BACK AT 194
190
LEARNING LEVELS FROM 10 YEARS AGO.
180
170
160
150
2011 2013 2015 2017 2019 2021 2021
(BEGINNING) (END)
SAEB RESULTS SAEB PROJECTION STUDENT RESULTS
Source: authors’ calculations using data from SEDUC-SP, 2021.
16 THE STATE OF THE GLOBAL EDUCATION CRISIS: A PATH TO RECOVERYBeyond São Paulo, in a group of Brazilian states, the share of
second graders who are off-track to become fluent readers FIGURE 6. Karnataka, India: a decline in the share of
students able to read a grade 2 level text, by grade
increased from 52 percent to 74 percent, supporting the
notion that the pre-pandemic learning crisis has worsened 70%
during the COVID-related school closures. With the support
60% 61%
of civil society organizations, the Secretary of Education of ten
57%
Brazilian states decided to participate in a foundational skill 50%
assessment of second grade students.39 The main objective 46%
of this exercise was to define the baseline for the recovery 40%
as schools reopen and to use this information to define 34%
30%
strategies to mitigate learning losses. The study showed that
74 percent of second graders are pre-readers (meaning they 20%
can only read a maximum of 9 words per minute); this is a 19%
much higher share than in 2019, where 52 percent of 2nd 10%
10%
graders were classified as pre-readers.
0%
GRADE 3 GRADE 5 GRADE 7
Data from Annual Status of Education Report (ASER) 2018 2020
assessments in rural Karnataka in India illustrates large
Source: World Bank analysis of data from Pratham, Annual Status of Education Report,
learning losses in math and reading, with the share of grade Karnataka Rural, 2021
three children in government schools able to perform simple
subtraction falling from 24 percent in 2018 to only 16
percent in 2020.40 Figure 6 shows learning losses in reading
in Karnataka across grades between 2018 and 2020.
© UNICE F/UN049 9532 /POTTE R
17 THE STATE OF THE GLOBAL EDUCATION CRISIS: A PATH TO RECOVERYEven in high-income countries able to quickly organize real-time Younger learners were adversely affected and typically had
online instruction, learning losses appear substantial. While greater losses. Evidence from São Paulo and Karnataka
the focus of this report is on low- and middle-income countries, illustrated in Figures 5-6 show greater losses among the
there is also value in learning from patterns observed in some earlier grades. Similarly, an eight-week school shutdown in
high-income countries. In Belgium, where schools were closed or Switzerland showed that primary school students learned
partially closed for one third of the school year in 2020, evidence more than twice as fast when attending school in-person
from standardized tests implemented before and after the start compared to remote learning during school closures.55 By
of the pandemic suggests losses of 0.17 standard deviations contrast, Swiss secondary students did not experience any
for math and 0.19 standard deviations for language, with larger significant decline in learning pace. Likewise, results from
learning losses in schools with high proportions of disadvantaged Mexico and the United States show larger absolute losses
students.41 In the United Kingdom, results from autumn 2020 for students in the earlier grades.56,57,58 Comparably, sixth
showed a learning loss in reading akin to two months of learning, graders in Uganda experienced learning losses in math
among both primary and secondary students.42 Data from an and English language compared to previous cohorts, while
8-week school shutdown in the Netherlands show a learning tenth grade students made gains.59 There may be multiple
loss equivalent to 20 percent of a school year.43 Evidence from reasons behind this pattern: younger learners have less
Italy compares results in math for grade three students affected foundational knowledge to fall back on than older students;
by the pandemic compared to a previous cohort. Students they require more learning support, making them less suited
performed 0.19 standard deviations worse in math compared to for remote learning; and they often make larger learning
the pre-covid cohort.44 Evidence from across the United States gains than older students while in school, meaning there
mirror the situation in Europe, with significant learning losses in is more potential learning to lose when schools close.
math and reading.45,46 In Texas, only 30 percent of third graders However, when learning is measured relative to typical
tested at or above grade level in math in 2021, compared gains, emerging evidence suggests older students are doing
to 48 percent in 2019.47 Similar learning losses have also worse in some cases, such as in the United States and
been observed in California,48 Colorado,49 Tennessee,50 North the state of São Paulo.60,61 Results from Russia go against
Carolina,51 Ohio,52 Virginia,53 and Maryland.54 Figure 7 illustrates the overall trend, with older students experiencing large
learning losses in selected high-income countries, expressed in declines and younger students less affected or showing no
terms of the share of the school year that each loss represent. loss at all.62
FIGURE 7. Changes in learning as shares of learning normally expected in one school year, non-standardized and
standardized by the length of closures (selected High-Income countries)
FORGETTING AND
FORGONE (DIFFERENT
COHORTS, SAME
GRADE) FORGETTING AND FORGONE (SAME STUDENTS, ESTIMATED COUNTERFACTUAL)
NETHER-
CZECH REPUBLIC CALIFORNIA ITALY UNITED KINGDOM AUSTRALIA
LANDS
L M L M M L L L L L L L M ML M L
G5 G5 G4-G8 G4-G8 G3 G3 G4 G5 G6 G7 G8 G9 PRIM G4-G7 G3 G4
0
SHARE OF LEARNING EXPECTED
-20
IN ONE SCHOOL YEAR (%)
-40
-60
-80
-100 SHARE OF LEARNING EXPECTED IN ONE SCHOOL YEAR
SHARE OF LEARNING EXPECTED IN A SCHOOL YEAR
-120 STANDARDIZED BY LENGTH O SCHOOL CLOSURES
Notes: (1) “Forgetting” refers to learning that students forgot during school closures, while “forgone” learning refers to learning that would normally take place but did not take place during school closures. While most
studies report them in a combined measurement, some distinguish between the two, and a few only measured the forgetting; (2) Some studies track the results of the same students before and during the pandemic
(using a panel or pseudo-panel design), while others compare the results of the same grade across different cohorts, a pre-pandemic cohort compared to a cohort affected by the pandemic (using a repeated cross-
sections design); (3) G refers to grade, and the number denotes which grade. E.g., G2 = grade two; (4) L refers to language, M to math, S to science literacy; and (5) Selected countries are those for which the study
provides data required to compute the effect in share of school year.
Source: authors’ calculations using data from multiple studies, all available in Table 1 in the appendix.
18 THE STATE OF THE GLOBAL EDUCATION CRISIS: A PATH TO RECOVERYLearning impacts seem to vary by subject, with students Paulo, Brazil, and Uganda all shows greater losses in math
often recording greater losses in math than in reading. For than reading. 64,65,66 This finding is in line with some of the
example, in rural Pakistan, there were some small losses existing literature on summer learning loss.67 A potential
in reading in home languages and math, while the share of reason may be less exposure to math than reading in daily
children who could read sentences in English held steady life outside school, another may be that caregivers are less
between 2019 and 2021.63 The evidence from Mexico, São able to support students in math than reading.
TABLE 1. Unequal learning losses—Who is losing the most in low- and middle-income countries?
DIMENSION OF INEQUALITY EXAMPLES
Geography Bigger losses for students in rural and disadvantaged areas:
Ethiopia: Learning of primary students in rural areas was one-third of the normal rate, compared with less than half in urban
areas; evidence of widening gap the pre-primary level too
Kenya (EdTech program participants): Larger losses for students in “hardship” areas; slightly larger losses for rural schools
Gender Bigger losses for girls:
South Africa: Learning losses for girls were 20 percent and 27 percent higher than for boys in home language and English
reading, respectively, in Grade 4; and girls lost 9 words per minute in reading speed, vs. 6 words per minute for boys
Pakistan (ASER districts): Learning losses were larger for girls than for boys across nearly all competencies
and grades
Mexico (citizen-led assessment, 2 states): Larger learning losses for girls than boys (among low-income households, and in
reading among high-incomes households)
Bigger losses for boys:
Pakistan (small private-school sample): Boys suffered absolute losses, and bigger losses relative to expectated learning gains,
whereas girls have not lost much relative to expected learning gains
No differential impact:
Ethiopia: No widening of gaps in primary or pre-primary
Age / Grade Bigger losses for students in earlier grades:
Pakistan (ASER districts): Larger learning losses for Grade 1 and 3 students than for Grade 5 students in all 3 subjects:
math, reading (Urdu), and English
Kenya (EdTech program participants): Larger losses for Grades 4 and 6 than for Grade 8
Brazil (São Paulo): Larger absolute losses for grade 5 than for grades 9 and 12
Uganda: Learning losses in grade 6, but learning gains in grade 10
India (Karnataka): Larger losses in grades 3 and 5 than in grade 7
Mexico: Larger losses were observed for ages 10 and 11 than for ages 12-15
Bigger losses for students in later grades:
Russia (Krasnoyarsk): No learning loss in grade 4, 3-4 months of learning lost in grade 6, and 1.5 years of learning lost in
grade 8
Public/private Bigger losses for public-school students:
Pakistan (ASER districts): Larger losses for students attending government schools than for those attending private schools
Pre-pandemic learning levels Mixed evidence:
South Africa: In grade 2, more severe impact on the least proficient students than on those with higher initial reading
proficiency; but in grade 4, larger impact on those with higher initial proficiency
Pakistan (ASER districts): Larger losses for previously high- and low-performing students than for medium-performing
Socioeconomic status Bigger losses for lower-SES students
Pakistan (small private-school sample): Poorest children suffered absolute losses in learning and are far behind expected
learning; richer students stayed roughly in line with expectations
Mexico (citizen-led assessment, 2 states): Larger learning losses for low-SES students
No impact:
Russia (Krasnoyarsk): No observed increase in inequality in learning losses (although SES still determinant of learning levels)
Uruguay: No observed increase in SES inequality in learning losses
Note: For sources, see citations in the body of this paper.
19 THE STATE OF THE GLOBAL EDUCATION CRISIS: A PATH TO RECOVERY© UNICEF/UN0479447/KAR KI Disadvantaged students were disproportionately affected In a few countries, the data indicates no learning losses by learning losses. Evidence from Italy shows that or even small gains. For example, in Uruguay, there were among children of low-educated parents, high-performing marginal improvements for grade three and grade six students and girls experienced greater losses during the students in math and reading between 2017 and 2020.76 pandemic.68 In the United Kingdom, secondary schools In Uganda, grade 10 students held steady in math and serving students from disadvantaged backgrounds made significant gains in English between 2017 and had learning losses in reading 50 percent higher than 2021.77 It is worth noting that unlike other studies reported those serving fewer students from disadvantaged here, which measured losses using a baseline just before backgrounds.69 Historically marginalized and economically or at the start of the pandemic, these two studies rely on disadvantaged students had larger declines relative to a baseline measured three years before the pandemic hit; more advantaged peers in the United States as well.70,71,72 this means that they cannot show how learning changed In Czech Republic, students lost the equivalent of about during the pandemic specifically. The improvement or three months of learning during the first year of the stability in learning levels could reflect pre-pandemic gains pandemic, based on tests in the Czech language and from between 2017 and early 2020, even if these were mathematics administered in 2020 and 2021 in grade followed by pandemic-period losses. Pre-pandemic gains five.73 Among schools with below-average results in 2020, could reflect successful earlier policy interventions. For the schools attended by more children with university example, Uruguay has invested greatly in social inclusion educated parents saw their results fall significantly less and equity in educational technology through Plan Ceibal, than schools with less educated parents, highlighting an initiative that distributed laptops and no-cost internet to the role parents played in stemming learning loss during all students and teachers, along with digital skills training.78 school closures. In line with the findings from the Czech Such investments almost certainly increased preparedness Republic, learning losses observed in the Netherlands for remote learning during the pandemic, but they could were 60 percent larger among students from less- also have contributed to learning gains even before that. educated homes,74 fueling concerns of the unequal Uruguay was also the first country in Latin America to impact of the pandemic, even in countries with high levels reopen its education system.79 Evidence from Australia of equality and near universal broadband access. The indicates no overall learning losses, with students learning pre-pandemic literature on summer learning loss offers on average as much in math and reading in 2020 as a plausible explanation for this trend: learning resources had the previous cohort in 2019.80 However, students in can be considered in terms of a “resource faucet”, which disadvantaged schools lost an equivalent of two months of is flowing for all students while in school, but which slows learning compared to the 2019 cohort, while their peers or stops completely for students from disadvantaged in more advantaged schools experienced two months of backgrounds during out-of-school periods.75 additional growth. 20 THE STATE OF THE GLOBAL EDUCATION CRISIS: A PATH TO RECOVERY
You can also read