The Strong Antioxidant Sheep/Goat Whey Protein Protects Against mTOR Overactivation in Rats: A Mode of Action Mimicking Fasting - MDPI
←
→
Page content transcription
If your browser does not render page correctly, please read the page content below
antioxidants
Article
The Strong Antioxidant Sheep/Goat Whey Protein
Protects Against mTOR Overactivation in Rats:
A Mode of Action Mimicking Fasting
Efthalia Kerasioti 1 , Aristidis Veskoukis 1 , Christina Virgiliou 2,3 , Georgios Theodoridis 2,3 ,
Ioannis Taitzoglou 4 and Dimitrios Kouretas 1, *
 1    Department of Biochemistry and Biotechnology, University of Thessaly, Viopolis, Mezourlo,
      41500 Larissa, Greece; e-f-thalia@hotmail.com (E.K.); veskoukis@uth.gr (A.V.)
 2    Laboratory of Analytical Chemistry, School of Chemistry, Aristotle University of Thessaloniki,
      54124 Thessaloniki, Greece; cr_virgi@hotmail.com (C.V.); gtheodor@chem.auth.gr (G.T.)
 3    Biomic_AUTh, Center for Interdisciplinary Research and Innovation (CIRI-AUTH), Balkan Center,
      57001 Thessaloniki, Greece
 4    School of Veterinary Medicine, Aristotle University of Thessaloniki, 54124 Thessaloniki, Greece;
      jotai@vet.auth.gr
 *    Correspondence: dkouret@uth.gr; Tel.: +30-2410-565-277

 Received: 18 February 2019; Accepted: 21 March 2019; Published: 23 March 2019

 Abstract: Whey protein, a by-product of the cheese industry, can be putatively used as a functional
 food due to its beneficial health properties. The main objective of the present study was to assess
 in vivo the effect of a sheep/goat whey protein on the plasma amino acid profile and mammalian
 target of rapamycin (mTOR), a regulator of skeletal myogenesis. A control group was fed with
 a standard commercial diet while the experimental group received a standard commercial diet
 plus sheep/goat whey protein for 28 days. Liquid chromatography-tandem mass spectrometry
 (LC-MS/MS) was conducted to determine plasma amino acid levels while the expression of p70-S6
 Kinase 1 (p70-S6K1) in liver and quadriceps muscles was quantified and used as a biomarker of
 mTOR activity. The results obtained showed a decrease in the levels of essential and branched-chain
 amino acids (BCAAs) in the experimental group. Furthermore, p70-S6K1 expression was decreased
 in the liver of rats consumed whey protein. In conclusion, the reduction of amino acid levels and
 the concomitant inactivation of mTOR imply that whey could potentially act protectively against
 disorders induced by mTOR overactivation. Intriguingly, this mode of action mimics fasting, an
 approach with established advantageous health effects.

 Keywords: sheep/goat whey protein; amino acids; mTOR; disease; fasting

1. Introduction
      Proteins are fundamental biomolecules that are constructed by amino acids and perform a wide
range of function, both from the technological [1,2] and nutritional [3] aspects. Indeed, they stimulate
tissue growth and maintenance, they participate in numerous biochemical reactions, they act as
messengers, they form immunoglobulins or antibodies, they transport and store nutrients and provide
energy [4–7]. Proteins can be derived from different sources and might have either animal or plant
origins. The idea that proteins derived from animals are richer sources of nutrients because they
contain a greater arrow of amino acids, vitamins [8,9], metals [10,11] and fatty acids that are necessary
for normal cell function compared to plant proteins used to be dominant. However, it appears that
this is not the case [8]. Several experimental approaches have reported inconclusive results. Today we
know that it is not an easy task to promote the notion regarding the superiority of foods rich in proteins

Antioxidants 2019, 8, 71; doi:10.3390/antiox8030071                         www.mdpi.com/journal/antioxidants
Antioxidants 2019, 8, 71 2 of 15
of animal origin against the plant-derived protein products [12–14]. There is no compelling evidence
backing up this superiority as indicated on the basis of cardiovascular and other pathologies [12,14].
Although, there are specific animal protein products that possess beneficial health properties. Whey
belongs to this category.
Whey is a complex of proteins deriving from animal milk and has been characterized as a putative
functional food with important health-related advantages. Milk, in general, constitutes a rich source of
antioxidant compounds (e.g., tocopherols, retinol, carotenoids, ascorbate, phenols) including those
that are derived from whey protein [15–17]. Niero et al. [18] determined for the first time the total
antioxidant activity (TAA) of sheep, buffalo and goat milk. According to their findings, sheep milk
showed the greatest TAA compared to buffalo and sheep milk and this could be attributed to its higher
content in whey proteins, casein and fats. Recent evidence has demonstrated that sheep/goat whey
protein as a food supplement possesses remarkable antioxidant properties at the molecular and tissue
levels. Specifically, it has been found that sheep/goat whey protein possesses the ability to neutralize
numerous free radicals, such as the commercially available 2,2-diphenyl-1-picrylhydrazyl (DPPH•)
and 2,2’-azinobis(3-ethylbenzothiazoline-6-sulphonic acid) (ABTS•+ ) as well as OH• and O2 •− that
normally exist in the organisms [19]. Furthermore, administration of sheep/goat whey protein in
mouse myoblast C2C12 and endothelial Ea.hy926 cells exerted protective action against oxidative
stress by enhancing the antioxidant defense and by confining protein and lipid peroxidation [19,20].
Additionally, sheep/goat whey protein improved the antioxidant defense of Ea.hy926 cells by
activating antioxidant enzymes via the nuclear factor (erythroid-derived 2)-like 2/antioxidant response
element (Nrf2/ARE) signaling pathway [21]. In another study, sheep/goat whey protein improved
the redox status of blood and tissues in an in vivo model (i.e., rats) [22]. Furthermore, it improved
the antioxidant ability of athletes and, hence, could potentially be used as a performance-enhancing
substance [23,24]. Based on the above, it becomes evident that whey protein is a strong antioxidant
that could be putatively used in order to protect against redox altering stimuli.
Whey proteins are considered high-quality proteins as they contain all the essential amino acids
(EAAs) and, in fact, at higher concentrations compared to various plant protein sources, such as
soy, maize, wheat and gluten [25]. The amino acids contained in whey are absorbed and used more
efficiently compared to free amino acid solutions [26]. In addition, whey proteins contain higher
concentrations of branched-chain amino acids (BCAAs) (with a content equal to 26% approx.), that is,
leucine, isoleucine and valine, in relation to proteins originating from other sources [27]. All nine EAAs
(i.e., phenylalanine, valine, threonine, tryptophan, methionine, leucine, isoleucine, lysine and histidine)
cannot be synthesized de novo, therefore, they must be obtained through diet. They are involved in
several vital processes with tissue repair, energy production, immune function and nutrient absorption
among others. BCAAs also participate in protein and glucose homeostasis, body weight regulation
and lipid metabolism [28–31]. In spite of their positive action, the excessive uptake of BCAAs can
lead to differential pathological conditions as cardiovascular and neurological disorders [32–34]. It has
been mentioned that plasma amino acid profile can be changed due to lipid accumulation and insulin
resistance (IR) [35–37]. In particular, BCAAs levels have been found to be elevated in obese humans and
animal models [38–40] and are implicated in IR, probably through the upregulation of the mammalian
target of rapamycin (mTOR) complex 1 [41].
mTOR is a serine/threonine protein kinase that regulates diverse cellular processes, such as cell
growth and proliferation, autophagy and protein synthesis [42,43]. It is established that there are two
complexes of mTOR with distinct functions, the mTOR complex 1 (mTORC1) and 2 (mTORC2) [44–46].
While mTORC2 is implicated in cell proliferation and survival, mTORC1 is generally associated
with cell growth and metabolism [47,48]. Specifically, it has been reported that mTORC1 promotes
translation, transcription, lipid biosynthesis, whereas it inhibits autophagy [49–51]. mTORC1 regulates
its function in response to various signals, such as growth factors, energy stress and amino acids [51,52].
Two well-known substrates of mTORC1 are p70-S6 Kinase 1 (p70-S6K1) and eukaryotic initiation
factor 4E-binding protein 1 (4EBP1), which, when phosphorylated, enhance mRNA translation and,Antioxidants 2019, 8, 71 3 of 15
subsequently, protein synthesis [51]. The adaptor p62 is an important signaling molecule for the
physiological function of mTORC1 since it interacts with signaling intermediates and activates
substrate p70-S6K1 and 4EBP1 [53,54]. It is a molecule of utmost importance that interacts with the
raptor, binds at the Rag proteins and contributes to their translocation in the lysosome [55]. Therefore,
it seems to be a key regulator of mTOR activation. Taking into account the central role of mTORC1 on
cell growth and metabolism, mTORC1 has been associated with pathological conditions like cancer,
aging and metabolic diseases where growth and homeostasis are disrupted. The overactivation of
mTORC1 by overfeeding may be a crucial factor for diabetes onset [51].
Based on the above, it becomes evident that whey protein as a substance rich in amino acids
could exert its beneficial action by affecting the aforementioned molecular pathway. To our knowledge,
there are no studies that approach the putative relation of whey protein with mTOR. Therefore,
the objective of the present investigation was to examine the impact of sheep/goat whey protein on
plasma amino acid levels in rats and to test the hypothesis that the pathway of mTOR activation is
positively regulated in rat tissues. The obtained results could lead to the adoption of novel nutritional
interventions alleviating pathologies that are related to mTOR.
2. Materials and Methods
2.1. Sheep/Goat Whey Protein Preparation
Sheep/goat whey protein was obtained from the Hellenic Protein S.A (Athens, Greece) and its
content was 80 g in 100 g. It consists of β-lactoglobulin (47 g/100 g), α-lactalbumin (14 g/100 g),
glycomacropeptide (13 g/100 g) and serum albumin (3 g/100 g). Its nutritional content consists of
proteins (80 g/100 g), carbohydrates (10 g/100 g), fats (4 g/100 g), sodium (157 mg/100 g), potassium
(397 mg/100 g), calcium (415 mg/100 g), phosphorus (319 mg/100 g) and magnesium (73 mg/100 g).
2.2. Experimental Animals
Twelve six-month-old male Wistar rats weighing 470 ± 30 g were used for this experiment, which
was performed in the Veterinary Medicine School of Aristotle University of Thessaloniki in accordance
to the Helsinki Declaration and National standards (Permission code EL54BIO10). The experimental
protocol was approved by the National Veterinary Administration authorities on 13 July 2018 (Licence
No.: 135973/851). The animals were housed in cages individually under controlled temperature
(20–22 ◦ C) and humidity (50–70%) and a 12-h light/dark cycle. Furthermore, they were acclimated
for one week in the animal facility before the experiment took place. All animals were treated in
accordance with the guiding principles of the European Community Council Directive (89/609/EEC)
for the care and use of laboratory animals.
2.3. Study Design
The animals were randomly divided into two groups (i.e., 6 rats per group) as follows: the control
group was fed with standard commercial diet containing corn, soybean meal, barley, bran, milk paste
and molasses (purchased from Viozois S. A. Ioannina, Greece) and the experimental group was fed
with standard commercial diet plus sheep/goat whey protein in a dose equal to 1 g/kg of body
weight/day dissolved in drinking water. The exact daily volume of drinking water for each rat was
determined and standardized by preliminary experiments in order to be sure that the rats consume
the desired concentration of the control and experimental feed. The duration of the experiment was
28 days. Whey protein was selected because it contains higher amounts of BCAAs compared to other
protein sources and, according to previous studies, high protein intake ameliorates IR [56–59] caused
by disturbances in BCAAs catabolism due to attenuated branched-chain ketoacid dehydrogenase
complex (BCKDC) activity [28,60]. The general health of the animals was observed daily. At the end of
the treatment period, all animals were anesthetized with diethyl ether and blood samples were drawn
by cardiac puncture. The animals died by exsanguination. Liver and quadriceps muscle tissues wereAntioxidants 2019, 8, 71 4 of 15
Antioxidants 2019, 8, x FOR PEER REVIEW 4 of 15
also excised, snapped-frozen in liquid nitrogen and stored at −80 ◦ C until further analysis. The study
design is presented in Figure 1.
Figure 1. The study design. The control group was administered with the standard commercial diet;
the experimental
Figure 1. The studygroup wasThe
design. administered withwas
control group theadministered
standard commercial diet plus commercial
with the standard the sheep/goat
diet;
whey protein (1 g/kg
the experimental of body
group was weight/day)
administereddissolved
with the in drinkingcommercial
standard water. Animals
diet maintained on their
plus the sheep/goat
respective diet (1
whey protein forg/kg
28 days. Theweight/day)
of body downward arrows indicate
dissolved the time
in drinking of blood
water. and tissue
Animals sampling.
maintained on their
respective diet for 28 days. The downward arrows indicate the time of blood and tissue sampling.
2.4. Metabolomics
2.4. Metabolomics
2.4.1. Reagents and Materials
2.4.1.LC/MS
Reagentsgrade Acetonitrile (ACN), methanol (MeOH) were obtained from HiperSolv
and Materials
CHROMANORM (VWR, West Sussex, UK). Ammonium formate (NH4 HCO2 ), ammonium acetate
LC/MS grade Acetonitrile (ACN), methanol (MeOH) were obtained from HiperSolv
(NH4 OAc) and formic acid (HCOOH) were purchased from Sigma Aldrich (Sigma Aldrich, GmbH,
CHROMANORM (VWR, West Sussex, UK). Ammonium formate (NH 4HCO2), ammonium acetate
Taufkirchen, Germany). Distilled water (18.2 MΩ) for chromatographic separation was purified
(NH4OAc) and formic acid (HCOOH) were purchased from Sigma Aldrich (Sigma Aldrich, GmbH,
in a Milli-Q device (Millipore, Merch Darmstadt, Germany). The standards were of analytical or
Taufkirchen, Germany). Distilled water (18.2 MΩ) for chromatographic separation was purified in a
higher grade and for this study were obtained from various vendors. Anti-phospho-p70 S6 Kinase
Milli-Q device (Millipore, Merch Darmstadt, Germany). The standards were of analytical or higher
(Thr389) and anti-rabbit secondary antibody were purchased from Thermo Fisher Scientific (Invitrogen,
grade and for this study were obtained from various vendors. Anti-phospho-p70 S6 Kinase (Thr389)
New Delhi, India). The Glyceraldehyde 3-phosphate dehydrogenase (GAPDH) antibody was obtained
and anti-rabbit secondary antibody were purchased from Thermo Fisher Scientific (Invitrogen, New
from Sigma-Aldrich (St. Louis, MO, USA).
Delhi, India). The Glyceraldehyde 3-phosphate dehydrogenase (GAPDH) antibody was obtained
from Blood
2.4.2. Sigma-Aldrich (St. Louis, MO, USA).
Preparation
2.4.2.Whole
Bloodblood was collected in EDTA tubes, centrifuged immediately (1370× g, 10 min, 4 ◦ C) and
Preparation
the supernatant (i.e., the plasma) was collected and stored at −80 ◦ C. Prior to analysis, the samples were
thawed Whole blood was as
and pretreated collected
follows:in150
EDTAµL oftubes, centrifuged
ice solvent immediately
mixture (1370× g,70:15:15
(ACN:H2 O:MeOH, 10 min, v/v)
4 °C)was
and
the supernatant (i.e., the plasma) was collected and stored at −80 °C. Prior to analysis,
added to 50 µL of plasma and the mixture was vortexed for 5 min for protein precipitation. The samples the samples
weresubsequently
were thawed and pretreated
centrifugedas(10,000
follows:× g,150
15 μL of4ice
min, solvent
◦ C) mixture
and the (ACN:H
supernatant was2O:MeOH,
transferred70:15:15 v/v)
into a vial
was
for added to
analysis. A 50 μL ofsample
pooled plasma and
was the mixture
prepared was vortexed
by mixing an equalfor 5 minoffor
volume protein
each of theprecipitation. The
test samples and
samples were subsequently centrifuged (10,000× g, 15 min, 4 °C) and the supernatant
was used as a quality control (QC) sample for the ultra-performance liquid chromatography-tandem was transferred
into aspectrometry
mass vial for analysis. A pooled sample
(UPLC-MS/MS) was prepared
for targeted analysis. by mixing an equal volume of each of the test
samples and was used as a quality control (QC) sample for the ultra-performance liquid
chromatography-tandem mass spectrometry (UPLC-MS/MS) for targeted analysis.
2.4.3. LC-MS/MS Analysis
For the metabolomic analysis, a previous reported hydrophilic interaction liquid
chromatography-tandem mass spectrometry (HILIC MS/MS) method was applied and separation
was performed on an Acquity- UPLC System (Waters Corporation, Millford, USA) by a BEH AmideAntioxidants 2019, 8, 71 5 of 15
2.4.3. LC-MS/MS Analysis
For the metabolomic analysis, a previous reported hydrophilic interaction liquid
chromatography-tandem mass spectrometry (HILIC MS/MS) method was applied and separation
was performed on an Acquity- UPLC System (Waters Corporation, Millford, USA) by a BEH Amide
column (2.1 mm × 150 µm, 1.7 µm) protected by an Acquity Van-Guard pre-column (Waters Ltd.,
Elstree, UK). The column temperature was maintained at 40 ◦ C [61]. The mobile phase was a mixture
of (A) ACN:H2 O, 95:5 v/v and (B) H2 O:ACN, 70:30 v/v both with a final ammonium formate buffer
concentration of 10 mM. Elution was performed with a gradient program.
The MS/MS method monitors 101 multiple reaction monitoring (MRM) transition for the detection
and quantitation of 101 hydrophilic metabolites comprising essential and non-essential amino acids,
amines, organic acids and other small ionizable endogenous metabolites. All MS data were acquired
on a XEVO TQD System (Waters Corporation, Milford, MA, USA) operating by the polarity switching
mode. MS parameters were optimized for each individual analyte in terms of parent/daughter ion,
dwell time, cone and collision energy (V). It has been shown that the method is sensitive, robust and
efficient over a wide range of concentrations.
2.4.4. Western Blot Analysis of p70-S6K1 (Thr389) Expression
The tissue samples were thawed and prepared as follows: 100 mg of tissue was homogenized
with 500 µL of phosphate buffered saline [PBS (0.01 M, pH = 7.4)] and a cocktail of protease
inhibitor tablet (Complete™ mini protease inhibitors, Roche, Basel, Switzerland) was added.
The homogenate was vigorously vortexed and a brief sonication treatment on ice was applied.
The homogenate was then centrifuged (10,000× g, 15 min, 4 ◦ C) and the supernatant (i.e., the tissue
lysate) was collected. In order to determine the expression levels of p70-S6K1, 40 µg of protein,
as measured using the Bradford assay were used. Tissue lysates were separated by sodium dodecyl
sulfate-polyacrylamide gel electrophoresis (SDS-PAGE) using an 8% polyacrylamide gel. Proteins
were then transferred onto a polyvinylidene difluoride membrane (PVDF). The membranes were
blocked overnight with 5% non-fat milk in a buffer (13 mM of Tris, 150 mM of NaCl, pH = 7.5)
containing 0.2% Tween-20. Then, they were probed with a polyclonal rabbit anti-human/mouse/rat
phospho-p70 S6 Kinase (Thr389) (1:600) primary antibody for 1 h at room temperature (RT).
The membranes were then incubated with a polyclonal horseradish peroxidase conjugated goat
anti-rabbit secondary antibody (1:5000) for 30 min at RT. The membranes were reprobed with a
monoclonal anti-turkey/monkey/canine/chicken/human/bovine/rat/mouse/mink/rabbit/hamster
glyceraldehyde 3-phosphate dehydrogenase (GAPDH) antibody (1:10,000) as an internal control.
The optical density of the protein bands was measured by the Alpha View quantification software
(Alpha Innotech, San Jose, CA, USA).
2.4.5. Quantitation of Metabolites and Statistical Analysis
Data acquisition and the evaluation of chromatograms were performed by Waters MassLynx
and TargetLynx version 4.1 (Micromass, Manchester, UK) software (SCN 882). The quantitative
determination of endogenous compounds was performed by an external calibration; details on the
method have been previously published [61]. All test samples, QCs and calibration standards were
analyzed in one analytical batch. QC samples were analyzed every ten test samples. Calibration
standards were analyzed in the beginning and the end of the analytical sequence as previously
reported [51]. Multivariate statistical analysis was performed using the Simca-P v13.0 software
(UMETRICS AB, Malmö, Sweden) and SPSS software version 21.0 (SPSS Inc., Chicago, IL, USA).
Orthogonal Partial Least Squared Discriminant Analysis (OPLS-DA) was used for modeling
differences between the metabolic profiles of plasma samples from rats subjected to whey feeding
conditions and for statistical evaluation of the models. Additionally, one-way ANOVA was applied
in order to compare the means between the control and the whey protein feeding group. DifferencesAntioxidants 2019, 8, 71 6 of 15
were considered significant at p < 0.05 with the alpha level set at 0.025. All results are expressed as
mean ± SEM.
3. Results
Antioxidants
3.1. Effects 2019, 8, x FOR PEER
of Sheep/Goat WheyREVIEW
Protein on Plasma Amino Acid Levels 6 of 15
In total, 22
In total, 22amino
aminoacids
acidswere
were detected
detected in both
in both the control
the control and whey
and whey proteinprotein
fed ratsfed
in rats in the
the present
present study in order to evaluate the relationship between amino acid profile
study in order to evaluate the relationship between amino acid profile and mTOR activity after the and mTOR activity
after the administration
administration of sheep/goat
of sheep/goat whey protein
whey protein in vivo.in Chromatographic
vivo. Chromatographic peak peak
areasareas
werewereusedused
for
for multivariate statistical analysis in order to find any differentiation between
multivariate statistical analysis in order to find any differentiation between the studied groups. the studied groups.
Discrimination
Discrimination of of the
the sample
sample groups
groups waswas already
already revealed
revealed byby principal
principal component
component analysis
analysis (PCA)
(PCA)
(data
(datanot
not shown),
shown), however,
however,the thepartial
partialleast
leastdiscriminant
discriminantanalysis
analysiswas
was further
further performed
performed to to maximize
maximize
the
the group
group differentiation
differentiationand andtoto identify
identify potential
potential biomarkers
biomarkers related
related to
to mTOR
mTOR activity
activity after
after different
different
feeding
feeding conditions. The OPLS-DA provided a clear separation between plasma samples from
conditions. The OPLS-DA provided a clear separation between plasma samples from control
control
and whey protein fed rats. In Figure 2, 9 out of 12 samples can be seen due
and whey protein fed rats. In Figure 2, 9 out of 12 samples can be seen due to the limited sample to the limited sample
volume.
volume. TheThep-value
p-valueofofthetheCross
CrossValidated
Validated ANOVA
ANOVA Analysis (CV(CV
Analysis Analysis) waswas
Analysis) 0.007, indicating
0.007, the
indicating
statistical significance
the statistical of theofinvestigated
significance the investigatedmodels. Additional
models. statistical
Additional characteristics
statistical of the model
characteristics of the
R2Xcum and R2Ycum were 0.752 and 0.983, respectively, showing how
model R2Xcum and R2Ycum were 0.752 and 0.983, respectively, showing how well the model well the model explains the
variation in X and Y, respectively. The Q2Y that represents the quality and predictive
explains the variation in X and Y, respectively. The Q2Y that represents the quality and predictive power of the
model
powerwasof the0.95.
model was 0.95.
Figure 2. The Orthogonal Partial Least Squared Discriminant Analysis (OPLS-DA) score plot of plasma
Figure 2. The Orthogonal Partial Least Squared Discriminant Analysis (OPLS-DA) score plot of
samples of whey protein fed rats against controls.
plasma samples of whey protein fed rats against controls.
Additionally, an unpaired student’s t-test was performed to establish and confirm the significance
Additionally,
of important an indicated
variables unpaired by student’s
OPLS-DA.t-test
Withwas performed
regard to establish
to the amino and confirm
acid contribution the
to that
significance of important variables indicated by OPLS-DA. With regard to the
differentiation, reduced levels were observed for the majority of them in the whey protein fed group amino acid
contribution
compared to that
to the differentiation,
control. Specifically,reduced levels were arginine,
3-methylhistidine, observedasparagine,
for the majority of them
aspartic acid,inglutamine,
the whey
protein fed group compared to the control. Specifically, 3-methylhistidine, arginine,
isoleucine, leucine, lysine, methionine, ornithine, phenylalanine, threonine, tryptophan, tyrosine and asparagine,
aspartic
valine acid,were
levels glutamine,
reduced isoleucine, leucine,
significantly lysine,
by 37, methionine,
31, 33, ornithine,
29, 37, 38, 34, phenylalanine,
24, 35, 48, 40, 49, 45, 52threonine,
and 22%,
tryptophan, tyrosine and valine levels were reduced significantly by 37, 31, 33, 29, 37, 38, 34, 24, 35,
48, 40, 49, 45, 52 and 22%, respectively. On the contrary, no significant alterations were observed in
the levels of alanine, glutamic acid, glycine, proline, sarcosine, serine and taurine between the two
groups (Figure 3).Antioxidants 2019, 8, 71 7 of 15
respectively. On the contrary, no significant alterations were observed in the levels of alanine, glutamic
Antioxidants
acid, glycine,2019, 8, x FORsarcosine,
proline, PEER REVIEW
serine and taurine between the two groups (Figure 3). 7 of 15
A
Control group
150.0
Whey group
Concentration (uM/L)
100.0
*
*
50.0
* *
*
*
*
.0
B
1000.0
Control group
Whey group
800.0
Concentration (uM/L)
600.0
400.0
200.0
.0
Figure 3. The boxplots illustrating the effects of sheep/goat whey protein administration on the
Figureamino
plasma 3. Theacid
boxplots illustrating
levels of the effects of sheep/goat
rats. (A): 3-methylhistidine, arginine,whey proteinaspartic
asparagine, administration on the
acid, ornithine,
plasma amino
sarcosine, acidglutamic
alanine, levels of acid,
rats. (A): 3-methylhistidine,
lysine and methionine arginine, asparagine,
(B): glutamine, aspartic
glycine, acid, ornithine,
isoleucine, leucine,
sarcosine, alanine,
phenylalanine, glutamic
proline, acid,
serine, lysinethreonine,
taurine, and methionine (B): glutamine,
tryptophan, glycine,
tyrosine and isoleucine,
valine. leucine,
*: Statistically
phenylalanine, proline, serine, taurine, threonine,
significant compared to the control group (p < 0.05). tryptophan, tyrosine and valine. *: Statistically
significant compared to the control group (p < 0.05).
3.2. Effects of Sheep/Goat Whey Protein on Liver and Muscle p70-S6K Expression
3.2. With
Effectsrespect
of Sheep/Goat
to liverWhey Protein
p70-S6K on Liver and
expression, Muscle
it was p70-S6K
reduced byExpression
32.5% in the experimental group
compared to the control group. On the contrary, no significant effect
With respect to liver p70-S6K expression, it was reduced by 32.5% of sheep/goat whey protein
in the experimental on
group
muscle
comparedp70-S6K
to theexpression was observed
control group. (Figure 4).
On the contrary, no significant effect of sheep/goat whey protein on
muscle p70-S6K expression was observed (Figure 4).Antioxidants 2019, 8, 71 8 of 15
Antioxidants 2019, 8, x FOR PEER REVIEW 8 of 15
Figure Representative
Figure4. 4. western
Representative blots illustrating
western the effect the
blots illustrating of sheep/goat
effect of whey protein administration
sheep/goat whey protein
on the expression of p70-S6 Kinase (p70-S6K) in (A) liver and (B) quadriceps
administration on the expression of p70-S6 Kinase (p70-S6K) in (A) liver and (B) quadriceps muscle of muscle
4 rats.
Glyceraldehyde 3-phosphate
of 4 rats. Glyceraldehyde dehydrogenase
3-phosphate (GAPDH)
dehydrogenase was used
(GAPDH) as the
was used loading
as the control
loading controlfor
for
normalization.
normalization. (C) The results are presented mathematically after the quantification through
(C) The results are presented mathematically after the quantification through
densitometry.
densitometry.*:*:Statistically
Statisticallysignificant
significantcompared
comparedtotothe
thecontrol
controlgroup
group(p(pAntioxidants 2019, 8, 71 9 of 15
decreased the amino acid profile in plasma. This is of remarkable biological interest as, according
to other relevant studies, elevated plasma amino acid levels and particularly BCAAs and aromatic
amino acid (AAA) levels have been linked to IR, type 2 diabetes mellitus (T2DM), cardiovascular
diseases (CVD) and obesity [39–41,68] AAAs (i.e., phenylalanine, tryptophan, tyrosine) and BCAAs
are considered biomarkers of metabolic disorders since it has been proposed that they predict T2DM
and CVD for up to 12 years before disease onset and that they are correlated with metabolic syndrome
(MS) diagnosis within 4 years [29,36,69]. Thus, nutritional intervention strategies based on sheep/goat
whey protein appear to be a promising approach for the prevention of relevant disorders. A possible
mechanism by which amino acids, and especially BCAAs, are implicated in insulin resistance (IR)
might be the upregulation of mTORC1 through the phosphorylation of insulin receptor substrate 1
(IRS-1) [41].
4.2. mTOR Regulation by Amino Acids
Amino acids are important regulators of mTORC1 through Rag GTPases. When amino acids are
present, Rag GTPases are converted into an active configuration and then interact with the raptor,
promoting the clustering of mTORC1 on the lysosomal surface [70–72]. This localization allows
mTORC1 to interact with the small GTPase Ras homolog enriched in brain (Rheb), which stimulates
mTORC1 activity [70,73,74]. According to our results, p70-S6K1 (Thr389) expression was found
decreased in the liver, whilst it remained unaltered in the skeletal muscle following whey protein
administration. This finding indicates that mTORC1 is not overactivated and, thus, its harmful and
disease-related action seems to be ameliorated due to the protective effect of whey protein. To this
end, it has been reported that despite the positive role of mTORC1, its overactivation could lead
to pathological conditions that are associated with growth and homeostasis dysregulation, namely,
specific cancer types, metabolic disorders and aging [51]. mTORC1 regulates lipid accumulation and
promotes the formation of white adipose tissue (WAT). The formation of WAT was found reduced
in mice following an adipocyte-specific deletion of Raptor [75]. Furthermore, it has been shown that
tuberous sclerosis complex 2 (TSC2)-deficient mouse embryo fibroblasts (MEFs) lead to increased
mTORC1 activity and exhibited enhanced adipogenesis [76]. The overactivation of mTORC1 leads to
lipogenesis in WAT, muscle and liver, which finally contributes to IR [51]. mTORC1 also over regulates
fatty acid synthase, an enzyme that favors the rapid increase of cancer cells [77]. Being on the same
page, the continuous activation of mTORC1 induces tumorigenesis by repressing autophagy, which
normally exerts a tumor suppressive role [78–80]. Finally, mTORC1 inhibition may counterbalance the
sources of cellular aging and activate repair mechanisms. To this end, it has been found that lifespan of
yeasts, flies and worms was extended after mTORC1 inhibition [81–84]. This lifespan extension could
be attributed to the enhanced autophagy following mTORC1 inhibition [85,86].
4.3. Effects of Sheep/Goat Whey Protein on Plasma Amino Acid Levels and mTOR Activation
The present study describes the outstanding effect of whey protein along with its molecular
background that has not been previously reported again. Intriguingly, it reduces the amino acid
profile of plasma and it partially prevents the p70-S6K1 (Thr389) expression, thus leading to the
putative inhibition of the adverse, disease-related effects induced by mTOR overactivation. This
beneficial action of whey protein administration could be aptly parallelized with the mode of action of
intermittent fasting (Figure 5). With respect to its definition, intermittent fasting refers to the eating
regimen characterized by cycles of fasting and non-fasting during certain time periods. Recent scientific
evidence supports the notion that during intermittent fasting, there is a metabolic switch leading to fatty
acid mobilization and protection against several pathologies [87]. Interestingly, during fasting, plasma
amino acids, as well as insulin levels are decreased [51,88]. The disturbance of the balance between food
intake and energy needs increases the adenosine monophosphate/adenosine triphosphate (AMP/ATP)
ratio, promoting the mTORC1 inhibition and autophagy activation [89]. Due to the above effects,
fasting is applied for the attenuation or the symptom alleviation of T2DM, cardiovascular diseases,Antioxidants 2019, 8, 71 10 of 15
Antioxidants 2019, 8, x FOR PEER REVIEW 10 of 15
neurodegenerative disorders, aging and abnormal weight loss [90–94]. Furthermore, fasting delays
the tumor onset, partly preventing cancer metastasis [95]. It acts protectively for normal cells against
metastasis [95]. It acts protectively for normal cells against the adverse effects of chemotherapy [96],
the adverse effects of chemotherapy [96], whereas it extends the lifespan in lower species, such as
whereas it extends the lifespan in lower species, such as nematodes [97]. Therefore, our finding
nematodes [97]. Therefore, our finding implies that sheep/goat whey protein could potentially be
implies that sheep/goat whey protein could potentially be used for building eating habits with a
used for building eating habits with a similar pattern of action with fasting in order to help patients
similar pattern of action with fasting in order to help patients that suffer from disorders that mTORC1
that suffer from disorders that mTORC1 overactivation is implicated in (Figure 5).
overactivation is implicated in (Figure 5).
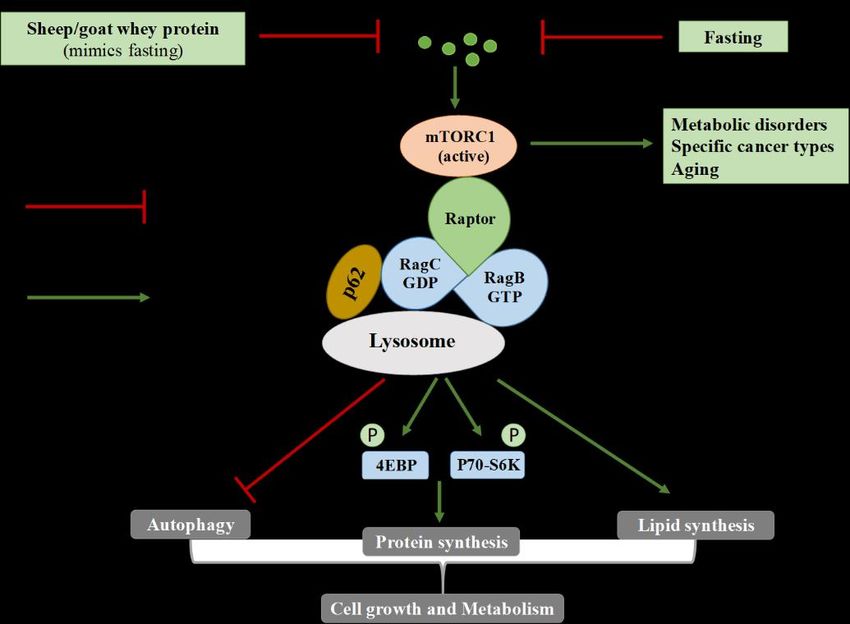
Figure 5. The molecular pathway of amino-acid-related (over) activation of mammalian target of
Figure 5. The molecular pathway of amino-acid-related (over) activation of mammalian target of
rapamycin complex 1 (mTORC1) and the beneficial action of sheep/goat whey protein administration
rapamycin complex 1 (mTORC1) and the beneficial action of sheep/goat whey protein administration
that mimics fasting. mTOR regulates diverse cellular processes, such as cell growth and proliferation,
that mimics fasting. mTOR regulates diverse cellular processes, such as cell growth and proliferation,
autophagy and protein synthesis and exists in two forms; mTORC1 and mTORC2. Two well-known
autophagy and protein synthesis and exists in two forms; mTORC1 and mTORC2. Two well-known
substrates of mTORC1 are p70-S6 Kinase 1 (p70-S6K1), whose expression was measured in the
substrates of mTORC1 are p70-S6 Kinase 1 (p70-S6K1), whose expression was measured in the present
present study and the eukaryotic initiation factor 4E-binding protein 1 (4EBP1). When they are
study and the eukaryotic initiation factor 4E-binding protein 1 (4EBP1). When they are
phosphorylated, mRNA translation and, subsequently, protein synthesis are enhanced. The adaptor
phosphorylated, mRNA translation and, subsequently, protein synthesis are enhanced. The adaptor
p62 is an important signaling molecule for the physiological function of mTORC1 since it interacts with
p62 is an important signaling molecule for the physiological function of mTORC1 since it interacts
signaling intermediates and activates S6K1 and 4EBP1. Whey protein, similar to fasting, inhibits the
with signaling intermediates and activates S6K1 and 4EBP1. Whey protein, similar to fasting, inhibits
overactivation of mTOR and, therefore, exerts a potential protective role against diverse pathologies.
the overactivation of mTOR and, therefore, exerts a potential protective role against diverse
pathologies.
5. Conclusions
Amino acids are significant activators of mTORC1, an important factor that regulates cell growth
5. Conclusions
and the metabolism. However, its overactivation leads to metabolic disorders, several cancer types and
aging.Amino acids are significant
Administration activators
of sheep/goat wheyofprotein
mTORC1, an important
in rats factoracid
reduces amino that levels
regulates cell growth
in plasma and
and the metabolism. However, its overactivation leads to metabolic disorders, several
inactivates mTORC1 in the liver, therefore, it appears that it acts protectively. Specifically, the levels cancer types
of
and
22 aging.amino
plasma Administration
acids wereof sheep/goat
examined andwhey
15 of protein
them were in rats reduces
reduced amino acid
significantly levels
in the in plasma
experimental
and inactivates
group comparedmTORC1 in thegroup.
to the control liver, therefore, it appears
The reduction that itranged
percentage acts protectively.
from 29% to Specifically,
52%. Among the
levels the
them, of 22 plasma
BCAAs amino
(i.e., acids leucine,
isoleucine, were examined and 15elevated
valine) whose of themlevels
wereare reduced significantly
implicated in the
in IR probably
experimental group compared to the control group. The reduction percentage
through the upregulation of mTOR complex 1 are included. Furthermore, sheep/goat whey protein ranged from 29% to
52%. Among them, the BCAAs (i.e., isoleucine, leucine, valine) whose elevated
in liver reduced the p70-S6K1 (Thr389) expression by 32.5% in the experimental group compared levels are implicated
in the
to IR probably through
control group, theleading
thus upregulation
to theof mTOR complex
putative inhibition1 of
arethe
included.
adverse, Furthermore,
disease-relatedsheep/goat
effects
whey protein in liver reduced the p70-S6K1 (Thr389) expression by 32.5%
induced by mTOR overactivation. The mode of its action appears to mimic the beneficial impact in the experimental groupof
compared to the control group, thus leading to the putative inhibition of the adverse,
fasting on health. This is an intriguing piece of evidence indicating that sheep/goat whey protein disease-related
effects induced by mTOR overactivation. The mode of its action appears to mimic the beneficial
impact of fasting on health. This is an intriguing piece of evidence indicating that sheep/goat whey
protein could potentially be used as an alternative and promising nutritional intervention for the
prevention or alleviation of diseases associated with homeostasis and growth disturbance.Antioxidants 2019, 8, 71 11 of 15
could potentially be used as an alternative and promising nutritional intervention for the prevention
or alleviation of diseases associated with homeostasis and growth disturbance.
Author Contributions: Investigation, E.K.; methodology, C.V., G.T. and I.T.; supervision, D.K.; visualization, E.K.;
writing—original draft, E.K.; writing—review and editing, A.V.
Funding: The present study was supported by the State Scholarships Foundation (IKY) and funded by the
action “Enhancement of post-doctoral researchers” from the resources of the European Program “Development of
Human resources, Education and Life-Long Learning” co-funded by the European Social Fund with Funding
number 5001552.
Conflicts of Interest: The authors declare no conflict of interest. The funders had no role in the design of the
study; in the collection, analyses, or interpretation of data; in the writing of the manuscript, or in the decision to
publish the results.
References
1. Barłowska, J.; Szwajkowska, M.; Litwińczuk, Z.; Król, J. Nutritional value and technological suitability of
milk from various animal species used for dairy production. Compr. Rev. Food Sci. Food Saf. 2011, 10, 291–302.
[CrossRef]
2. Visentin, G.; Penasa, M.; Gottardo, P.; Niero, G.; Isaia, M.; Cassandro, M.; De Marchi, M. Milk coagulation
properties of cattle breeds reared in Alpine area. Poljoprivreda 2015, 21, 237–240. [CrossRef]
3. Niero, G.; Penasa, P.; Gottardo, M.; Cassandro, M.; De Marchi, M. Selecting the most informative mid-infrared
spectra wavenumbers to improve the accuracy of prediction models for detailed milk protein content.
J. Dairy Sci. 2015, 99, 1–6. [CrossRef] [PubMed]
4. Yeung, S.E.; Hilkewich, L.; Gillis, C.; Heine, J.A.; Fenton, T.R. Protein intakes are associated with reduced
length of stay: A comparison between Enhanced Recovery After Surgery (ERAS) and conventional care after
elective colorectal surgery. Am. J. Clin. Nutr. 2017, 106, 44–51. [PubMed]
5. Cooper, G.M.; Sunderland, M.A. The Cell: A Molecular Approach, 2nd ed.; Sinauer Associates: Sunderland,
MA, USA, 2000.
6. Berg, J.M.; Tymoczko, J.L.; Stryer, L. Protein Structure and Function. In Biochemistry, 5th ed.; W.H. Freeman:
New York, NY, USA, 2002.
7. Schroeder, J.R.; Cavacini, L. Structure and Function of Immunoglobulins. J. Allergy Clin. Immunol. 2010, 125,
S41–S52. [CrossRef] [PubMed]
8. Mariotti, F. Vegetarian and Plant-Based Diets in Health and Disease Prevention, 1st ed.; Academic Press:
Cambridge, MA, USA, 2017; pp. 621–642.
9. Haug, A.; Høstmark, A.T.; Harstad, O.M. Bovine milk in human nutrition—A review. Lipids Health Dis. 2007,
6, 25. [CrossRef]
10. Visentin, G.; Penasa, M.; Niero, G.; Cassandro, M.; De Marchi, M. Phenotypic characterisation of major
mineral composition predicted by mid-infrared spectroscopy in cow milk. Ital. J. Anim. Sci. 2017, 17, 549–556.
[CrossRef]
11. Gaucheron, F. The minerals of milk. Reprod. Nutr. Dev. 2005, 45, 473–483. [CrossRef]
12. Kelemen, L.E.; Kushi, L.H.; Jacobs, D.R.; Cerhan, J.R. Associations of dietary protein with disease and
mortality in a prospective study of postmenopausal women. Am. J. Epidemiol. 2005, 161, 239–249. [CrossRef]
13. Altorf-van der Kuil, W.; Engberink, M.F.; Brink, E.J.; van Baak, M.A.; Bakker, S.J.; Navis, G.; van ’t Veer, P.;
Geleijnse, J.M. Dietary protein and blood pressure: A systematic review. PLoS ONE 2010, 5, e12102.
[CrossRef]
14. Richter, C.K.; Skulas-Ray, A.C.; Champagne, C.M.; Kris-Etherton, P.M. Plant protein and animal proteins:
Do they differentially affect cardiovascular disease risk? Adv. Nutr. 2015, 6, 712–728. [CrossRef] [PubMed]
15. Chauveau-Duriot, B.; Doreau, M.; Nozière, P.; Graulet, B. Simultaneous quantification of carotenoids, retinol,
and tocopherols in forages, bovine plasma, and milk: Validation of a novel UPLC method. Anal. Bioanal. Chem.
2010, 397, 777–790. [CrossRef]
16. Velázquez Vázquez, C.; Villa Rojas, M.G.; Álvarez Ramírez, C.; Chávez-Servín, J.L.; García-Gasca, T.;
Ferriz Martínez, R.A.; Garcìa, O.P.; Rosado, J.L.; López-Sabater, C.M.; Castellote, A.I.; et al. Total phenolic
compounds in milk from different species. Design of an extraction technique for quantification using the
Folin-Ciocalteu method. Food Chem. 2015, 176, 480–486. [CrossRef] [PubMed]Antioxidants 2019, 8, 71 12 of 15
17. Pihlanto, A. Antioxidative peptides derived from milk proteins. Int. Dairy J. 2006, 16, 1306–1314. [CrossRef]
18. Niero, G.; Currò, S.; Costa, A.; Penasa, M.; Cassandro, M.; Boselli, C.; Giangolini, G.; De Marchi, M.
Phenotypic characterization of total antioxidant activity of buffalo, goat, and sheep milk. J. Dairy Sci. 2018,
101, 4864–4868. [CrossRef] [PubMed]
19. Kerasioti, E.; Stagos, D.; Priftis, A.; Aivazidis, S.; Tsatsakis, A.M.; Hayes, A.W.; Kouretas, D. Antioxidant
effects of whey protein on muscle C2C12 cells. Food Chem. 2014, 155, 271–278. [CrossRef] [PubMed]
20. Kerasioti, E.; Stagos, D.; Georgatzi, V.; Bregou, E.; Priftis, A.; Kafantaris, I.; Kouretas, D. Antioxidant effects
of sheep whey protein on endothelial cells. Oxid. Med. Cell Lonqev. 2016. [CrossRef] [PubMed]
21. Kerasioti, E.; Stagos, D.; Tzimi, A.; Kouretas, D. Increase in antioxidant activity by sheep/whey protein
through nuclear factor-like 2 (Nrf2) is cell type dependent. Food Chem. Toxicol. 2016, 97, 47–56. [CrossRef]
22. Kerasioti, E.; Stagos, D.; Tsatsakis, A.M.; Spandidos, D.A.; Taitzoglou, I.; Kouretas, D. Effects of sheep/goat
whey protein dietary supplementation on the redox status of rats. Mol. Med. Rep. 2018, 17, 5774–5781.
[CrossRef] [PubMed]
23. Kerasioti, E.; Kiskini, A.; Veskoukis, A.; Jamurtas, A.; Tsitsimpikoy, C.; Tsatsakis, A.M.; Koutedakis, Y.;
Stagos, D.; Kouretas, D.; Karathanos, V. Effect of a special carbohydrate-protein cake on oxidative stress
markers after exhaustive cycling in humans. Food Chem. Toxicol. 2012, 50, 2805–2810. [CrossRef]
24. Kerasioti, E.; Stagos, D.; Jamurtas, A.; Kiskini, A.; Koutedakis, Y.; Goutzourelas, N.; Pournaras, S.;
Tsatsakis, A.M.; Kouretas, D. Anti-inflammatory effects of a special carbohydrate-whey protein cake after
exhaustive cycling in humans. Food Chem. Toxicol. 2013, 61, 42–46. [CrossRef]
25. Walzem, R.L.; Dillard, C.J.; German, J.B. Whey components: Millennia of evolution create functionalities for
mammalian nutrition: What we know and what we may be overlooking. Crit. Rev. Food Sci. Nutr. 2002, 42,
353–375. [CrossRef]
26. Daenzer, M.; Petzke, K.J.; Bequette, B.J.; Metges, C.C. Whole-body nitrogen and splanchnic amino acid
metabolism differ in rats fed mixed diets containing casein or its corresponding amino acid mixture. J. Nutr.
2001, 131, 1965–1972. [CrossRef] [PubMed]
27. Bos, C.; Gaudichon, C.; Tomé, D. Nutritional and physiological criteria in the assessment of milk protein
quality for humans. J. Am. Coll. Nutr. 2000, 19, 191S–205S. [CrossRef] [PubMed]
28. Lynch, C.J.; Adams, S.H. Branched-chain amino acids in metabolic signalling and insulin resistance. Nat. Rev.
Endocrinol. 2014, 10, 723–736. [CrossRef] [PubMed]
29. Wang, T.J.; Larson, M.G.; Vasan, R.S.; Cheng, S.; Rhee, E.P.; McCabe, E.; Lewis, G.D.; Fox, C.S.; Jacques, P.F.;
Fernandez, C.; et al. Metabolite profiles and the risk of developing diabetes. Nat. Med. 2011, 17, 448–453.
[CrossRef] [PubMed]
30. Smilowitz, J.T.; Dillard, C.J.; German, J.B. Milk beyond essential nutrients: The metabolic food. Aust. J.
Dairy Technol. 2005, 60, 77–83.
31. Zemel, M.B. Role of calcium and dairy products in energy partitioning and weight management. Am. J.
Clin. Nutr. 2004, 79, 907S–912S. [CrossRef]
32. Garlick, P.J. The nature of human hazards associated with excessive intake of amino acids. J. Nutr. 2004, 134,
1633S–1639S. [CrossRef]
33. Sun, H.; Lu, G.; Ren, S.; Chen, J.; Wang, Y. Catabolism of branched-chain amino acids in heart failure: Insights
from genetic models. Pediatr. Cardiol. 2011, 32, 305–310. [CrossRef] [PubMed]
34. Nie, C.; He, T.; Zhang, W.; Zhang, G.; Ma, X. Branched Chain Amino Acids: Beyond Nutrition Metabolism.
Int. J. Mol. Sci. 2018, 19, 954. [CrossRef] [PubMed]
35. Würtz, P.; Mäkinen, V.P.; Soininen, P.; Kangas, A.; Tukiainen, T.; Kettunen, J.; Savolainen, M.J.; Tammelin, T.;
Viikari, J.S.; Rönnemaa, T.; et al. Metabolic signatures of insulin resistance in 7098 young adults. Diabetes
2012, 61, 1372–1380.
36. Yamakado, M.; Nagao, K.; Imaizumi, A.; Tani, M.; Toda, A.; Tanaka, T.; Hiroko, J.; Hiroshi, M.; Hiroshi, Y.;
Takashi, D.; et al. Plasma free amino acid profiles predict four-year risk of developing diabetes, metabolic
syndrome, dyslipidemia, and hypertension in Japanese population. Sci. Rep. 2015, 5, 11918. [CrossRef]
[PubMed]
37. Tai, E.S.; Tan, M.L.; Stevens, R.D.; Low, Y.L.; Muehlbauer, M.J.; Goh, D.L.; Ilkayeva, O.R.; Wenner, B.R.;
Bain, J.R.; Lee, J.J.; et al. Insulin resistance is associated with a metabolic profile of altered protein metabolism
in Chinese and Asian-Indian men. Diabetologia 2010, 53, 757–767. [CrossRef]Antioxidants 2019, 8, 71 13 of 15
38. Noguchi, Y.; Zhang, Q.W.; Sugimoto, T.; Furuhata, Y.; Sakai, R.; Mori, M.; Takahashi, M.; Kimura, T. Network
analysis of plasma and tissue amino acids and the generation of an amino index for potential diagnostic use.
Am. J. Clin. Nutr. 2006, 83, 513S–519S. [CrossRef] [PubMed]
39. She, P.; Horn, C.; Reid, T.; Hutson, S.; Cooney, R.; Lynch, C. Obesity-related elevations in plasma leucine are
associated with alterations in enzymes involved in branched-chain amino acid metabolism. Am. J. Physiol.
Endocrinol. Metab. 2007, 293, E1552–E1563. [CrossRef] [PubMed]
40. Newgard, C.; An, J.; Bain, J.; Muehlbauer, M.; Stevens, R.; Lien, L.; Haqq, A.M.; Shah, S.H.; Arlotto, M.;
Slentz, C.A.; et al. A branched-chain amino acid-related metabolic signature that differentiates obese and
lean humans and contributes to insulin resistance. Cell Metab. 2009, 9, 311–326. [CrossRef]
41. Yoon, M.S. The Emerging Role of Branched-Chain Amino Acids in Insulin Resistance and Metabolism.
Nutrients 2016, 8, 405. [CrossRef] [PubMed]
42. Schmelzle, T.; Hall, M.N. TOR, a central controller of cell growth. Cell 2000, 103, 253–262. [CrossRef]
43. Hay, N.; Sonenberg, N. Upstream and downstream of mTOR. Genes Dev. 2004, 18, 1926–1945. [CrossRef]
44. Yang, Q.; Guan, K.L. Expanding mTOR signaling. Cell Res. 2007, 17, 666–681. [CrossRef]
45. Hsu, P.P.; Kang, S.A.; Rameseder, J.; Zhang, Y.; Ottina, K.A.; Lim, D.; Peterson, T.R.; Choi, Y.; Gray, N.S.;
Yaffe, M.B.; et al. The mTOR-regulated phosphoproteome reveals a mechanism of mTORC1-mediated
inhibition of growth factor signaling. Science 2011, 332, 1317–1322. [CrossRef] [PubMed]
46. Yu, Y.; Yoon, S.O.; Poulogiannis, G.; Yang, Q.; Ma, X.M.; Villén, J.; Kubica, N.; Hoffman, G.R.; Cantley, L.C.;
Gygi, S.P.; et al. Phosphoproteomic analysis identifies Grb10 as an mTORC1 substrate that negatively
regulates insulin signaling. Science 2011, 332, 1322–1326. [CrossRef] [PubMed]
47. Loewith, R.; Jacinto, E.; Wullschleger, S.; Lorberg, A.; Crespo, J.L.; Bonenfant, D.; Oppliger, W.; Jenoe, P.;
Hall, M.N. Two TOR complexes, only one of which is rapamycin sensitive, have distinct roles in cell growth
control. Mol. Cell 2002, 10, 457–468. [CrossRef]
48. Laplante, M.; Sabatini, D.M. mTOR signaling in growth control and disease. Cell 2012, 149, 274–293.
[CrossRef] [PubMed]
49. Howell, J.J.; Manning, B.D. mTOR couples cellular nutrient sensing to organismal metabolic homeostasis.
Trends Endocrinol. Metabolism 2011, 22, 94–102.
50. Ma, X.M.; Blenis, J. Molecular mechanisms of mTOR-mediated translational control. Nat. Rev. Mol. Cell Biol.
2009, 10, 307–318. [CrossRef] [PubMed]
51. Zoncu, R.; Efeyan, A.; Sabatini, D.M. mTOR: From growth signal integration to cancer, diabetes and ageing.
Nat. Rev. Mol. Cell Biol. 2011, 12, 21–35. [CrossRef]
52. Bar-Peled, L.; Schweitzer, L.D.; Zoncu, R.; Sabatini, D.M. Ragulator is a GEF for the rag GTPases that signal
amino acid levels to mTORC1. Cell 2012, 150, 1196–1208. [CrossRef] [PubMed]
53. Fingar, D.C.; Salama, S.; Tsou, C.; Harlow, E.; Blenis, J. Mammalian cell size is controlled by mTOR and its
downstream targets S6K1 and 4EBP1/eIF4E. Genes Dev. 2002, 16, 1472–1487. [CrossRef]
54. Duran, A.; Amanchy, R.; Linares, J.F.; Joshi, J.; Abu-Baker, S.; Porollo, A.; Hansen, M.; Moscat, J.; Diaz-Meco, M.T.
p62 is a key regulator of nutrient sensing in the mTORC1 pathway. Mol. Cell 2011, 44, 134–146. [CrossRef]
[PubMed]
55. Moscat, J.; Diaz-Meco, M.T. p62 at the crossroads of autophagy, apoptosis, and cancer. Cell 2009, 137,
1001–1004. [CrossRef] [PubMed]
56. Wohlhuet, R.M.; Harper, A. Coinduction of rat liver branched chain alpha-keto acid dehydrogenase activities.
J. Biol. Chem. 1970, 245, 2391–2401.
57. Block, K.P.; Soemitro, S.; Heywood, B.W.; Harper, A.E. Activation of liver branched-chain alpha-keto acid
dehydrogenase in rats by excesses of dietary amino-acids. J. Nutr. 1985, 115, 1550–1561. [CrossRef] [PubMed]
58. Hauschildt, S.; Brand, K. Effects of branched-chain alpha-keto acids on enzymes involved in branched-chain
alpha-keto acid metabolism in rat tissues. J. Nutr. 1980, 110, 1709–1716. [CrossRef] [PubMed]
59. Hauschildt, S.; Luthje, J.; Brand, K. Influence of dietary nitrogen intake on mammalian branched-chain
alpha-keto acid dehydrogenase-activity. J. Nutr. 1981, 111, 2188–2194. [CrossRef] [PubMed]
60. Adams, S.H. Emerging perspectives on essential amino acid metabolism in obesity and the insulin-resistant
state. Adv. Nutr. 2011, 2, 445–456. [CrossRef] [PubMed]
61. Virgiliou, C.; Sampsonidis, I.; Gika, H.G.; Raikos, N.; Theodoridis, G.A. Development and validation of a
HILIC-MS/MS multitargeted method for metabolomics applications. Electrophoresis 2015, 36, 2215–2225.
[CrossRef] [PubMed]Antioxidants 2019, 8, 71 14 of 15
62. Gill, H.S.; Rutherford, K.J.; Cross, M.L. foods. In Functional Foods II—Claims and Evidence; Buttriss, J.,
Saltmarsh, M., Eds.; Royal Society of Chemistry: Cambridge, UK, 2000; Volume 248, pp. 82–90.
63. Pihlanto-Leppälä, A.; Korhonen, H. Bioactive peptides and proteins. Adv. Food Nutr. Res. 2003, 47, 175–276.
64. Farrel, H.M.; Jimenez-Florez, R.; Bleck, G.T.; Butler, J.E.; Creamer, L.K.; Hicks, C.K.; Ng-Kwai-Hang, K.F.;
Swaisgood, H.E. Nomenclature of the proteins of cows’ milk-sixth revision. J. Dairy Sci. 2004, 87, 1641–1674.
[CrossRef]
65. Tsutsumi, R.; Tsutsumi, Y.M. Peptides and proteins in whey and their benefits for human health. Austin J.
Nutr. Food Sci. 2014, 1, 1002.
66. Kobayashi, Y.; Somoto, Y.; Mitsuyama, E.; Tanaka, A.; Yuda, N.; Nakada, H.; Yamada, A.; Yamauchi, K.;
Abe, F.; Nagasawa, T. Supplementation of protein-free diet with whey protein hydrolysates prevents skeletal
muscle mass loss in rats. J. Nutr. Intermed. Metab. 2016, 4, 1–5. [CrossRef]
67. Han, Z.; Guo, J.; Conley, S.M.; Naash, M.I. Retinal angiogenesis in the Ins2(Akita) mouse model of diabetic
retinopathy. Invest. Ophthalmol. Vis. Sci. 2013, 54, 574–584. [CrossRef] [PubMed]
68. Giesbertz, P.; Daniel, H. Branched-chain amino acids as biomarkers in diabetes. Curr. Opin. Clin. Nutr.
Metab. Care 2016, 19, 48–54. [CrossRef] [PubMed]
69. Magnusson, M.; Lewis, G.D.; Ericson, U.; Orho-Melander, M.; Hedblad, B.; Engström, G.; Ostling, G.;
Clish, C.; Wang, T.J.; Gerszten, R.E.; et al. A diabetes-predictive amino acid score and future cardiovascular
disease. Eur. Heart J. 2013, 34, 1982–1989. [CrossRef]
70. Sancak, Y.; Peterson, T.R.; Shaul, Y.D.; Lindquist, R.A.; Thoreen, C.C.; Bar-Peled, L.; Sabatini, D.M. The Rag
GTPases bind raptor and mediate amino acid signaling to mTORC1. Science 2008, 320, 1496–1501. [CrossRef]
71. Sancak, Y.; Bar-Peled, L.; Zoncu, R.; Markhard, A.L.; Nada, S.; Sabatini, D.M. Ragulator-Rag complex targets
mTORC1 to the lysosomal surface and is necessary for its activation by amino acids. Cell 2010, 141, 290–303.
[CrossRef]
72. Kim, E.; Goraksha-Hicks, P.; Li, L.; Neufeld, T.P.; Guan, K.L. Regulation of TORC1 by Rag GTPases in
nutrient response. Nat. Cell Biol. 2008, 10, 935–945. [CrossRef]
73. Saucedo, L.J.; Gao, X.; Chiarelli, D.A.; Li, L.; Pan, D.; Edgar, B.A. Rheb promotes cell growth as a component
of the insulin/TOR signaling network. Nat. Cell Biol. 2003, 5, 566–571. [CrossRef] [PubMed]
74. Stocker, H.; Radimerski, T.; Schindelholz, B.; Wittwer, F.; Belawat, P.; Daram, P.; Breuer, S.; Thomas, G.;
Hafen, E. Rheb is an essential regulator of S6K in controlling cell growth in Drosophila. Nat. Cell Biol. 2003,
5, 559–565. [CrossRef] [PubMed]
75. Polak, P.; Cybulski, N.; Feige, J.N.; Auwerx, J.; Rüegg, M.A.; Hall, M.N. Adipose-specific knockout of raptor
results in lean mice with enhanced mitochondrial respiration. Cell Metab. 2008, 8, 399–410. [CrossRef]
76. Zhang, H.H.; Huang, J.; Düvel, K.; Boback, B.; Wu, S.; Squillace, R.M.; Wu, C.L.; Manning, B.D. Insulin
stimulates adipogenesis through the Akt-TSC2-mTORC1 pathway. PLoS ONE 2009, 4, e6189. [CrossRef]
77. Menendez, J.A.; Lupu, R. Fatty acid synthase and the lipogenic phenotype in cancer pathogenesis. Nat. Rev.
Cancer 2007, 7, 763–777. [CrossRef] [PubMed]
78. Qu, X.; Yu, J.; Bhagat, G.; Furuya, N.; Hibshoosh, H.; Troxel, A.; Rosen, J.; Eskelinen, E.L.; Mizushima, N.;
Ohsumi, Y.; et al. Promotion of tumorigenesis by heterozygous disruption of the beclin 1 autophagy gene.
J. Clin. Investig. 2003, 112, 1809–1820. [CrossRef] [PubMed]
79. Yue, Z.; Jin, S.; Yang, C.; Levine, A.J.; Heintz, N. Beclin 1, an autophagy gene essential for earlyembryonic
development, is a haploinsufficient tumor suppressor. Proc. Natl. Acad. Sci. USA 2003, 100, 15077–15082.
[CrossRef]
80. Marino, G.; Salvador-Montoliu, N.; Fueyo, A.; Knecht, E.; Mizushima, N.; López-Otín, C. Tissue-specific
autophagy alterations and increased tumorigenesis in mice deficient in Atg4C/autophagin-3. J. Biol. Chem.
2007, 282, 18573–18583. [CrossRef]
81. Hansen, M.; Taubert, S.; Crawford, D.; Libina, N.; Lee, S.J.; Kenyon, C. Lifespan extension by conditions that
inhibit translation in Caenorhabditis elegans. Aging Cell 2007, 6, 95–110. [CrossRef] [PubMed]
82. Pan, K.Z.; Palter, J.E.; Rogers, A.N.; Olsen, A.; Chen, D.; Lithgow, G.J.; Kapahi, P. Inhibition of mRNA
translation extends lifespan in Caenorhabditis elegans. Aging Cell 2007, 6, 111–119. [CrossRef] [PubMed]
83. Steffen, K.K.; MacKay, V.L.; Kerr, E.O.; Tsuchiya, M.; Hu, D.; Fox, L.A.; Dang, N.; Johnston, E.D.; Oakes, J.A.;
Tchao, B.N.; et al. Yeast life span extension by depletion of 60s ribosomal subunits is mediated by Gcn4. Cell
2008, 133, 292–302. [CrossRef] [PubMed]You can also read