The Trade Impact of the Covid-19 Pandemic 9109 2021 - CESifo
←
→
Page content transcription
If your browser does not render page correctly, please read the page content below
9109
 2021
 May 2021

The Trade Impact of the
Covid-19 Pandemic
Xuepeng Liu, Emanuel Ornelas, Huimin Shi
Impressum:

CESifo Working Papers
ISSN 2364-1428 (electronic version)
Publisher and distributor: Munich Society for the Promotion of Economic Research - CESifo
GmbH
The international platform of Ludwigs-Maximilians University’s Center for Economic Studies
and the ifo Institute
Poschingerstr. 5, 81679 Munich, Germany
Telephone +49 (0)89 2180-2740, Telefax +49 (0)89 2180-17845, email office@cesifo.de
Editor: Clemens Fuest
https://www.cesifo.org/en/wp
An electronic version of the paper may be downloaded
· from the SSRN website: www.SSRN.com
· from the RePEc website: www.RePEc.org
· from the CESifo website: https://www.cesifo.org/en/wp
CESifo Working Paper No. 9109

 The Trade Impact of the Covid-19 Pandemic

 Abstract

Using a gravity-like approach, we study how Covid-19 deaths and lockdown policies affected
countries’ imports from China during 2020. We find that a country’s own Covid-19 deaths and
lockdowns significantly reduced its imports from China, suggesting that the negative demand
effects prevailed over the negative supply effects of the pandemic. On the other hand, Covid-19
deaths in the main trading partners of a country (excluding China) induces more imports from
China, partially offsetting countries’ own effects. The net effect of moving from the pre-
pandemic situation to another where the main variables are evaluated at their 2020 mean is, on
average, a reduction of nearly 10% in imports from China. There is also significant
heterogeneity. For example, the negative own effects of the pandemic vanish when we restrict
the sample to medical goods and are significantly mitigated for products with a high “work-
from-home” share or a high contract intensity for products exported under processing trade, and
for capital goods. We also find that deaths and lockdowns in previous months tend to increase
current imports from China, partially offsetting the contemporaneous trade loss, suggesting that
trade is not simply “destroyed,” but partially “postponed”.
JEL-Codes: F140.
Keywords: trade flows, Covid-19, lockdown, stringency, China.

 Xuepeng Liu Emanuel Ornelas
 Kennesaw State University / GA / USA Sao Paulo School of Economics / Brazil
 xliu6@kennesaw.edu eaornelas@gmail.com

 Huimin Shi*
 Renmin University of China / Beijing
 huiminshi@ruc.edu.cn
*corresponding author

May 2021
We thank Joao Paulo Pessoa and participants at the Economics Seminar at Kennesaw State
University for comments and suggestions.
1. Introduction
 The Covid-19 pandemic has drastically affected lives and livelihoods and, in the process,
has also disrupted economic activities throughout the world. In this paper, we consider the
effects of the pandemic on China’s exports to worldwide, i.e., global imports from China in 2020.
Worldwide trade flows decreased in 2020 relative to 2019, and this fall has, naturally, been
associated with the pandemic.1 However, the channel of causation is not unidimensional. Rather,
there are several dimensions to the pandemic that are likely to affect international trade: its direct
health impact and the associated behavioral changes on affected countries; the consequences of
the actions that governments took to prevent the spread of the virus; and third-country effects
due to the impact of the pandemic there. We provide what we believe are the first estimates of
how each of these channels affected international trade flows in 2020, viewed through their
impacts on imports from China.

 Our empirical approach is conventional and straightforward. We carry out a gravity-like
estimation with measures of a country’s own covid incidence, own lockdown restrictions, and
the same variables for the country’s main trading partners. Our dependent variable is the monthly
year-over-year growth of imports from China for all destinations to which China exported in
2019 and 2020, at the product (HS 6-digit) level. We find that the direct effects of covid
incidence (as given by the number of deaths per capita) and of covid-induced government
measures (as given by an index of the stringency of lockdowns) are clearly negative. This is
probably unsurprising, but the magnitudes of the effects are worth highlighting. For example,
according to the point estimates of our baseline specification, relative to the 2019 situation with
no Covid-19 deaths, a country with 0.63 Covid-19 deaths per one thousand people in a month
(the highest level achieved in our sample excluding micro-states, for Slovenia in December 2020)
would experience a reduction of 13 percent of imports from China. Similarly, moving from no
lockdowns to the maximum level of lockdown stringency in the sample (for Honduras in April
and May, and Philippines in April) would generate a reduction of 17.6 percent of imports from
China. This illustrates the finding that government measures to curb economic activities tend to
have a large effect on a country’s imports, even larger than the direct health and behavioral
impacts of the pandemic.

 Perhaps even more surprising is our finding that, although on average lockdowns in third
countries do not have a significant effect on a country’s imports from China, the direct effect of
Covid-19 in third countries does. Specifically, more deaths in the main trading partners of a
country (excluding China) induces that country to import significantly more from China than
otherwise it would. Interestingly, the positive effect coming from covid incidence in the main
trading partners more than offsets the own negative covid incidence effect.

 It is important to stress that, although it seems sensible to expect negative trade effects due
to the pandemic, in principle the effect could go in either direction. The reason is that, as first
pointed out at the onset of the pandemic by Baldwin and Tomiura (2020), the pandemic consists
of a joint supply and demand shock. Since both are negative, the resulting impact on a country’s
import demand—defined as the difference between its domestic demand and domestic

1
 According to the World Trade Organization (WTO), world merchandise trade declined by 7% in 2020
(https://www.wto.org/english/news_e/pres21_e/pr876_e.htm).

 1
supply—is a priori ambiguous. On one hand, the health shock incapacitates some workers and
causes preventive reactions by firms and workers, decreasing labor supply and the domestic
supply of goods. Similarly, lockdown measures have a direct negative impact on domestic
supply. By itself—that is, for a given level of domestic demand—this tends to increase the
demand for imports. On the other hand, demand falls as workers are laid off, and as
precautionary motives compel consumers to postpone consumption and firms to suspend
investment plans. All of those decrease domestic demand, and therefore also the demand for
imports. The net effect is therefore ambiguous. The repercussions of the pandemic in other
trading partners of a country on its own demand for imports from one specific country (China, in
our case) is similarly ambiguous. On one hand, if supply-side restrictions due to the pandemic
(e.g., closure of port and airport facilities) make it harder for the country to import from them, its
residual demand for imports from China increases. On the other hand, if demand falls more than
supply in third countries, this “excess” of supply will be met by additional exports to the country,
possibly outcompeting exports from China.

 We seek to resolve these ambiguities, at least partially, by analyzing countries’ imports
from China, the world’s largest exporter in goods. Our results indicate that the negative own
demand effect on countries’ imports from China prevails over the negative own supply effect,
thus decreasing imports from China. This happens both because of the direct impact of the
pandemic and because of lockdown-induced effects. In turn, the negative supply effect due to the
direct impact of the pandemic on a country’s trading partners prevails over possible negative
demand effects. This reduces a country’s imports from third countries and indirectly increases its
imports from China.

 Naturally, these are average effects, and there are important sources of heterogeneity,
across products and countries. We explore several such possibilities. For example, the negative
effects of the pandemic all but vanish when we restrict the sample to medical goods, highlighting
that they follow a very idiosyncratic dynamic during the pandemic. The negative effects are also
significantly mitigated for products that have a higher “work-from-home” share, for which a
higher share of their value can be produced remotely. A similar weaker effect is present for
goods with a high contract intensity, for which long-term relationships are more important (and
hence disruption would be more costly), and for goods exported under processing trade. On the
other hand, the negative results are more pronounced for durable consumption goods. The results
for the average product apply in a similar fashion for intermediate goods, but less so for capital
goods, for which long-term planning implies a different reaction to the temporary shock due to
the pandemic.

 Interestingly, the results for the average country are driven mainly by non-OECD countries.
By contrast, in OECD members the impact of lockdown stringency reverses, indicating that
domestic demand fell by less than domestic supply (or even increased), thus inducing an increase
in imports from China. It is conceivable that this could reflect the fiscal policies that
governments used to compensate workers and firms affected by the pandemic, which were
generally much more generous in rich countries than in developing ones. However, when we
introduce covid-related fiscal measures directly in our regression, the results hardly change. The
results are also virtually unchanged when we exclude the U.S.—which has been engaged in a

 2
trade war with China since 2018—from the analysis, or when we exclude products affected by
pandemic-related trade policies.

 On the other hand, we do observe an important path-dependence: while the trade effect of
the pandemic in a country in a month is negative, incidence of the shock in previous months has
a positive effect on current trade volumes. This suggests that, over time, contemporaneous
negative effects tend to be partially reversed, so that trade is not simply “destroyed,” but is
partially “postponed.” Finally, we do not find evidence that trade at the extensive margin suffers;
the effect appears to be concentrated on the intensive margin, on which our analysis focuses.
This pattern is similar to what has been found for the “great trade collapse” that followed the
financial crisis of 2008.2

 The “hub” from which all imports in our sample come is China. The main reason why we
use imports from China, and not from other countries, is that China’s monthly trade data up to
December 2020 is already available. To the best of our knowledge, this makes our paper the first
to evaluate the trade effects of the pandemic for 2020 as a whole. Now, if it is to take the
perspective of one country’s trade with the rest of the world, China is presumably the best choice.
First, because China has trade relationships with every other economy and is, by some margin,
the largest exporter in the world, accounting in 2019 for 13.6% of world’s exports, according to
the WTO’s World Trade Statistics 2020.3 Second, it has a particular advantage directly related
to the pandemic. China suffered the most with Covid-19 in the first quarter of 2020, when the
rest of the world was only starting to experience the consequences of the spread of the virus.
From the second quarter onwards, which is when our variables of interest depart more
significantly from zero, the situation reversed and China’s economy recovered swiftly. In fact,
China’s GDP grew by 2.3% and its aggregated exports grew by 4% in the year, whereas no other
major economy experienced positive growth. Thus, in the more relevant period for our
estimation, between April and December, the main covid-related impediments of trade with
China stemmed from (if not exclusively, at least largely) the situation of the pandemic in China’s
trading partners. This avoids the difficulties of distinguishing between pandemic-related factors
in exporting and importing countries, which is useful especially if there were interaction effects
between them. Our analysis is therefore exclusively on the effects of the pandemic on countries’
imports.

 Naturally, the Covid-19 pandemic has spurred a torrent of research on its various
consequences, and trade is not an exception. Some of this research has developed structural
models, sometimes merged with epidemiological models, to study the trade and welfare
consequences of the pandemic and their interaction with global trade. A prominent example of
this line of research is Antràs et al. (2020). Another strand of the literature, in which this paper
fits, focuses instead on empirical studies following the approach of standard gravity analyses.
While the details of the empirical approach—the level of aggregation, the types of goods studied,

2
 For example, using Belgium firm-level data, Behrens et al. (2013) find that nearly all of the fall in trade in that
episode happened at the intensive margin. Bricongne et al. (2012) obtain similar results for French exporters. Bems
et al. (2013) provide a review of the literature on the great trade collapse. This is not to say that the two shocks had
similar global effects, however. As Le Moigne and Ossa (2021) point out, in aggregate, world trade has displayed
much greater resilience in 2020 than during the trade collapse of 2008-2009.
3
 https://www.wto.org/english/res_e/statis_e/wts2020_e/wts2020_e.pdf (see Table A4).

 3
the data coverage—and the specific questions vary, the general goal of this line of research is to
explore Covid-19’s impact on trade flows.

 Some of these empirical studies focus on China (Che et al., 2020; Friedt and Zhang, 2020;
Pei et al., 2021), but their data go only until mid-2020, thus stopping before the end of the first
wave of the pandemic.4 Others use datasets from other specific countries, like Kenya (Socrates,
2020), from regional groups of countries, like the EU (Kejzar and Velic, 2020), or for multiple
economies (Bas et al., 2021; Berthou and Stumpner, 2021; Espitia et al., 2021; Hayakwa and
Mukunoki, 2021). A common finding is that the pandemic has negatively affected international
trade flows, although the details of the results vary significantly across papers.

 An important distinction between our paper and the existing empirical literature is that we
use both Covid-19 death cases and lockdown policies while most existing papers focus on one or
the other. While Covid-19 deaths are an intuitive proxy for the impact of the pandemic, it is well
known that lockdowns (of various degrees of stringency) are implemented as a reaction to the
pandemic, often exactly when the number of deaths is high or is expected to rise soon. As a
result, studying either variable in isolation can lead to misleading results, for example with
artificially large negative effects associated to Covid-19 deaths due to the omission of lockdown
measures—and vice-versa. Like us, Bas et al. (2021) also use both Covid-19 deaths and
lockdown stringency throughout their analysis. They use monthly import data for the U.S., Japan,
Germany and France until July 2020, and conclude that the negative trade impact of the
pandemic on these four countries stems mainly from inputs whose supply relies on China and
that requires a high degree of customization.

 Another key contribution of our paper is to take explicitly into account the influence of the
pandemic in the rest of world on bilateral trade flows. The motivation for considering third
countries in a gravity estimation context goes back the discussion of multilateral resistance by
Anderson and Wincoop (2003), while the idea that shocks in a country will have repercussions in
trade between other countries is the backbone of general equilibrium trade models. Yet most
existing papers have not considered such effects.5 We find that they are quantitatively very
important.

 A limitation of our analysis is that we do not investigate the role of global value chains
(GVCs) in shaping the impact of the epidemic on trade flows. The reason is two-fold. First, our
empirical strategy is designed to explain variation within (6-digit) products, whereas to study

4
 Friedt and Zhang (2020) use China’s exports data until May 2020 at the province-country-product (HS2) level and
find that China’s exports are very sensitive to foreign countries’ new cases and domestic new cases. Che et al. (2020)
use China’s export data until May 2020 at the country-product (HS6) level and find that China’s exports decline
when foreign cases increase, especially for processing trade and products that are more upstream. Pei et al. (2021)
use data up to April 2020 for China’s exports at the city-country level to investigate how local lockdowns affect
exports, finding that Chinese cities under lockdown experience a 34 percentage-point reduction in year-over-year
export growth rate.
5
 We know of two exceptions. Berthou and Stumpner (2021) use trade data from 31 reporting countries with the rest
of the world until November 2020. They concentrate on the influence of lockdown policies, and in a robustness
specification construct a similar measure for third-country stringency, although not for Covid-19 incidence variables.
They find a significant positive effect of third countries’ lockdowns. Espitia et al. (2021) also consider a
third-country effect, but in a very different way, based on changes in third countries’ industrial output, and without
using Covid-19 variables.

 4
GVCs properly one needs to consider variation across products in different stages of the
production process, and most of the available GVC databases are at a highly aggregated
manufacturing sector level, constrained by national and international input-output tables. Second,
several other authors have focused precisely on that dimension, with rich frameworks and
interesting insights.6 We see our within-product analysis as complementary to those studies.
Another limitation is that we study only countries’ imports from China, our “hub” country, while
the response of countries’ imports from other countries to Covid-19 can, of course, be different.
Nevertheless, to draw a more complete picture of the pandemic’s trade effects, we also consider
the repercussion effects arising from covid-related deaths and lockdown policies in third
countries.

 The remainder of the paper is as follows. In section 2, we discuss the data. In section 3, we
explain our methodology. In section 4, we discuss the results. We conclude in section 5.

2. Data

We use China’s monthly export data at the HS 8-digit level over January 2019-December 2020,
obtained from China Customs Statistics. Our dataset covers all of the 242 destination countries
or regions that China exported to in 2019 and 2020. Starting in 2020, China’s Customs report the
combined January and February data, rather than for each individually. Thus, we also combine
January and February’s data of 2019 and consider it as one month. We aggregate our data to
month-destination-product (HS6) level and control for China’s specific factors over the year with
year-month fixed effects. We carry out the analysis at the HS 6-digit level, instead of doing it at
the 8-digit level, for two reasons. First, product classifications at higher than 6-digit levels are
not internationally comparable. Second, some variables that we use in our analysis are also
defined at the HS 6-digit level. At this level of aggregation, the number of observations in our
analysis is already close to 2 million.

 The Oxford Covid-19 Government Response Tracker (OxCGRT), compiled by Hale et al.
(2021), systematically collects publicly available information on many covid incidences
(cumulative cases, death cases, tests) and policy indicators. 7 There are nine indicators, which
record information on containment and closure policies, such as school and workplace closures
and restrictions in internal and international movement. 8 Based on these indicators, a stringency
index is constructed to measure the strictness of “lockdown style” policies that primarily restrict
individuals’ behavior. The original stringency index ranges from 0 to 100. We rescale it by

6
 For example, Bonadio et al. (2020) model the pandemic-induced lockdown as a labor supply shock, studying
quantitatively its trade and welfare impacts through input-output linkages that transmit the shock across countries
through GVCs. Based on a quantitative Ricardian model including input-output features, Eppinger et al. (2021)
analyze the influence of GVCs in mediating countries’ exposure to foreign shocks and how “decoupling” would
affect those effects. Sforza and Steininger (2020) calibrate a Ricardian model with production networks with data
from the first quarter of 2020, showing that the transmission of the Covid-19 shock through production networks
magnifies the global impact of local supply disruptions. There are also authors who investigate the role of GVCs in
the Covid-19 shock with reduced-form approaches (e.g., Hayakawa and Mukunoki, 2021, and Kejzar and Velic,
2020).
7
 Sources: https://covid.ourworldindata.org/data/owid-covid-data.xlsx and
https://github.com/OxCGRT/covid-policy-tracker/raw/master/data/OxCGRT_latest.csv.
8
 Source: https://github.com/OxCGRT/covid-policy-tracker/blob/master/documentation/codebook.md.

 5
dividing the original index by 100 to help the interpretation of estimated coefficients in the
regressions. The higher the lockdown stringency index (Stringency) is, the more restrictions to
individuals and to economic activities the country has. 9

 Among all Covid-19 incidence measures collected by OxCGRT, the death-related measures
seem the most reliable and internationally comparable both across countries and within countries
over time. Other measures, such as number of tests and number of positive cases, are highly
dependent on a country’s testing capacity and reporting methods. More importantly, such
capacity has changed significantly within countries during 2020. Accordingly, we use the
measures of new deaths per thousand people as our proxy for Covid-19 incidence (CovidD). The
original Covid-19 data from OxCGRT are available at daily frequency. The number of new
deaths is smoothed over the last seven days to fill gaps when data is missing for a day. We
aggregate the data to the monthly level.10

 We argue that a country’s imports from China may be affected not only by the country’s
own Covid-19 situation, but also by how the rest of the world (ROW) handles the pandemic.
Therefore, we also consider the Covid-19 variables of a country’s trading partners. We construct
the ROW measures for both Stringency and CovidD. Specifically, country i’s Stringency_ROW
measure is the average stringency of the rest of the world in month t, weighted by country i’s
import share of product p in 2018 from all countries except China.11 That is,

 ∑ ,
 _ = ,
 ∑ ,

where Mijp,2018 denotes the value of imports of product p by country i from country j in 2018. We
use an analogous procedure to construct CovidD_ROW. Both variables are defined to vary at the
HS6-country-month level. The trade value data of 2018 used as weights are from BACI-CEPII.
Because our regressions cover years 2019 and 2020, using the pre-determined trade data in 2018
as weights avoids potential endogeneity problems of bilateral trade.

 In our heterogeneous analysis, we use several additional variables defined at the product or
the country level. We explain below how each of them is defined and their data sources.

9
 The lockdown policy indicators are updated on a bi-weekly basis. The original stringency index is constructed
based on nine sub-indexes at daily frequency. The first eight relate to containment and closure: school closing,
workplace closing, cancellation of public events, restrictions on gathering size, closure of public transport,
stay-at-home requirements, restriction on internal movement, restrictions on international travel. The ninth relates to
health systems, which is the public information campaign. For each subcategory, based on the judgement of the
policy, a certain number of points is given, and then aggregated to generate the overall stringency index, which
ranges from 0 to 100.
10
 Occasionally, a country may record a negative number for new Covid-19 deaths to adjust for previous
over-reporting. Such negative values become very rare after we aggregate the data to a monthly frequency: they are
present for only three country-month pairs among nearly two thousand pairs. We drop those three observations from
our regressions.
11
 We also exclude Hong Kong, SAR, and Macau, SAR, because they are entrepot handling mainly the exports of
mainland China.

 6
Since we study a health shock, we give special attention to medical goods (MG) in our
analysis. The list of covid-related medical goods is provided by the World Customs Organization
(WCO), together with the World Health Organization (WHO). We use its 3.01 Edition. 12

 As Bems et al. (2013) show in their review, during the “trade collapse” of 2008-2009, the
largest group of goods affected were durable consumption goods. Accordingly, we investigate
whether a similar conclusion applies to the current situation as well. We define consumer durable
and non-durable goods based on the UN Broad Economic Category (BEC) classification (5 th
revision).

 Also because of the nature of the shock, activities that can be performed from home are
affected very differently than those that require physical presence. To make that distinction, we
use the work-from-home shares from Dingel and Neiman (2020) and Bonadio et al. (2020).
Dingel and Neiman (2020) calculate the work-from-home share at the occupational level. Based
on it, Bonadio et al. (2020) compute the sectoral work-from-home intensity measure from the
average of Dingel and Neiman (2020)’s, weighted using sectoral level expenditure shares on
each occupation. We use the concordance between ISIC Rev.4 and ISIC Rev.3 and the
concordance between HS 2017 and ISIC Rev. 3 to calculate the HS6 level work-from-home
intensity following Bonadio et al. (2020). 13

 Another product-level feature that may lead to heterogeneous effects of Covid-19 on trade
is the level of contract intensity, which determines how much relationship-specific capital is
required to establish a trading relationship. We use the measure of contract intensity constructed
by Nunn (2007), which corresponds to the share of intermediate inputs that require
relationship-specific investment. We convert Nunn (2007)'s original data at the 3-digit level of
ISIC Rev. 2 to the HS 2017 at the 6-digit level.

 The trade modes in which products are exported could also yield different responses from
the pandemic, because the level of relationships may vary depending on the trade regime. Our
data from China Customs Statistics provide information on trade regimes, mainly processing
trade and normal trade.14 Thus, we create the share of processing trade among processing and
normal trade at the HS6 product level to investigate whether products exported in that way are
affected differently. This share varies at the country-product-month level.

12
 Source:
http://www.wcoomd.org/-/media/wco/public/es/pdf/topics/nomenclature/covid_19/hs-classification-reference_editio
n-3_es.pdf?la=en.
13
 Concordance between ISIC Rev. 4 and ISIC Rev. 3 is from the WIOD SEA Source and Methods,
http://www.wiod.org/database/seas16, pp. 26-27. Concordance between HS 2007 and ISIC Rev. 3 are obtained from
the WITS, https://wits.worldbank.org/product_concordance.html.
14
 Processing trade refers to the business activity of importing all or part of the raw materials, parts and components,
packaging materials from abroad in bond (i.e., duty-free), and re-exporting the finished products after processing or
assembly by firms within China. Besides processing trade and normal trade, there are more than a dozen other minor
trade regimes, but they only account for about 13% of total exports in China during 2019-2020, with normal and
processing trade accounting for 59% and 28%, respectively. We exclude these minor categories when calculating the
share of processing trade.

 7
The effects of the pandemic may also vary depending on the position of products along
global value chains, because the pandemic is likely to affect firms and families differently. To
investigate that possibility, we use the UN BEC 5 th Revision data to distinguish goods between
capital goods, intermediate goods, and final goods for consumption, evaluating them
separately.15

 In addition to the covid-related deaths and the stringency index, we also take advantage of
data collected by OxCGRT on worldwide government responses to the pandemic in the form of
economic support policies. The economic support index records measures such as income
support to those who lose jobs or cannot work, as well as debt relief.16 The original economic
support index is at a daily frequency. We take a simple average to calculate the index at the
monthly level, which ranges from zero to about 100 in our final dataset. We rescale it to between
0 and 1 by dividing the original index by 100, similar to the rescaling of the stringency index.

 Finally, some countries have implemented trade policies in response to the pandemic. We
use the measures compiled by the WTO on temporary Covid-19 related trade policies to
investigate whether they affect our estimates. 17 Since our analysis is on the pandemic effects on
countries’ imports, we only consider import measures, most of which aim to promote imports of
selected medical products or materials. For a few cases when a policy applied to all medical goods,
we use the WCO-WHO definition of medical goods discussed earlier. We consider the temporary
nature of these policies based on their initiation and revocation dates. The trade policy indicators
vary by country-product-month.

 Table A.1 in the Appendix provides summary statistics for the variables used in our
analysis. The data used in our baseline regressions cover a large number of countries/regions
(174) and products at the HS6 level (4636) over 12 months of 2019 and 2020 (January and
February combined).18 Naturally, the covid-related variables reflect only the information for
2020, since such data did not exist before 2020. The table shows that there is substantial
variation in both our dependent and independent variables, including those that we use for the
heterogeneity analysis.

 Table A.2 in the Appendix shows the pairwise correlations among the four main
independent variables. The correlation coefficients among them are all positive, as expected, but
are below 0.5 for most of them, except for Stringency and Stringency_ROW, which have a
correlation coefficient of 0.6. This indicates that multicollinearity should not be a major concern
in our analysis.

15
 Source: https://unstats.un.org/unsd/trade/classifications/bec.asp.
16
 Codebooks:https://github.com/OxCGRT/covid-policy-tracker/blob/master/documentation/codebook.md#economic
-policies and https://github.com/OxCGRT/covid-policy-tracker/blob/master/documentation/index_methodology.md.
17
 Source: https://www.wto.org/english/tratop_e/covid19_e/trade_related_goods_measure_e.htm
(as of March 26, 2021).
18
 Some countries are covered by our trade data, but not by the covid-related data (mostly constrained by the
availability of the stringency index). Nevertheless, our sample coverage of importing countries is among the largest
among similar studies.

 8
3. Empirical Strategy
3.1 Pandemic, Lockdowns, and Trade
We study how worldwide imports from China were affected by the Covid-19 pandemic.
Assessing those effects from the perspective of China is useful because, after the Covid-19
outbreak in January 2020 and the implementation of strict measures to prevent its spread across
the country, China was able to restore “almost normal” economic activities relatively early in the
year. Since shocks in China affect their trade relationships with all countries and our analysis
exploits within country and within country-product variation—as will become clear shortly—this
may not appear to be a particularly important advantage. However, if there are interaction effects
of the pandemic in importing and exporting countries, then having a “hub” country where the
main effects of the pandemic have been circumscribed to the first quarter of 2020 is useful to
isolate the effects in the importing countries.

 We know that the aggregate level of international trade fell in 2020 because of the
pandemic (even if not nearly as much as some analysts predicted initially). It is, however, far less
clear how the local effects of the pandemic have affected bilateral trade flows. The reason is that
there are potentially opposing forces at work.

 Consider first the direct impact of the pandemic on importing countries, which we proxy
with the number of covid-related deaths per thousand people. If it is higher, then more workers
are getting sick (or dying) and isolating themselves socially, while at the same time more firms
slow down (or halt) production and investment to prevent contagion among their workers. On the
one hand, these effects reduce domestic income and, for that reason, lower the demand for
foreign goods.19 On the other hand, they also reduce domestic production; for given total
demand, this increases demand for foreign goods. Although it has been common to focus on the
former (income) effect, in principle each force may dominate. Which one actually prevails is an
empirical question, and the answer may depend on factors such as the type of product, the wealth
of the country, the position in the global value chain, etc.

 Now, as is widely known, governments around the world reacted in different ways to the
health crisis, adopting a set of policies aimed at preventing the spread of the virus. In particular,
various types of “lockdown” measures have been implemented worldwide. They vary
significantly, across countries as well as over time within countries. The most extreme of those
policies is a blanket closure of all non-essential economic activities in the country. But there are
also partial lockdowns and other localized restrictions on economic activities. Hence, we
measure the stringency of those policies as a continuous variable, as described in section 2.
Although most previous related papers have focused on the direct impact of Covid-19, it is
essential to account for this indirect, but central, impact of the pandemic on importing countries.
First, because without controlling for that reaction the estimates of the effects of Covid-19 will
be biased. Second, because it is useful to disentangle the trade effects of the pandemic between
its direct and indirect, policy-related, effects. If the stringency measure is higher, it lowers
domestic production by design. As a result, both domestic income and domestic supply fall.

19
 An additional reason for the reduction of import demand is precaution. Given the uncertainty created by the
pandemic, consumers may want to postpone consumption and firms may decide to postpone production and
investment. This precautionary effect adds to the negative effect on imports.

 9
Hence, just as with covid-related deaths, Stringency has a positive effect (because domestic
supply falls) and a negative effect (because domestic demand also falls) on the demand for
imports. Again, whether the former or the latter dominates is an empirical question and may as
well vary across types of products and countries.

 Bilateral trade flows are also affected by factors that go beyond the pair of countries in
analysis. In particular, as is well known from the gravity literature, bilateral trade flows are
affected by policies in third countries. This is especially important in our context, since we study
countries’ imports from a single country (China). Surprisingly, this dimension has received very
little attention in the literature on trade and Covid-19—the main exception are the studies of the
role of GVCs in spreading the effects of the pandemic, as discussed in the introduction.
Specifically, if the main sources of imports of a country are strongly affected by the pandemic
and by policies to mitigate its impact, there will be repercussions on the country’s demand for
imports from other countries (and from China, in particular). To assess that, we define Covid-19
and stringency measures for the trading partners (except China) of a country, as detailed in
section 2. The measures are defined at the country-product-month level, with weights given by
the country’s import shares of the corresponding product in 2018.

 Once again, there are potentially opposing forces operating simultaneously. If the negative
supply effects due to the direct and indirect incidence of Covid-19 are stronger than the
corresponding negative demand effects, then export supply in third countries falls. As it becomes
harder for a country to import from third countries, imports from China tend to increase to
replace them. One may think of this as a “trade diversion” effect: pandemic-related difficulties to
import from some countries inducing a diversion of imports to others (China, in our case).
However, the effect may as well go in the other direction, if the negative demand effects
dominate the negative supply effects in third countries, leading to an expansion of their export
supply. In that case, imports from the third countries will tend to displace imports from China.
This third-country effect can also confound the supply-demand effects of countries’ own
covid-related deaths or lockdowns discussed earlier. For instance, even if a country’s
demand-side effect dominates the supply-side effect, this does not necessarily mean lower
imports from China because imports from other trading partners may be replaced by
corresponding imports from China when other partners are mired in Covid-19. Therefore, it is
crucial to control for the third-country factors when estimating the effects of Covid-19 on
bilateral trade.

 Finally, as mentioned above, we expect to observe heterogeneous effects depending on
the type of goods, on the level of development of the importing country, on whether value-added
can be produced from home, etc. We discuss these heterogeneity results and other robustness
analyses in detail in section 4.

3.2 Econometric Specification

We estimate how deaths from Covid-19 and the stringency of lockdowns affect countries’
imports from China using monthly trade data at the HS 6-digit product level. We consider a
country’s own Covid-19 variables as well as those in its trading partners except China (ROW). A

 10
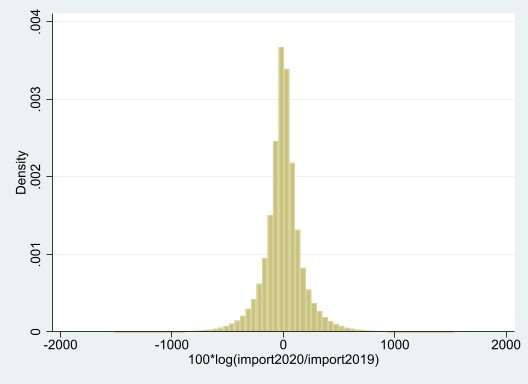
natural empirical specification for such an analysis is the standard log-linear gravity regression,
as follows:

 = + + _
 + _ + + + . (1)

The dependent variable is the log of the volume of imports of product p by country i from China
in period t, referring to a specific month between January 2019 and December 2020. The main
explanatory variables are the number of covid-related deaths per thousand people (CovidD) and
a stringency index capturing the overall strictness of a country’s policies to control the spread of
the virus (Stringency). The ROW measures of Stringency and CovidD are the average stringency
and covid-related deaths in ROW, weighted by each country’s imports of a product from all
countries except China in 2018. In some regressions, we also include interaction terms between
Covid-19 variables and other variables. Naturally, all covid-related variables are available only
for the year 2020; for years before 2020, they are set to zero.

 To control for other contemporaneous shocks and characteristics, we rely on a large set
of fixed effects. We consider a particularly demanding set of fixed effects at the
country-product-year level ( ), which represent any factor that affects imports from China of
a particular country-product pair in the same way over the months of a year. These effects
capture differences in imports from China due to specific characteristics of the importing country,
such as its size, and due to specific characteristics of the product, such as those that make it more
or less appealing. They also capture similar effects at the country-product level—for example,
factors that make a country have a particular large or small demand for imports from China of a
specific product. Furthermore, they are allowed to vary by year. 20 In turn, refers to time
(year-month) fixed effects, which capture worldwide and Chinese-specific macro and health
factors, as well as seasonal elements. With this wide set of fixed effects, the variation that our
coefficients capture comes only from within-country or within country-product pairs over time.

 Instead of estimating (1), we take the year-over-year (yoy) difference of trade and
covid-related variables. This has the practical advantage of eliminating all time-invariant
idiosyncratic country-product effects. Country-product effects that vary at the year level are still
present, however, and in the yoy specification we denote them simply as . This gives our
baseline specification:

 = + + _
 + _ + + + . (2)

The dependent variable, Δimports, is the log difference between country i’s imports of product p
from China in month t of 2020 and its imports in the same month of 2019, i.e.,
Δimportsipt=100*[log(imports2020)ipt-log(imports2019)ipt]. We multiply it by 100 to help with
the visualization of the estimated coefficients, so it measures the yoy change in trade value in
percentage terms. The explanatory variables are exactly the same as in equation (1), since they

20
 Observe that we allow the country-product effect to vary by year, but not by month of the year, which is the
periodicity of our sample—otherwise it would absorb all of the variation in the dependent variable.

 11
all take value zero during the whole 2019. Parameter corresponds to a month fixed effect.
Thus, this chained log difference yoy estimation at the monthly level also removes seasonality
and avoids potential issues arising from combining the trade data for January and February.
Considering that the trade of a product may be correlated across countries and over time (such as
trade in medical goods) or across country-product over time, we cluster the standard errors at the
country-product level.21

 Compared to the traditional log linear gravity regressions, our method has three advantages.
First, we can avoid estimating equation (1) with a very large number of fixed effects
corresponding to the two sets of country-product fixed effects (one for each year). 22 Second, the
yoy difference allows an apples-to-apples comparison of trade values, instead of comparing them
month-over-month sequentially, where there may be large seasonal changes, especially since we
have to combine January and February trade values. Even with the full sets of fixed effects, the
traditional log linear gravity regression, based on demeaning the data along various dimensions,
cannot fully address the country-product specific seasonality (e.g., the sudden drop in trade for
most products during Chinese New Year except for holiday-related goods). Third, with the yoy
measure, results are formatted as percentages, making it straightforward to interpret the
economic significance of the results.

4. Results
4.1 Baseline Results
In Table 1, we consider our baseline specification, assessing the impact of our main variables on
the monthly log difference of imports from China, defining goods at the 6-digit level. In columns
1 and 2, we have only the Stringency and CovidD variables. In the first column, to have an initial
picture of how they are correlated with the dependent variable, we add only month dummies. In
the second column, we then add country dummies and product fixed effects (absorbed).
Naturally, this increases the fit of the regression significantly. In both cases, the two variables
display negative and statistically significant effects, indicating that pandemic’s negative demand
effect prevails over the negative supply effect. The absolute value of the coefficients drops
considerably from column 1 to column 2, highlighting the importance of controlling for the
additional fixed effects.
 Now, just like in any other gravity estimation, it is important to control for changes in
economic conditions in third countries. In our specific case, we are directly interested in
understanding how the state of the pandemic in third countries affects trade flows between a
country/region and China, as this can clarify the strength of diversion and complementary forces
between China and other countries. To do so, we consider in our analysis Covid-19 incidence
and lockdown policies in a country’s main trading partners (except China). The results from
adding those variables to our regression are reported in columns 3 and 4. In column 3, we have
21
 In the few specifications where we have separate country and product fixed effects, we cluster the standard errors
at the HS6 product level.
22
 With 174 countries/regions and 4636 products at the HS6 level in our baseline analysis, this amounts to
2*174*4636 =1,613,328 fixed effects. Using yoy measures, we still have one set of fixed effects, but they do not
cause similar computational difficulties.

 12
the same set of fixed effects as in column 2, to make it clear the sole effect of adding the
third-country variables. In terms of sign, the estimated coefficients on CovidD and on Stringency
do not change with the introduction of third-country variables, remaining negative and estimated
very precisely. In column 4, we have instead country-product fixed effects, which we keep in all
subsequent specifications. As the results reveal, moving to that stricter specification increases the
absolute magnitudes of all estimated coefficients, indicating that some trends at the
country-product level mask the effects of the pandemic-related variables.

Table 1: Baseline regressions
 (1) (2) (3) (4)
Stringency -22.270*** -10.455*** -12.629*** -19.371***
 (1.096) (1.357) (1.431) (1.085)
CovidD -6.362** -5.333** -7.154** -20.861***
 (2.763) (2.680) (2.779) (2.567)
Stringency_ROW -0.663 -2.925
 (2.208) (2.242)
CovidD_ROW 20.302*** 28.589***
 (4.365) (4.174)
Month dummies Yes Yes Yes Yes
Country FEs Yes Yes
HS6 product FEs Yes Yes
Country-HS6 FEs Yes
Observations 2,032,389 2,032,389 1,923,335 1,923,335
R-squared 0.004 0.034 0.034 0.059
Notes: Dependent variable is year-over-year (yoy) log difference between a country i’s imports of product (p) from
China in month t of 2020 and the corresponding import value in the same month of 2019, multiplied by 100, i.e.,
Δimportipt=100*log(import2020)ipt-log(import2019)ipt. Stringency is a lockdown stringency index, rescaled to
between 0 and 1. CovidD measures the number of new covid-related deaths per thousand people in the population in
each month. The ROW variables are the corresponding Covid-19 measures for the rest of the world, excluding
China, Hong Kong, Macau, and the importing country in question. Month dummies and various set of country, HS6
product, or country*HS6 fixed effects are included. Robust standard errors in parentheses, clustered at the HS6
product level in the first three regressions (at country-HS6 level in the last regression). *** p
and for Philippines in April) would yield a reduction of imports of 17.6%. 23 For Covid-19 deaths,
going from zero (as in 2019) to the highest level of Covid-19 deaths per capita excluding
micro-states (0.63 per thousand people in Slovenia in December) would induce a reduction in
imports from China of 12%.24 The effect stemming from Covid-19 incidence in third countries
goes in the opposite direction. It implies an increase of imports from China of 16.4% if the
country’s main trading partners experience an increase in Covid-19 deaths from 0 to 0.628 per
thousand people, the highest value in our sample (for Croatia in December).
 In Table A.3, in the Appendix, we show the individual impact of each of the three
statistically significant coefficients following a one standard deviation increase, a move from
zero to the sample mean, and from zero to sample maximum. In the three thought experiments,
the positive effect stemming from Covid-19 deaths in third countries prevails over the negative
effect due to domestic Covid-19 deaths. However, for non-extreme values, the negative effect of
a country’s own lockdown on imports from China is the dominating force. Combining all of
them, the net effect when each variable goes from zero to the sample mean is a decrease in
imports from China of nearly 10 percent.

4.2. Heterogeneity
Now, countries differ in how well they can absorb the consequences of the health crisis, and the
effects likely differ by type of product as well. We explore various sources of heterogeneity,
starting in Table 2, where we look more closely at two types of goods.
 The most obvious distinction in our setting is whether the good is helpful in containing the
virus during the pandemic. Thus, we split the sample between medical goods (MG) and non-MG.
This group of products includes Personal Protective Equipment products, as well as many other
goods, like ventilators, test kits, syringes, etc. As is well known, demand for some types of MG
products skyrocketed at the onset of the pandemic and remains at historically high levels.
However, while trade in MG goods is likely to display an idiosyncratic pattern, they correspond
to only about 4% of the observations in our sample. Indeed, when we estimate our main
specification without MG goods (column 1 of Table 2), we obtain results that are very similar to
our baseline regression. Now, if we do the opposite and restrict the sample to MG goods (column
2), we observe that the pattern is indeed very different. Neither lockdowns nor the number of
covid deaths has a significant effect on the imports of MG products from China, indicating that
demand and supply effects offset each other. The impact of lockdown stringency in the main
trading partners remains statistically not significant. Meanwhile, more covid-related deaths in the
main trading partners increase imports from China, as it does with other goods, except that the
magnitude of the effect is much larger for MG goods. Specifically, imports of MG from China
would increase by 5.1% if the ROW experiences an increase in Covid-19 deaths from zero to
0.051 (the sample mean) per thousand people.

23
 1- exp(-19.371/100) = 17.6%, where -19.371 is the estimated coefficient of Stringency. We divide it by 100
because the dependent variable is in percentage terms.
24
 1- exp(-20.861*0.63/100) = 12%.

 14
Table 2: Product level heterogeneity – medical goods and durable goods
 (1) (2) (3) (4)
 w/o MGs Only MGs w/o durable Only durables
Stringency -20.520*** 2.986 -17.048*** -26.192***
 (1.105) (5.367) (1.241) (2.221)
CovidD -22.023*** 13.275 -13.868*** -40.231***
 (2.622) (12.604) (2.942) (5.260)
Stringency_ROW -2.587 -11.608 2.995 -15.814***
 (2.275) (12.729) (2.474) (5.251)
CovidD_ROW 25.709*** 97.187*** 22.293*** 39.323***
 (4.230) (24.889) (4.676) (9.172)
Month dummies Yes Yes Yes Yes
Country-HS6 FEs Yes Yes Yes Yes
Observations 1,846,547 76,788 1,484,363 438,972
R-squared 0.054 0.150 0.057 0.068
Notes: Dependent variable is year-over-year (yoy) log difference between a country i’s imports of product (p) from
China in month t of 2020 and the corresponding import value in the same month of 2019, multiplied by 100, i.e.,
Δimportipt=100*log(import2020)ipt-log(import2019)ipt. See the footnote of Table 1 for definitions of covid-related
variables (Stringency, CovidD and ROW variables). Month dummies and country-HS6 fixed effects are included in
all regressions. Robust standard errors in parentheses, clustered at country-HS6 level. *** p
work-from-home share. Using the point estimates from column 1, they indicate that the effect of
Stringency becomes positive for wfh > 0.74, while the effect of CovidD becomes positive for
wfh_sh > 0.79. In our data, only 0.5% of the HS6 products have a value of wfh_sh above 0.74
(same for the cutoff value 0.79), and the median of our sample has wfh_sh = 0.33. Still, the
results reveal that having a substantial share of workers that can work from home can
significantly dampen the negative income effect from the pandemic on imports. Note that the
estimated coefficients on the ROW variables hardly change when the interactions with wfh_sh
are introduced.

Table 3: Product level heterogeneity – by product and trade characteristics

 (1) (2) (3)
 wfh_sh Contract Intensity Processing trade
Stringency -39.826*** -34.125*** -19.232***
 (3.231) (7.280) (1.135)
CovidD -39.882*** -89.546*** -27.055***
 (8.739) (22.425) (2.756)
Stringency_ROW -2.357 -2.938 3.266
 (2.275) (2.268) (2.295)
CovidD_ROW 27.232*** 28.610*** 25.125***
 (4.272) (4.226) (4.289)
Stringency*wfh_sh 54.062***
 (8.345)
CovidD*wfh_sh 50.671**
 (22.420)
Stringency*Contract Intensity 15.895**
 (7.861)
CovidD*Contract Intensity 74.297***
 (24.323)
processing_sh 16.158***
 (2.200)
Stringency*prc_sh 6.215*
 (3.437)
CovidD*prc_sh 31.114***
 (9.622)
Month dummies Yes Yes Yes
Country-HS6 FEs Yes Yes Yes
Observations 1,854,101 1,885,797 1,792,892
R-squared 0.057 0.057 0.065
Notes: Dependent variable is year-over-year (yoy) log difference between a country i’s imports of product (p) from
China in month t of 2020 and the corresponding import value in the same month of 2019, multiplied by 100, i.e.,
Δimportipt=100*log(import2020)ipt-log(import2019)ipt. See the footnote of Table 1 for definitions of covid-related
variables (Stringency, CovidD and ROW variables). Wfh_sh measures work-from-home share at product level,
based on sectoral level expenditure shares on each occupation. Contract intensity measures the degree to which a
contract or relationship-specific investment is needed for a trading relationship in a sector. Prc_sh measures the
share of processing trade among normal and processing trade in China’s exports; it varies across destination
countries, products, and over time. Month dummies and country-HS6 fixed effects are included in all regressions.
Robust standard errors in parentheses, clustered at country-HS6 level. *** p
suppliers, at least in the short run. We assess whether that economic characteristic is
quantitatively relevant by interacting contract intensity at the product level with our main
variables of interest. 26 The estimates for Stringency and for CovidD remain negative but
increase in absolute terms relative to the baseline, especially the CovidD estimate. On the other
hand, their interactions with contract intensity are positive and significant. This reveals that, for
products with high contract intensity, for which it is costly to sever relationships, imports are
more resilient to the impact of Covid-19 deaths and to lockdowns, which have a temporary
nature. This result resembles a key finding of Bas et al. (2021). Note that the estimated
coefficients on the ROW variables remain virtually unchanged when the interactions with
contract intensity are introduced.
 Finally, in column 3 we consider potential differences in trade flows that are classified as
“processing.” The estimates for the effects of our main variables remain very similar to the
baseline results. The coefficient of the share of processing trade, which is defined at the
country-product-month level, is positive, indicating that this type of trade has become more
important compared to “normal” (non-processing) trade. Furthermore, its interaction with
Stringency and CovidD are positive and statistically significant. This shows that, for products
crossing borders with a greater share of processing trade, imports are more resistant to the
negative impact of Covid-19 deaths and of lockdowns. This could reflect the fact that processing
trade usually involves closer relationships between domestic processing firms in China and their
foreign partners.
 Product heterogeneity may also depend on the position of a good in the production process.
In Table 4, we carry out that investigation by splitting products among consumption,
intermediate and capital goods. Of the three categories, intermediate products behave more
closely to the average product, which is partly explained by the fact that this group encompasses
about half of the original sample. Stringency has a similar negative effect on the imports of each
type of good, although higher for consumption and lower for capital goods. The sensitivity to
own CovidD is substantially more diverse among the three groups: imports of consumption
goods are heavily affected by CovidD, whereas capital goods are virtually unaffected. This
difference may be explained by the temporary nature of the negative income shock, which has a
larger effect on family consumption, but little impact on firms’ long-run investment plans. The
effect of lockdowns in the main trading partners on each group of products is even more diverse.
It is mute for intermediate products (like for the average product), negative and significant for
consumption goods and positive and significant for capital goods. This suggests that, if it is
difficult to import capital goods from the main trading partners due to lockdown policies there,
firms turn to China to keep their investment plans.

26
 We do not add the contract intensity variable by itself in the regressions because it is fully absorbed by the
country-product fixed effect.

 17
You can also read