The UCSC Xena Platform for cancer genomics data visualization and interpretation - bioRxiv
←
→
Page content transcription
If your browser does not render page correctly, please read the page content below
bioRxiv preprint first posted online May. 18, 2018; doi: http://dx.doi.org/10.1101/326470. The copyright holder for this preprint
 (which was not peer-reviewed) is the author/funder, who has granted bioRxiv a license to display the preprint in perpetuity.
                              It is made available under a CC-BY-NC-ND 4.0 International license.

    The UCSC Xena Platform for cancer genomics data
            visualization and interpretation
           Mary Goldman1, Brian Craft1, Angela Brooks1, Jing Zhu1, and David Haussler1
                                      1
                                          UCSC Genomics Institute, UC Santa Cruz

   Abstract
   UCSC Xena is a web-based visual integration and exploration tool for multi-omic data
   and associated clinical and phenotypic annotations. The investigator-driven platform
   consists of a web-based Xena Browser and turn-key Xena Hubs. Xena showcases
   seminal cancer genomics datasets from TCGA, Pan-Cancer Atlas, PCAWG, ICGC,
   GTEx, and the GDC; a total of more than 1500 datasets across 50 cancer types. We
   support virtually any type of functional genomics data modalities, including SNPs,
   INDELs, large structural variants, CNV, gene and other types of expression, DNA
   methylation, clinical and phenotypic annotations. A researcher can host their own data
   securely via private hubs running on a laptop or behind a firewall, with visual and
   analytical integration occurring only within the Xena Browser. Browser features include
   the high performance Visual Spreadsheet, dynamic Kaplan-Meier survival analysis,
   powerful filtering and subgrouping, charts, statistical analyses, genomic signatures, and
   bookmarks.

   Paper

   Introduction
   Cancer is a complex disease arising from diverse genomic mechanisms (Hanahan
   2011). Deciphering how normal cells transform into cancerous ones requires vast
   amounts of data (Ledford 2010). Recent advances, including high-throughput, whole-
   genome, and single-cell technologies, are now producing increasingly larger and more
   comprehensive genomics datasets (Mardis 2008). By 2025, the total amount of
   genomics data is expected to match the sum of the three other major producers of large
   data: astronomy, YouTube, and Twitter (Stephens 2015).

   Cancer researchers need powerful, interactive visualization and analysis tools to extract
   knowledge from this deluge of information (Schroeder 2015). As the volume of data
   reaches the level of many petabytes, it is challenging but imperative that tools continue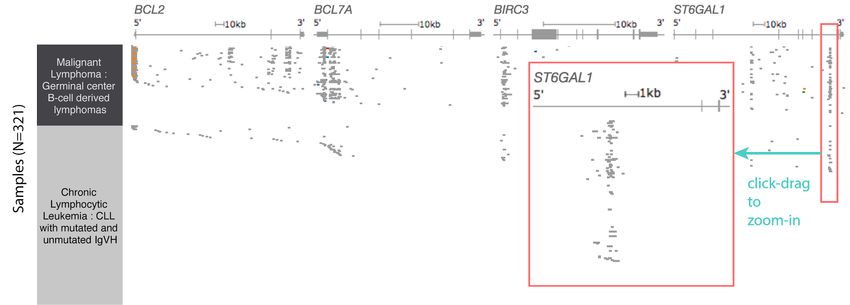
bioRxiv preprint first posted online May. 18, 2018; doi: http://dx.doi.org/10.1101/326470. The copyright holder for this preprint
 (which was not peer-reviewed) is the author/funder, who has granted bioRxiv a license to display the preprint in perpetuity.
                              It is made available under a CC-BY-NC-ND 4.0 International license.

   to respond rapidly to researcher inquiries. Adding to the data volume, the variety of data
   modalities, such as gene expression and somatic mutation, are also expanding. Each of
   these modalities provides a unique window into the genome, which, in concert, give a
   comprehensive picture of an individual cancers' biology. Integration across these
   modalities is challenging but necessary togain a more in-depth understanding of the
   mechanisms for tumorigenesis, metastasis, and treatment response.

   The highly distributed nature of this data also poses a significant challenge. Most
   investigators generate relatively small-scale datasets which are only used by a small
   number of individuals. In contrast, organized large consortia, such as TCGA (The
   Cancer Genome Atlas) (Chin 2011, Chin 2011) and the GDC (Genomic Data
   Commons) (Grossman 2016), generate or host large, high-value datasets that are used
   by researchers all over the world. Despite data sharing efforts, these two sources of
   data tend to be “siloed” and cannot be easily integrated or connected.

   The UCSC Xena system was developed to enable cancer researchers of all
   computational backgrounds to explore large public datasets, as well as their own data,
   no matter where the data is located (Cieślik 2018, Langmead 2018). Xena hosts
   datasets from landmark cancer genomics resources including TCGA, ICGC
   (International Cancer Genome Consortium) (The International Cancer Genome
   Consortium 2010), and the GDC. The system easily supports tens of thousands of
   samples and has been tested up to as many as a million cells. The simple and flexible
   architecture supports a variety of common and uncommon genomic and clinical data
   types. Xena's unique visualizations integrate gene-centric and genomic-coordinate-
   centric views across multiple data modalities, providing a deep, comprehensive view of
   genomic events within a cohort of tumors.

   Results
   UCSC Xena (http://xena.ucsc.edu) is a visual integration and exploration tool for multi-
   omic data. The Xena platform has two components: the web-based Xena Browser and
   the back-end Xena Hubs (Figure 1). The Xena Browser empowers biologists to explore
   data in multiple Xena Hubs using a variety of visualizations and analyses. Each Xena
   Hub is able to host tens of thousands of samples and supports virtually every modality
   of functional genomics data. These turn-key hubs can be configured to be public or
   private and can be installed on laptops, public servers or those behind a firewall, or in
   the cloud (Figure 1). Any number of Xena hubs can be simultaneously connected to the
   Xena Browser with integration occurring in the browser. This allows for data to be
   distributed across multiple Xena Hubs.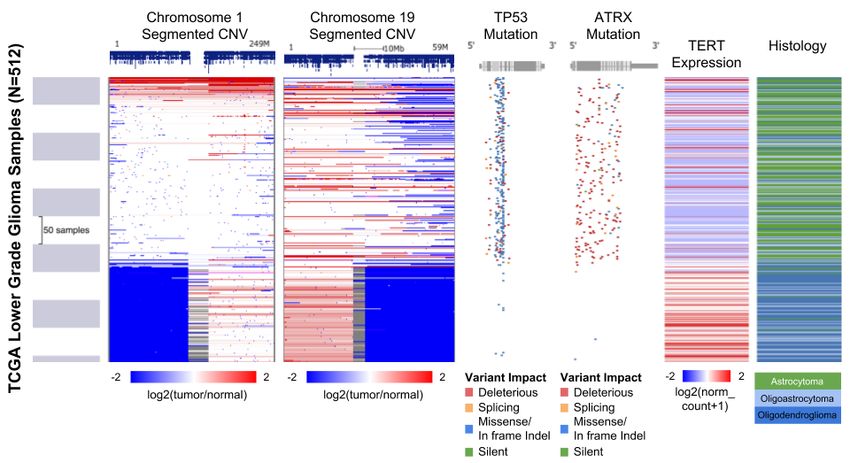
bioRxiv preprint first posted online May. 18, 2018; doi: http://dx.doi.org/10.1101/326470. The copyright holder for this preprint
 (which was not peer-reviewed) is the author/funder, who has granted bioRxiv a license to display the preprint in perpetuity.
                              It is made available under a CC-BY-NC-ND 4.0 International license.

   The decoupled front-end Xena Browser and back-end Xena Hubs architecture has
   several advantages. First, researchers can easily view their own private data by
   installing their own Xena Hub. Data across multiple hubs are combined on the Xena
   Browser, allowing users to view data from separate hubs as a coherent data resource
   while keeping private data secure. More importantly, the Xena platform scales easily. As
   more datasets are generated, more Xena Hubs are added to the network, effectively
   growing with expanding genomics resources.

   Public data resources
   Cancer genomics research is increasingly multi-omic. Today, studies commonly collect
   data on somatic mutations, copy number and gene expression, with other data types
   such as structural variants and protein expression being relatively rare. However, as
   genomics technology advances, we expect that these rarer data types to increase in
   frequency and new data types to be produced. With this in mind we designed Xena to
   be able to load any tabular or matrix formatted data, giving us exceptional flexibility in
   the data types we can visualize. Current supported data modalities include somatic and
   germline SNPs, INDELs, large structural variants, copy number variation, gene-,
   transcript-, exon-, protein-expression, DNA methylation, phenotype, clinical data, and
   sample annotations. Additionally, our wrangled data can be downloaded in bulk and
   used for downstream analyses. We also offer programmatic access to slices of data
   through the Xena python package (https://github.com/ucscXena/xenaPython), which
   can be used independently or in a Jupyter Notebook to access any of the public Xena
   Hubs.

   To showcase seminal cancer genomics data resources, we have deployed eight public
   Xena Hubs in the cloud-computing environment. Together, they host 1512 datasets
   from more than 50 cancer types, including the latest from TCGA, Pan-Cancer Atlas
   (Hoadley 2018), ICGC, PCAWG (Pan-Cancer Analysis of Whole Genomes, Campbell
   2017), and the GDC (Table 1). Our TCGA hub hosts data from TCGA, the most
   comprehensive cancer genomics dataset to-date, with full set of data modalities for
   12,000+ samples across 30+ cancer types. Xena TCGA hub hosts all public-tier TCGA
   derived datasets including somatic mutation, copy number variation, gene and exon
   expression, and more. Our PancanAltas hub hosts data from the latest TCGA project,
   the Pan-Cancer Atlas, which conducted an integrative molecular analysis of the all
   tumors in TCGA. In addition to being uniformly analyzed, there are also highly curated
   datasets such as molecular subtypes and multiple survival endpoints. Our ICGC hub
   hosts data from the ICGC project, a global effort to create a comprehensive description
   of genomic, transcriptomic and epigenomic changes in 50 different tumor types. Our
   PCAWG hub supports the PCAWG project, an analysis of 2,600 ICGC whole-cancer
   genomes and their matching normal tissues across 39 distinct tumour types (Campbell
bioRxiv preprint first posted online May. 18, 2018; doi: http://dx.doi.org/10.1101/326470. The copyright holder for this preprint
 (which was not peer-reviewed) is the author/funder, who has granted bioRxiv a license to display the preprint in perpetuity.
                              It is made available under a CC-BY-NC-ND 4.0 International license.

   2017). Its datasets include somatic mutation data from the whole genome, large
   structural variants, RNAseq-based data analysis, mutational signatures, curated
   histology, and more. Our GDC hub hosts data from GDC, where TCGA and TARGET
   data was uniformly recomputed using state-of-art pipelines and the latest human
   genome assembly, hg38. In addition to these well-known resources, we also host
   results from the Toil RNAseq analysis pipeline, a uniformly re-aligned and re-called
   gene and transcript expression dataset for all TCGA, TARGET and GTEx samples
   (Vivian 2017). This dataset allows users to compare gene and transcript expression of
   TCGA 'tumor' samples to corresponding GTEx 'normal' samples. Our Treehouse hub
   combines data from the Toil hub with Treehouse project
   (https://treehousegenomics.soe.ucsc.edu/explore-our-data/) pediatric samples to
   facilitate interpretation of a pediatric sample in a larger context. The UCSC Public hub
   has data we curated from various literature publications such as CCLE (Cancer Cell
   Line Encyclopedia, Barretina 2012). Xena complements each of these data sources by
   not storing any raw sequencing data, but instead, loading derived datasets, such as
   gene expression estimation and somatic mutation calls, and providing powerful
   interactive visualizations for these data. All public Xena hubs
   (https://xenabrowser.net/hub/) are open access, with no account or login required.

   Turn-key Xena Hub
   Xena Hubs are designed to be turn-key, allowing users who may not be computationally
   savvy to install and run a Xena Hub on their personal computer. Hubs are easily
   initiated using a point-and-click interface or through the command line
   (http://xena.ucsc.edu/private-hubs/). Xena Hubs run on most operating systems,
   including Windows, MAC and Linux. A dockerized version of the Xena Hub can be used
   as part of an automated workflow pipeline to visualize computational results.

   Xena Hubs can be configured to be private or public. Hubs running on a laptop are
   private as they only allow connections from the users' own Xena Browser. Users can
   use a laptop hub to quickly and securely view their own data. Xena Hubs started in the
   cloud or on a server can be kept private by using a firewall. This enables easy sharing
   of pre-publication data within a lab, institution, or as part of a larger collaboration. They
   also can be configured to be public, making the data accessible to the larger community
   after investigation and publication.

   Performance is critical for an interactive visualization tool, especially on the web. As the
   sample size for genomic experiments steadily increases, this has become a challenge
   for many tools. Knowing this, we optimized Xena to support data queries on tens of
   thousands of samples and more, serving slices of genomic and clinical data within a few
   seconds.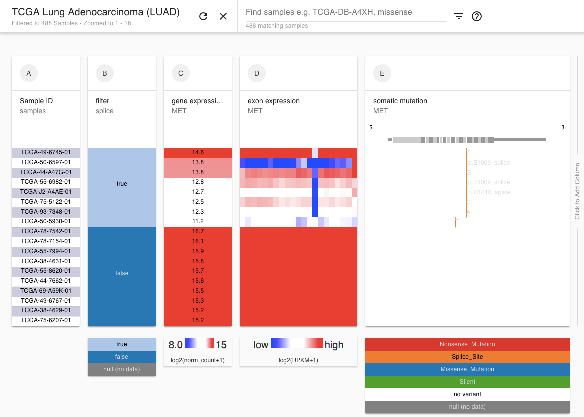
bioRxiv preprint first posted online May. 18, 2018; doi: http://dx.doi.org/10.1101/326470. The copyright holder for this preprint
 (which was not peer-reviewed) is the author/funder, who has granted bioRxiv a license to display the preprint in perpetuity.
                              It is made available under a CC-BY-NC-ND 4.0 International license.

   Xena Browser
   The Xena Browser is an online visual exploration tool for data in one or more Xena
   Hubs. Our visualizations and analyses include the Xena Visual Spreadsheet, survival
   analysis, scatter plots, bar graphs, statistical tests and genomic signatures.
   Sophisticated filtering and searching allows the comparison of dynamically generated
   subgroups. In addition to Xena’s own views, it connects with a variety of complementary
   visualization tools. The Xena Browser supports dynamic genomic signatures, allowing
   users to explore correlations between a score and other -omic data. Its shareable
   bookmarks and high resolution pdfs enhance collaborations and results dissemination.
   We support modern web browsers such as Chrome, Firefox or Safari.

   Visual Spreadsheet
   With multi-omic data, it is essential to view different types of data, such as gene
   expression, copy number, and mutations, on genes or genomic segments side-by-side.
   Integration across these diverse data modalities provides a more biologically complete
   understanding of a genomic event. We designed our primary visualization, the Xena
   Visual Spreadsheet, to facilitate this integration. Analogous to an office spreadsheet
   application, it is a visual representation of a data grid where each column is a slice of
   genomic or phenotypic data (e.g. gene expression), and each row is a single entity (e.g.
   a bulk tumor sample, cell line, or single cells) (Figure 2). Rows of these entities are
   dynamically sorted by the columns of genomics data, enabling the discovery of patterns
   and correlations among genomic parameters. Xena's Visual Spreadsheet data grid
   displays multiple user-requested slices of genomic and phenotypic data over a cohort of
   samples. It excels at integrating diverse sets of genomics data and dynamically sorting
   rows and columns to explore patterns, even when the data are hosted across multiple
   data hubs.

   Xena's Visual Spreadsheet displays genomic data in both gene-centric and coordinate-
   centric views. Gene-centric views show data mapped to a gene or portion of a gene,
   such as exons, transcripts, or specific CpG islands, and can display only exonic regions
   or include data mapped to introns. The coordinate-centric view shows data along the
   genomic coordinate, displaying genomic events such as copy number variation, simple
   mutations or structural variants (Supplemental Figure 1). Genomic intervals, from base
   level up to an entire chromosome, can be viewed through entering specific coordinates
   or through dynamic zooming. Both gene- and coordinate-centric views support coding
   and non-coding regions (Supplemental Figure 2). Links to the UCSC Genome Browser
   give genomic context to any chromosome region. In addition to these various genomics
   views, we also visualize phenotype and clinical data such as age, gender, expression
   signatures, cell types, and subtype classifications. These crucial phenotypic data enable
bioRxiv preprint first posted online May. 18, 2018; doi: http://dx.doi.org/10.1101/326470. The copyright holder for this preprint
 (which was not peer-reviewed) is the author/funder, who has granted bioRxiv a license to display the preprint in perpetuity.
                              It is made available under a CC-BY-NC-ND 4.0 International license.

   users to go beyond the genomic-only discoveries. All these different columns and views
   can be placed side-by-side in a single Xena Visual Spreadsheet.

   The power of the Visual Spreadsheet is its data integration. Integration across different
   data modalities, such as copy number variation, gene expression and DNA methylation,
   gives users a more comprehensive view of a genomic event in a tumor sample. For
   example, higher expression for a gene can be driven by copy number amplification or
   by promoter hypomethylation. Integration across gene- and coordinate-centric views
   helps users examine these events in different genomic contexts. For example, a copy
   number amplification event can be part of chromosomal arm duplication or a focal
   amplification. Integration across genomic and clinical data gives users the ability to
   make connections between genomic patterns and clinically relevant phenotypes such
   as subtype and survival. For example, a mutation in a gene can lead to lower
   recurrence-free survival. These diverse integrations help researchers harness the
   power of comprehensive genomics studies, driving discovery and a deeper
   understanding of cancer biology.

   More browser visualizations and functionalities
   In addition to the Visual Spreadsheet, we support several other powerful views and
   analyses. Our Kaplan-Meier analysis allows users to statistically assess survival
   stratification by any genomic or phenotypic data (Figure 3). Bar charts, box plots and
   scatter plots, all with statistical tests automatically computed (chi-squared, t-test, or
   ANOVA as appropriate), provide additional insights into the data (Supplemental Figure
   3). The Transcript View enables easy comparison of transcript-level expression
   between two groups, such as TCGA 'tumor' vs. GTEx 'normal', for all the transcripts of a
   gene (Figure 4). We also provide context-dependent links to complementary
   visualizations such as the Tumor Map (https://tumormap.ucsc.edu) (Newton 2017) and
   MuPIT in CRAVAT (http://mupit.icm.jhu.edu/) (Niknafs 2013), enabling users to easily
   see a genomic pattern from a different perspective.

   Gene-expression signatures have been developed to differentiate distinct subtypes of
   tumors, identify important cellular responses to their environment (hypoxia), and predict
   clinical outcomes in cancer (Sotiriou 2009). Xena’s genomic signature functionality
   allows users to enter a signature expressed as a weighted sum of a marker gene set, a
   common form seen in publications, and dynamically build a new spreadsheet column of
   the resulting scores. This functionality allows researchers to test existing signatures or
   build new ones, allowing comparison of the signature score with other genomic and
   phenotypic data.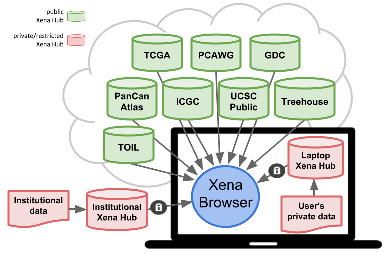
bioRxiv preprint first posted online May. 18, 2018; doi: http://dx.doi.org/10.1101/326470. The copyright holder for this preprint
 (which was not peer-reviewed) is the author/funder, who has granted bioRxiv a license to display the preprint in perpetuity.
                              It is made available under a CC-BY-NC-ND 4.0 International license.

   Our powerful text-based search allows users to dynamically highlight, filter and group
   samples (Figure 5). Researchers can search the data on the screen similar to the ‘find’
   functionality in Microsoft Word. Samples are matched and highlighted in real-time as the
   user types. Researchers can filter, focusing the visualization to their samples of interest,
   or dynamically build a new binary column, where samples are marked as 'true' or 'false',
   depending if they meet the researcher's search criteria. The new two-group column
   behaves like any other column and can be used in a Kaplan-Meier analysis, box plot, or
   other statistical analysis to compare the two sample groups. The find-highlight-new-
   column functionality is a powerful way to dynamically construct two sub-populations of
   samples for comparison and analysis.

   Being able to share and distribute biological insights is crucial in this era of collaborative
   genomics. Xena’s bookmark functionality enables the sharing of live views. With a
   single click, users can generate a URL of their current view, which will take researchers
   back to the live browser session. The URL can be shared with colleagues or included in
   reports or publications. If a view contains data from a non-public Xena Hub, we allow
   users to download the current visualization state as a file. This file can then be
   appropriately shared and imported into the Xena Browser to recreate the live view. By
   giving users a file instead of a URL, we ensure that we never have the user's private
   data on our servers. In addition to bookmarks, researchers can generate a high
   resolution PDF figure of their current visualization for presentations and publications.

   To assist researchers in building a Visual Spreadsheet, we developed a short three-step
   guided wizard. This ensures that even new users who are unfamiliar with Xena can
   build basic visualizations. We also provide links to live examples that showcase useful
   and scientifically interesting visualizations, highlighting the power of Xena. We focus on
   supporting our users by developing training videos, online and in-person workshops,
   and help documentation. We keep users up-to-date on new features and datasets
   through our social media accounts, mailing lists and monthly newsletter.

   Discussion
   UCSC Xena is a tool for cancer researchers to explore, visualize, and analyze
   functional genomics data. We host many large public datasets, such as TCGA, Pan-
   Cancer Atlas, PCAWG, GDC, and ICGC, helping to make these powerful resources
   accessible to investigators. The Visual Spreadsheet, sophisticated filtering and
   subgrouping, and Kaplan-Meier analysis enable researchers of all computational
   backgrounds to investigate complex genomics datasets. We support virtually all data
   modalities including mutations, copy number, expression, phenotype and clinical data
   as well as rare data types such as non-coding mutations, large structural variants, and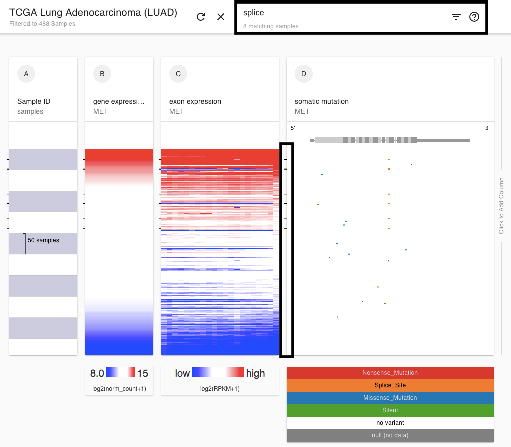
bioRxiv preprint first posted online May. 18, 2018; doi: http://dx.doi.org/10.1101/326470. The copyright holder for this preprint
 (which was not peer-reviewed) is the author/funder, who has granted bioRxiv a license to display the preprint in perpetuity.
                              It is made available under a CC-BY-NC-ND 4.0 International license.

   RNAseq-based gene fusion calls. Integration across different data modalities and
   visualizations, as well as between genomic and clinical data yield insightful views into
   cancer biology.

   UCSC Xena complements existing tools including the cBio Portal
   (http://www.cbioportal.org/, Cerami 2012), ICGC Portal (https://dcc.icgc.org/, Zhang
   2011), GDC Portal (https://portal.gdc.cancer.gov/, Jensen 2017), IGV
   (http://software.broadinstitute.org/software/igv/, Thorvaldsdóttir 2013), and St. Jude
   Cloud (https://stjude.cloud/, Ma 2018), by focusing on providing a federated platform to
   visualize data across multiple hubs simultaneously. This enables biologists to easily
   view their own data as well as consortium data while still maintaining data privacy.
   Additionally, Xena focuses on simultaneous, integrative visualization of multi-omics
   datasets across different genomic contexts, including gene, genomic element, or any
   genomic region for both coding and non-coding part of the genome. Finally, Xena is
   built for performance. It can easily visualize of tens of thousands of samples in a few
   seconds and has been tested up to a million cells. With single-cell technology becoming
   more common, functional genomics datasets will increase in size several orders of
   magnitude larger than traditional bulk tumor samples. Xena is well-positioned to rise to
   the challenge.

   While it is widely recognized that data sharing is key to advancing cancer research, how
   it is shared can impact the ease of data access. UCSC Xena is a designed for cancer
   researchers both with and without computational expertise to share and access data.
   Users without a strong computational background can explore their own data by
   installing a Xena Hub on their personal computer using our point-and-click interface.
   Bioinformaticians can install a private or public Xena Hub on a server or in the cloud or
   as part of an analysis pipeline, making the generated data available in a user-friendly
   manner that requires little extra effort. Data sharing has, and will continue to, advance
   cancer biology and Xena is part of the technological ecosystem that helps support this
   priority.

   UCSC Xena is a scalable solution to the rapidly expanding and decentralized cancer
   genomics data. Xena's architecture, with it’s detached data hubs and web-browser-
   based visualization, allows new projects to easily add their data to the growing
   compendium that we support. Additionally, by maintaining a flexible tabular and matrix
   data input format, we support many different data modalities, both current and future. In
   this age of expanding data resources, Xena's design supports the ongoing needs of the
   cancer research community.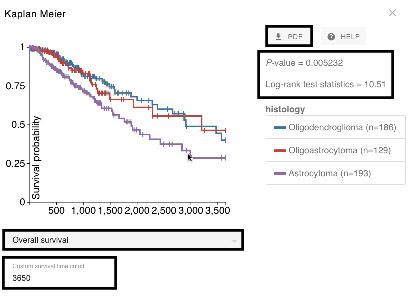
bioRxiv preprint first posted online May. 18, 2018; doi: http://dx.doi.org/10.1101/326470. The copyright holder for this preprint
 (which was not peer-reviewed) is the author/funder, who has granted bioRxiv a license to display the preprint in perpetuity.
                              It is made available under a CC-BY-NC-ND 4.0 International license.

   Xena excels at viewing cohorts of samples, cells, or cell lines and showing trends
   across those entities, whether they be human or a model organism. While we have
   focused on cancer genomics, the platform is general enough to host any functional
   genomics data. We hope to expand Xena to continue to help serve the genomics needs
   of the biomedical community.

   Acknowledgements
   Research reported in this publication was supported by National Cancer Institute of the
   National Institutes of Health under award numbers 5U24CA180951-04 and
   5U24CA210974-02. The content is solely the responsibility of the authors and does not
   necessarily represent the official views of the National Institutes of Health. We would
   also like to thank AWS Cloud Credits for Research as well as Google Summer of Code.

   Methods

   Data
   Functional genomics data are downloaded from each respective source,, wrangled into
   a generic tabular or matrix format, and then loaded into a corresponding hub. Specific
   wrangling steps along with any normalization that was performed is listed for each
   dataset in the Xena Browser dataset pages (https://xenabrowser.net/datapages/). The
   wrangled data is available for download from the dataset pages.

   Xena Hub
   The Xena Hub is a JVM-based application, written in Clojure, that serves functional
   genomic data (http://xena.ucsc.edu/private-hubs/) over HTTP. It exposes a relational
   query API for metadata and data slicing. Using a query language instead of REST
   allows us to decouple the client and server. To support interactive visualization REST
   APIs have to be denormalized for performance (e.g. by joining related objects, and
   projecting the result). This creates a tight coupling between the REST endpoints and
   particular views: a novel view requires a novel denormalization. A query language
   allows us to fetch exactly the data we need, and only the data we need, for quickly
   evolving visualizations and data shapes, without redeployment of the hubs. This is
   similar in motivation to Facebook's GraphQL, and Netflix's Falcor, but predates them.

   Internally, Xena Hubs use the H2 database for storage. Data is stored in opaque blocks
   in a column orientation, which allows fast retrieval of a field for all samples of a dataset,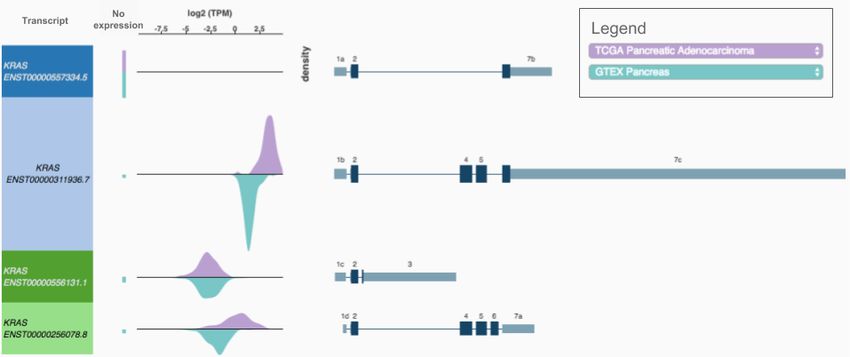
bioRxiv preprint first posted online May. 18, 2018; doi: http://dx.doi.org/10.1101/326470. The copyright holder for this preprint
 (which was not peer-reviewed) is the author/funder, who has granted bioRxiv a license to display the preprint in perpetuity.
                              It is made available under a CC-BY-NC-ND 4.0 International license.

   or a subset of samples. A hub can be installed either via the command line or via the
   point-and-click install4j GUI.

   Xena Browser
   The Xena Browser is a javascript application to visualize and analyze functional
   genomics data stored in one or more Xena Hubs. The primary technologies are React,
   the 2D canvas API, and RxJS. Babel is used for es6 support, and webpack for the build.
   The application architecture is an asynchronous model similar to redux-observable
   (https://redux-observable.js.org/), with semantic actions that update application state,
   and action side-effects creating Rx streams that will dispatch later actions. The redux
   (https://redux.js.org/), or Om (https://github.com/omcljs/om), pattern of immutable,
   single-atom state makes it simple to keep multiple views in sync, and provides “time
   travel” debugging during development.

   We prefer the canvas API to SVG libraries such as D3, because it performs better at our
   data scale. With the advances in javascript JIT compilers, we find that optimized loops
   over canvas pixel buffers out-perform geometric drawing primitives, such as rect(), and
   stroke(), when rendering dense views of large data.

   The jsverify property-based testing library (http://jsverify.github.io/) is used for unit and
   integration testing. Property-based, or "generative" testing is similar to fuzzing --
   generating random test cases, and asserting invariants over the results -- but on failure,
   attempts to find a minimal failing test case. This usually results in more tractable failure
   cases. Property-based testing allows us to test a much larger portion of the input space
   than conventional "known-answer" unit tests, and frequently identifies failure cases that
   we would never think to test.

   All of our code is open source and available for reuse under and Apache 2.0 license
   (https://github.com/ucscXena). We also have contributed two javascript modules to
   BioJS (Gómez 2013), including a Kaplan-Meier module
   (https://github.com/ucscXena/kaplan-meier) to compute Kaplan-Meier statistics, and a
   static-interval-tree library (https://github.com/ucscXena/static-interval-tree) to effectively
   find overlapping intervals in one dimension.

   Public Xena Hubs
   We deploy all public-facing hubs in a cloud-computing environment.
bioRxiv preprint first posted online May. 18, 2018; doi: http://dx.doi.org/10.1101/326470. The copyright holder for this preprint
(which was not peer-reviewed) is the author/funder, who has granted bioRxiv a license to display the preprint in perpetuity.
It is made available under a CC-BY-NC-ND 4.0 International license.
Figures and Tables
Figure 1
Figure 1. Diagram of the UCSC Xena platform architecture. Multiple Xena Hubs (each
shown as a database icon) are connected to the Xena Browser simultaneously. Public
Hubs are in green and and private Hubs in red. In this example, private data from an
independent research collaboration (in red) can be loaded into their own private Xena
Hubs, on their servers or on a researcher's computer. Data integration occurs within the
Xena Browser on the user's computer. The lock icon indicates that only authorized
users have access to the private Xena Hubs. This design achieves data integration
across both public and private resources while maintaining each hub’s data
confidentiality.bioRxiv preprint first posted online May. 18, 2018; doi: http://dx.doi.org/10.1101/326470. The copyright holder for this preprint
(which was not peer-reviewed) is the author/funder, who has granted bioRxiv a license to display the preprint in perpetuity.
It is made available under a CC-BY-NC-ND 4.0 International license.
Figure 2
Figure 2. A Xena Visual Spreadsheet showing genetic separation of TCGA lower grade
gliomas into two distinct groups with the bottom group being characterized by loss of
chromosome arms 1p and 19q, and relatively high expression of TERT and the top one
by TP53 and ATRX mutations. Each row in the view corresponds to a single sample.
The first column shows the scale of samples and is followed by data columns. The rows
are sorted by the left most data column (column B) and sub-sorted on subsequent
columns. Starting on the left, data columns are chromosome 1 and 19 copy number
segments, TP53 and ATRX mutation status, TERT gene expression, and sample
histology. Copy number segments (columns B, C) display genes in dark blue at the top.
Amplifications are in red and deletions in blue. Mutations (columns D, E) show a gene
diagram at the top with exons in grey boxes with coding regions being taller and
untranslated regions being shorter. The position of each mutation is marked in relation
to the gene diagram and colored by its functional impact. Deleterious mutations are in
red, missense mutations and in-frame indels are in blue, and synonymous mutations
are in green. Gene expression (column F) is colored red to blue for high to low
expression. Samples at the top of the view are enriched for the astrocytoma histological
subtype, while the samples at the bottom tend to be the oligodendroglioma subtype.
https://xenabrowser.net/heatmap/?bookmark=6b236d77538128421ee9c32911ce173abioRxiv preprint first posted online May. 18, 2018; doi: http://dx.doi.org/10.1101/326470. The copyright holder for this preprint
(which was not peer-reviewed) is the author/funder, who has granted bioRxiv a license to display the preprint in perpetuity.
It is made available under a CC-BY-NC-ND 4.0 International license.
Figure 3
Figure 3. A Xena Kaplan-Meier analysis of overall survival for the TCGA lower grade
glioma histological subtypes. Black boxes in the figure highlight, top to bottom, the
ability to generate a PDF, statistical analysis results, the ability to select different
survival endpoints such as overall or recurrence-free survival, and custom survival time
cutoff (currently set to 3,650 days, or 10 years). This figure shows that patients
characterized as having the astrocytoma histological subtype have significantly worse
10-year overall survival compared to the oligodendroglioma and oligoastrocytoma
subtypes (p < 0.05).
https://xenabrowser.net/heatmap/?bookmark=2f9d783982879594dd0f52564058372dbioRxiv preprint first posted online May. 18, 2018; doi: http://dx.doi.org/10.1101/326470. The copyright holder for this preprint
(which was not peer-reviewed) is the author/funder, who has granted bioRxiv a license to display the preprint in perpetuity.
It is made available under a CC-BY-NC-ND 4.0 International license.
Figure 4
Figure 4. A Xena Transcript View showing four KRAS transcripts' expression for TCGA
pancreatic adenocarcinoma and GTEx normal pancreas tissue. To generate a view, a
researcher enters a gene and select two populations. The visualization will display, for
all transcripts for that gene, a double (top and bottom) density distribution of transcript
expression in each population. We see that for KRAS, transcript ENST00000311936.7
(second from the top), has higher expression in pancreatic tumors (TCGA) compared to
the normal pancreas tissue (GTEx).
http://dev.xenabrowser.net/transcripts/?bookmark=80d9c57b471b654cc569d4ceb44e65
91bioRxiv preprint first posted online May. 18, 2018; doi: http://dx.doi.org/10.1101/326470. The copyright holder for this preprint
(which was not peer-reviewed) is the author/funder, who has granted bioRxiv a license to display the preprint in perpetuity.
It is made available under a CC-BY-NC-ND 4.0 International license.
Figure 5
a.
b.bioRxiv preprint first posted online May. 18, 2018; doi: http://dx.doi.org/10.1101/326470. The copyright holder for this preprint
(which was not peer-reviewed) is the author/funder, who has granted bioRxiv a license to display the preprint in perpetuity.
It is made available under a CC-BY-NC-ND 4.0 International license.
Figure 5. Xena Browser text-based find, highlight, filter, and subgroup samples
functionality. (a) Finding and highlighting samples in TCGA lung adenocarcinoma cohort
that have a splice mutation in MET. Similar to the ‘find in document’ feature in Microsoft
Word, users can search all data on the screen. In this figure, the Xena Browser
searched all columns for the user's search term 'splice' and highlighted those samples
with a 'splice' mutation with black tick marks (indicated by the black box). Other
supported operations include 'AND', 'OR', '>', 'bioRxiv preprint first posted online May. 18, 2018; doi: http://dx.doi.org/10.1101/326470. The copyright holder for this preprint
(which was not peer-reviewed) is the author/funder, who has granted bioRxiv a license to display the preprint in perpetuity.
It is made available under a CC-BY-NC-ND 4.0 International license.
Beltran 2006, The Cancer Genome Atlas Research Network 2014).
https://xenabrowser.net/heatmap/?bookmark=2239102135132b7fbd482204aa723a95
Table 1
Data Hub Samples List of Data Types
copy number, gene-, exon-, miRNA-, and protein-expression,
TCGA 12,811
somatic mutation, DNA methylation, survival, and clinical data
copy number, gene-, miRNA-, and protein-expression, somatic
Pancan
12,591 mutation, DNA methylation, molecular subtypes, curated
Atlas
survival, and clinical data
copy number, gene expression, somatic coding mutation, and
ICGC 17,677
somatic whole-genome mutation (non-TCGA only)
whole-genome copy number, somatic mutations, large structural
variants, gene- and miRNA-expression, RNAseq based gene
PCAWG 3,205 fusion, alternative promoter usage, RNAseq based slicing
events, purity, ploidy, mutational signature, survival, and curated
histology
Toil 19,340 TCGA, TARGET and GTEx gene and transcript expression
copy number, somatic mutations, gene and miRNA expression,
GDC 20,157
overall survival, and phenotypes
TCGA, TARGET and Treehouse partnering clinical studies gene
Treehouse 11,078
and transcript expression
UCSC Somatic mutation, gene expression, copy number, and clinical
*
Public data on adult and pediatric cancer, cell lines and mouse models
Table 1. Summary of data hosted on Public Xena Hubs. *Number of samples is not
listed for the UCSC Public Hub because each of the 44 cohorts are individual studies.bioRxiv preprint first posted online May. 18, 2018; doi: http://dx.doi.org/10.1101/326470. The copyright holder for this preprint
(which was not peer-reviewed) is the author/funder, who has granted bioRxiv a license to display the preprint in perpetuity.
It is made available under a CC-BY-NC-ND 4.0 International license.
Supplemental Figures
Supplemental Figure 1
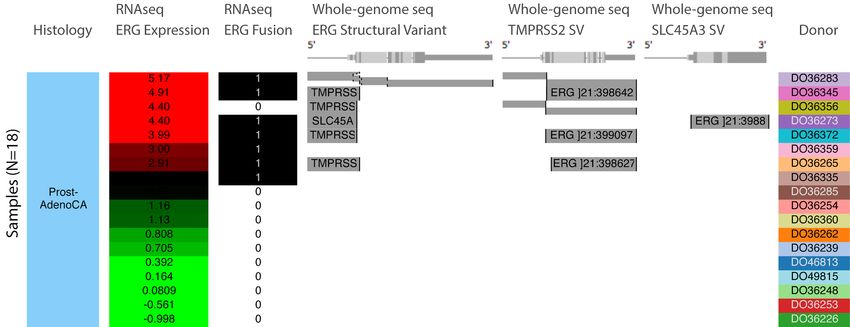
Supplemental Figure 1. Visualization of large structural variants. This figure shows the
frequent ERG fusion in PCAWG prostate cancer detected by both RNA-seq and DNA-
seq analysis. Columns, starting at the left, correspond to histology, ERG gene
expression, and ERG fusion based on RNA-seq data. Gene expression is colored red to
green for high to low expression. In the ERG fusion column samples that have a fusion
are marked with 1 and those that do not are marked with 0. The next three columns
show structural variant calls made using whole-genome DNA-seq data for ERG,
TMPRSS2, and SLC45A3. Precise breakpoints are mapped to gene annotations. A grey
bar indicates an external piece of DNA that is fused at the breakpoint. Gene names on
the grey bars show the origin of the external DNA that is joined. This figure shows that
TMPRSS2 and SLC45A3 are fusion partners for ERG, and that these fusions correlate
with over-expression of ERG. Fusions detected by RNA-seq and whole-genome
sequencing are not always consistent. Here, even using a consensus of DNA-based
detection methods, one fusion detected by a consensus of RNA-based detectors is
missed, and the converse is also seen. This example shows that an integrated
visualization across multiple data types and algorithms provides a more accurate model
of a genomic event.
https://xenabrowser.net/heatmap/?bookmark=24ad428d0f3bf3bf3205bcffab64d276bioRxiv preprint first posted online May. 18, 2018; doi: http://dx.doi.org/10.1101/326470. The copyright holder for this preprint
(which was not peer-reviewed) is the author/funder, who has granted bioRxiv a license to display the preprint in perpetuity.
It is made available under a CC-BY-NC-ND 4.0 International license.
Supplemental Figure 2
Supplemental Figure 2. Visualization of both coding and non-coding mutations from a
gene-centric perspective in ICGC lymphoma. The columns left to right are cancer type,
BCL2, BCL7A, BIRC3 and ST6GAL1 mutation status, respectively. Gene diagrams are
shown at the top of each column with exons in light and dark grey boxes with coding
regions being taller and untranslated regions being shorter. The position of each
mutation is marked in relation to the gene diagram and colored by its functional impact,
with deleterious mutations in red, missense mutations and in-frame indels in blue,
synonymous mutations in green, splice site mutations in orange, and mutations with an
unknown functional impact in grey. This figure shows the frequent intronic mutations in
these genes, which are visible via our dynamic toggle to show or hide introns. These
mutation 'pile-ups' would be not be visible if viewing exomes only. While the majority of
the intronic mutations in this view have an unknown impact (shown in grey), they do
overlap with known enhancers regions (Mathelier 2015).
https://xenabrowser.net/heatmap/?bookmark=d2a79e46e22456036a732c49c2e4c5b3bioRxiv preprint first posted online May. 18, 2018; doi: http://dx.doi.org/10.1101/326470. The copyright holder for this preprint
(which was not peer-reviewed) is the author/funder, who has granted bioRxiv a license to display the preprint in perpetuity.
It is made available under a CC-BY-NC-ND 4.0 International license.
Supplemental Figure 3
Supplemental Figure 3. Xena Chart View showing a box plot of TERT expression for
each of the TCGA lower grade glioma histological subtypes. Columns created in the
Visual Spreadsheet (Figure 2) are used to construct the chart. Statistical analyses are
automatically computed. This view shows a significant expression difference for TERT
between oligodendroglioma, oligoastrocytoma and astrocytoma histologies (one-way
ANOVA, p < 0.05).
https://xenabrowser.net/heatmap/?bookmark=ae1a7f260e8d95bd3c1742503de32192bioRxiv preprint first posted online May. 18, 2018; doi: http://dx.doi.org/10.1101/326470. The copyright holder for this preprint
(which was not peer-reviewed) is the author/funder, who has granted bioRxiv a license to display the preprint in perpetuity.
It is made available under a CC-BY-NC-ND 4.0 International license.
References
Barretina, J., Caponigro, G., Stransky, N., Venkatesan. K., Margolin. A.A., et al. The
Cancer Cell Line Encyclopedia enables predictive modelling of anticancer drug
sensitivity. Nature 483, 603-607 (2012).
Campbell, P. J., Getz, G., Stuart, J. M., Korbel, J. O., Stein L. D., et al. Pan-cancer
analysis of whole genomes. Preprint at
https://www.biorxiv.org/content/early/2017/07/12/162784 (2017).
The Cancer Genome Atlas Research Network. Comprehensive molecular profiling of
lung adenocarcinoma. Nature 511, 543–550 (2014).
Campbell, P. J., Getz, G., Stuart, J. M., Korbel, J. O., Stein, L. D., et al. Pan-cancer
analysis of whole genomes. Preprint at
https://www.biorxiv.org/content/early/2017/07/12/162784 (2017).
Cerami, E., Gao, J., Dogrusoz, U., Gross, B. E, Sumer, S. O., et al. The cBio Cancer
Genomics Portal: An Open Platform for Exploring Multidimensional Cancer Genomics
Data. Cancer Discovery 5, 401-404 (2012).
Chin, L., Hahn, W.C., Getz, G. & Meyerson, M. Making sense of cancer genomic data.
Genes & Development 25, 534-555 (2011).
Chin, L., Andersen, J.N. & Futreal, P.A. Cancer genomics: from discovery science to
personalized medicine, Nature Medicine 17, 297-303 (2011).
Cieślik, M. & Chinnaiyan, A. M. Cancer transcriptome profiling at the juncture of clinical
translation. Nature Reviews Genetics 19, 93–109 (2018).
Gómez, J., García, L. J., Salazar, G. A., Gore, J. V. S., García, A., et al. BioJS: an open
source JavaScript framework for biological data visualization. Bioinformatics 29, 1103–
1104 (2013)
Grossman, R.L., Heath, A. P., Ferretti, V., Varmus, H. E., Lowy, D. R., et al. Toward a
Shared Vision for Cancer Genomic Data. New England Journal of Medicine 375, 1109-
1112 (2016).
Hanahan, D. & Weinberg, R. A. Hallmarks of Cancer: The Next Generation. Cell 144(5),
646-674 (2011).bioRxiv preprint first posted online May. 18, 2018; doi: http://dx.doi.org/10.1101/326470. The copyright holder for this preprint
(which was not peer-reviewed) is the author/funder, who has granted bioRxiv a license to display the preprint in perpetuity.
It is made available under a CC-BY-NC-ND 4.0 International license.
Hoadley, K. A., Yau, C., Hinoue, T., Wolf, D. M., Lazar, A. J., et al. Cell-of-Origin
Patterns Dominate the Molecular Classification of 10,000 Tumors from 33 Types of
Cancer. Cell 173(2), 291–304 (2018).
The International Cancer Genome Consortium. International network of cancer genome
projects. Nature 464, 993–998 (2010).
Jensen, M. A., Ferretti, V., Grossman, R. L. & Staudt, L. M. The NCI Genomic Data
Commons as an engine for precision medicine. Blood 130, 453-459 (2017).
Kong-Beltran, M., Seshagiri, S., Zha, J., Zhu, W., Bhawe, K., et al. Somatic mutations
lead to an oncogenic deletion of met in lung cancer. Cancer Research 66, 283-289
(2006).
Langmead, B. & Nellore, A. Cloud computing for genomic data analysis and
collaboration. Nature Reviews Genetics 19, 208–219 (2018).
Ledford, H. Big science: The cancer genome challenge. Nature 464, 972-974 (2010).
Ma, X., Liu, Y., Liu, Y., Alexandrov, L. B., Edmonson, M.N., et al. Pan-cancer genome
and transcriptome analyses of 1,699 paediatric leukaemias and solid tumours. Nature
555, 371-376 (2018)
Mardis, E. R. The impact of next-generation sequencing technology on genetics. Trends
in Genetics 24, 133-141 (2008).
Mathelier, A., Lefebvre, C., Zhang, A. W., Arenillas, D. J., Ding, J., et al. Cis-regulatory
somatic mutations and gene-expression alteration in B-cell lymphomas. Genome
Biology 16, 84 (2015).
Newton, Y., Novak, A. M., Swatloski, T., McColl, D. C., Chopra, S., et al. TumorMap:
Exploring the Molecular Similarities of Cancer Samples in an Interactive Portal. Cancer
Research 77, e111–114 (2017)
Niknafs, N., Kim, D., Kim, R., Diekhans, M., Ryan, M., et al. MuPIT interactive:
webserver for mapping variant positions to annotated, interactive 3D structures. Human
Genetics 132, 1235–1243 (2013)bioRxiv preprint first posted online May. 18, 2018; doi: http://dx.doi.org/10.1101/326470. The copyright holder for this preprint
(which was not peer-reviewed) is the author/funder, who has granted bioRxiv a license to display the preprint in perpetuity.
It is made available under a CC-BY-NC-ND 4.0 International license.
Schroeder, M. P., Gonzalez-Perez, A. & Lopez-Bigas, N. Visualizing multidimensional
cancer genomics data. Genome Medicine 5, 9 (2013).
Sotiriou, C. & Pusztai, L. Gene-Expression Signatures in Breast Cancer. New England
Journal of Medicine 360, 790-800 (2009).
Stephens, Z. D., Lee, S. L., Faghri, F., Campbell, R. H., Zhai, C., et al. Big Data:
Astronomical or Genomical? PLOS Biology (2015).
Thorvaldsdóttir, H., Robinson, J. T., & Mesirov, J. P. Integrative Genomics Viewer
(IGV): high-performance genomics data visualization and exploration. Briefings in
Bioinformatics 14, 178–192 (2013).
Vivian, J., Rao, A. A., Nothaft, F. A., Ketchum, C., Armstrong, J., et al. Toil enables
reproducible, open source, big biomedical data analyses. Nature Biotechnology 35,
314-316 (2017).
Zhang, J., Baran, J., Cros, A., Guberman, J. M., Haider, S., et al. International Cancer
Genome Consortium Data Portal—a one-stop shop for cancer genomics data.
Database 2011, (2011).You can also read