The Urban Food System of Cape Town, South Africa - HUNGRY CITIES PARTNERSHIP - HUNGRY CITIES REPORT NO. 3 - Hungry ...
←
→
Page content transcription
If your browser does not render page correctly, please read the page content below
HUNGRY CITIES PARTNERSHIP

The Urban Food System of
Cape Town, South Africa

     HUNGRY CITIES REPORT NO. 3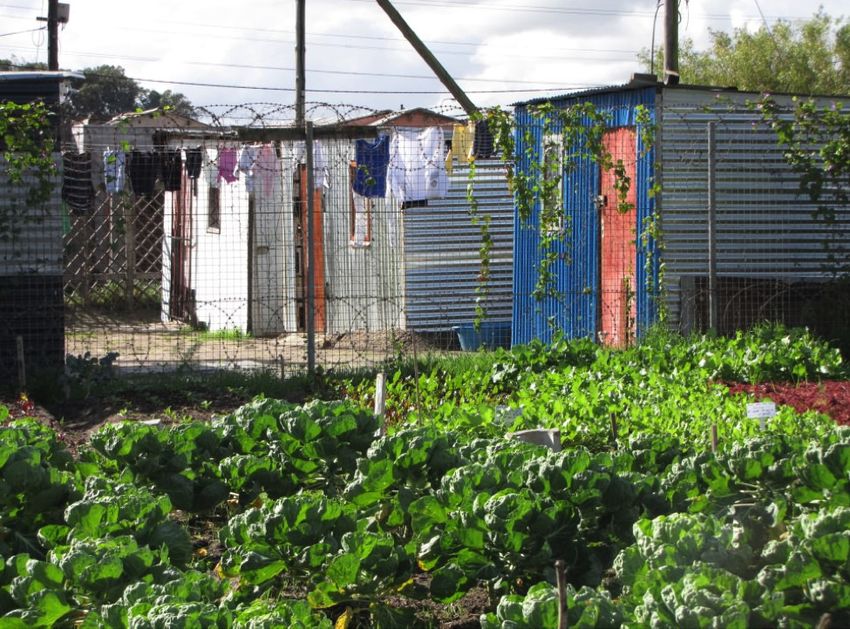
HUNGRY CITIES PARTNERSHIP

  THE URBAN FOOD SYSTEM
OF CAPE TOWN, SOUTH AFRICA

   GARETH HAYSOM, JONATHAN CRUSH
          AND MARY CAESAR

  SERIES EDITOR: PROF. JONATHAN CRUSH

     HUNGRY CITIES REPORT NO. 3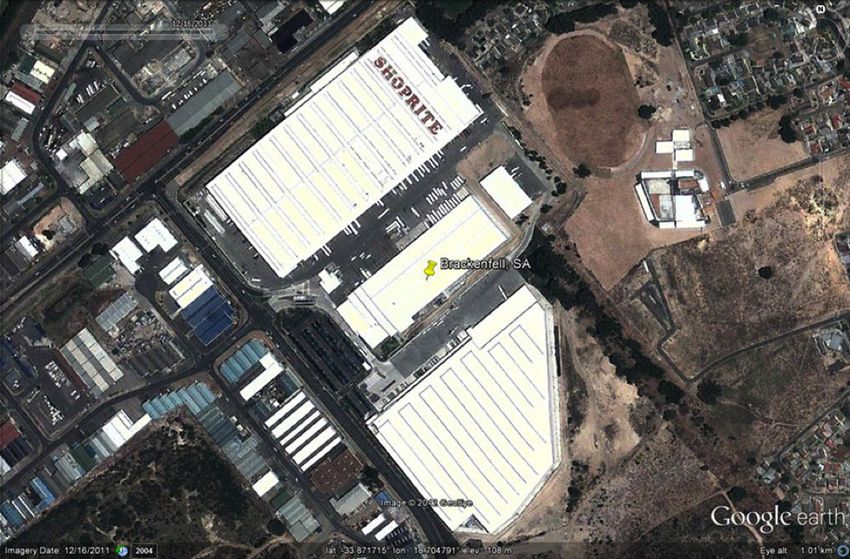
ACKNOWLEDGEMENTS
The research and publication of this report was funded by the Social
Sciences and Humanities Research Council (SSHRC) and the Interna-
tional Development Research Centre (IDRC) under the International
Partnerships for Sustainable Societies (IPaSS) Program. The authors
wish to thank Bronwen Dachs and Maria Salamone for their assistance
in preparing this report.

© HUNGRY CITIES PARTNERSHIP 2017

Published by the Hungry Cities Partnership
African Centre for Cities, University of Cape Town, South Africa,
and Wilfrid Laurier University/Balsillie School of International Affairs,
Waterloo, Canada
hungrycities.net

First published 2017

ISBN 978-1-920597-22-1

Production by Bronwen Dachs Muller, Cape Town

All rights reserved. No part of this publication may be reproduced or
transmitted, in any form or by any means, without prior permission from
the publishers.
AUTHORS
Gareth Haysom is Southern Cities Project Co-ordinator for the Hungry Cities
Partnership at the African Centre for Cities, University of Cape Town, South
Africa.

Jonathan Crush is Hungry Cities Partnership Director and the CIGI Chair in
Global Migration and Development at the Balsillie School of International Affairs,
Waterloo, Canada.

Mary Caesar is a Postdoctoral Fellow at the Balsillie School of International
Affairs.

Previous Publications in the Hungry Cities Report Series

No 1    The Urban Food System of Nanjing, China
No 2    The Urban Food System of Maputo, Mozambique
CONTENTS PAGE
1. Background 1
2. Demography of Cape Town 3
2.1 Population Composition 3
2.2 Population Distribution and Density 6
3. Formal Economy of Cape Town 11
3.1 Major Economic Activities 11
3.2 Employment and Unemployment 12
4. The Informal Economy 14
4.1 Size and Significance 14
4.2 Policies Towards Informality 21
5. Poverty and Income 23
5.1 Household and Personal Income 23
5.2 Housing Type 24
6. The Urban Food System 25
6.1 Sources of Food and Food Flows 28
6.1.1 National Food Sources 28
6.1.2 International Food Sources 33
6.1.3 Commercial Agriculture within Cape Town 34
6.1.4 Philippi Horticultural Area 37
6.2 Urban Agriculture 38
6.3 Food Processing 41
6.4 Food Retailing 43
6.4.1 Cape Town Fresh Produce Market (CTFPM) 43
6.4.2 Supermarket Dominance of Formal Food Retail 45
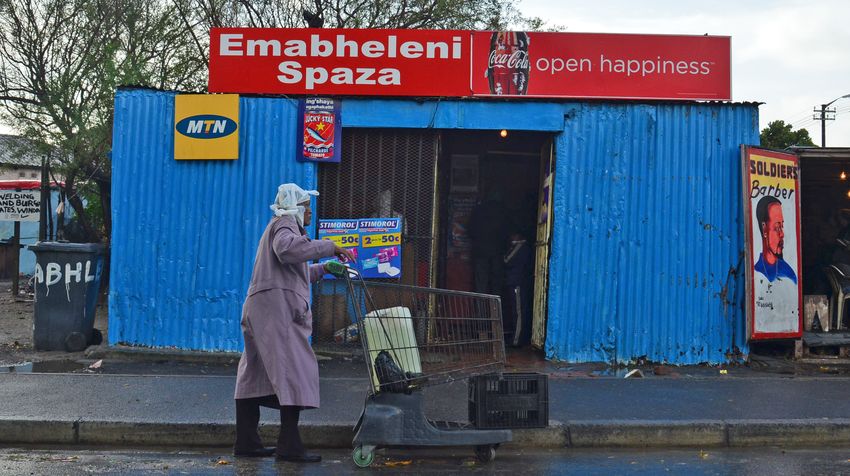
6.4.3 Informal Food Economy 49
7. Urban Food Security 53
7.1 Levels of Household Food Insecurity 53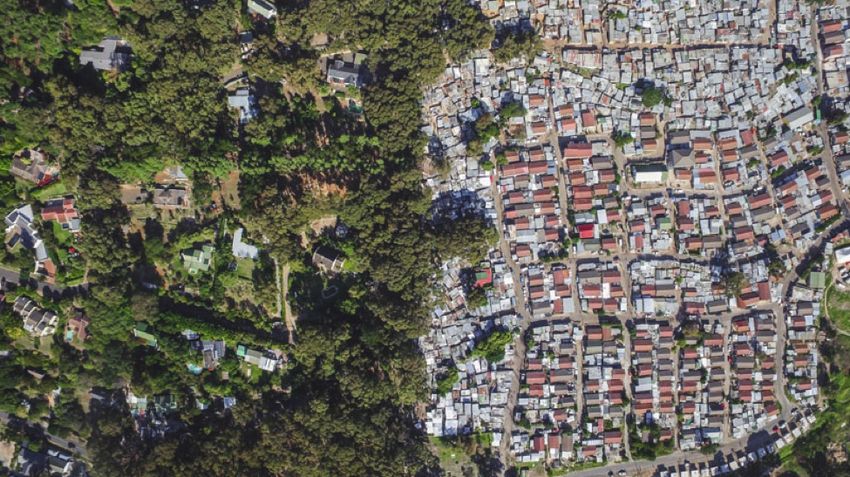
7.2 Determinants of Food Insecurity                                      56
       7.2.1 Household Income                                               56
       7.2.2 Social Protection                                              58
       7.2.3 Sources of Food                                                58
8. Conclusion                                                               59
References                                                                  59

LIST OF TABLES
Table 1:   Population Increase of the City of Cape Town, 1901-2014           2
Table 2:   Racial and Gender Profile of Cape Town, 2011                      3
Table 3:   Population Projections for Cape Town to 2031                      4
Table 4:   Number of Households in Cape Town, 1996-2011                      4
Table 5:   Racial Composition of Cape Town Suburbs                           8
Table 6:   Characteristics of Participants in the Informal Sector           15
Table 7:   Country of Origin of Informal Migrant Entrepreneurs              19
Table 8:   Immigration Status of Informal Migrant Entrepreneurs             19
Table 9:   Business Locations of Informal Migrant Enterprises               20
Table 10: Households by Type of Dwelling, 2011                              25
Table 11: Housing Type by Race, 2001 and 2011                               25
Table 12: Sectoral Share of Agricultural Output,1981-2013                   29
Table 13: Major Imports and Exports from Cape Town, 2014                    34
Table 14: Value of Agricultural Production in Magisterial Districts, 2007   36
          (rand per ha)
Table 15: Livestock Holdings in Magisterial Districts, 2007                 36
Table 16: Types of Food Vendor at Mitchell’s Plain Interchange              51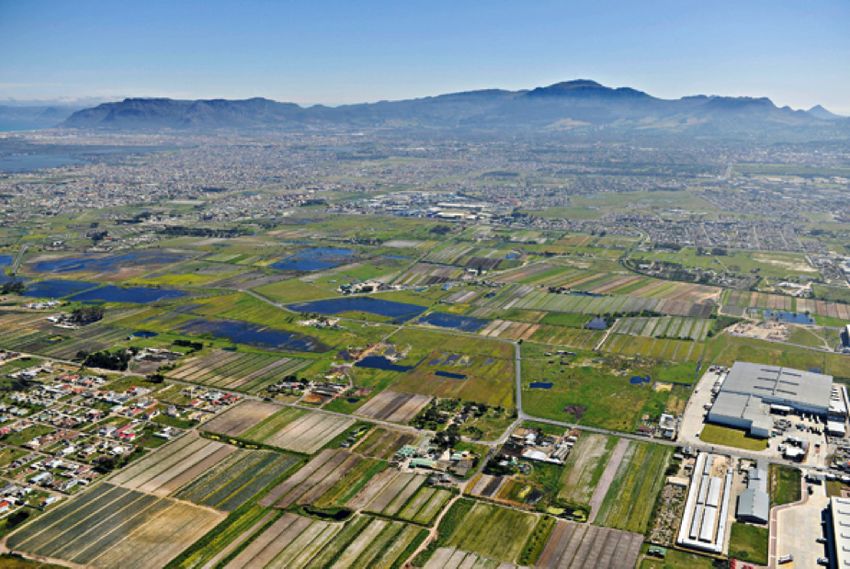
LIST OF FIGURES
Figure 1: Population Increase by Race in Cape Town, 1910-2011               2
Figure 2: Decline in Average Household Size, 1996-2011                      5
Figure 3: Population Pyramid of Cape Town, 2011                             5
Figure 4: Cape Town Central Business District with Suburbs of               6
          Green Point and Sea Point
Figure 5: Mix of Formal and Informal Housing, Khayelitsha, Cape Town        7
Figure 6: Imizamo Yethu in Hout Bay                                         7
Figure 7: Dominant Population Group in Suburbs of Cape Town                 8
Figure 8: Population Density in Cape Town, 2011                            10
Figure 9: Comparison of National and Cape Town GDP Indices                 11
Figure 10: Sectoral Contributions to Economic Growth, 2005-2014            12
Figure 11: Employment in Cape Town, 2008 to 2015                           13
Figure 12: Employment by Sector in Cape Town, 2013-15                      13
Figure 13: South African and Cape Town Unemployment Rates, 2008-2015 14
Figure 14: Characteristics of Informal Sector by Location                  16
Figure 15: Informal Micro-Enterprises in Delft, Cape Town, 2010 and 2015 17
Figure 16: Year of Arrival in South Africa and Year of Business Start-Up   20
Figure 17: Average Household Income in Cape Town, 2001                     23
Figure 18: Distribution of Household Income, 2011                          24
Figure 19: Decline in Number of Commercial Farms                           26
Figure 20: Components of the Urban Food System                             28
Figure 21: Wheat Production by Province, 1994-2015                         30
Figure 22: Selected South African Vegetable Production, 1990-2015          30
Figure 23: Key Fruit Crop Production, 1990-2015                            31
Figure 24: Consumption of White and Red Meat, 1990-2014/5                  31
Figure 25: Consumption Expenditure on Key Foods                            32
Figure 26: Major South African Food Imports, 2008-2012                     34
Figure 27: Productive and Designated Agricultural Areas                    35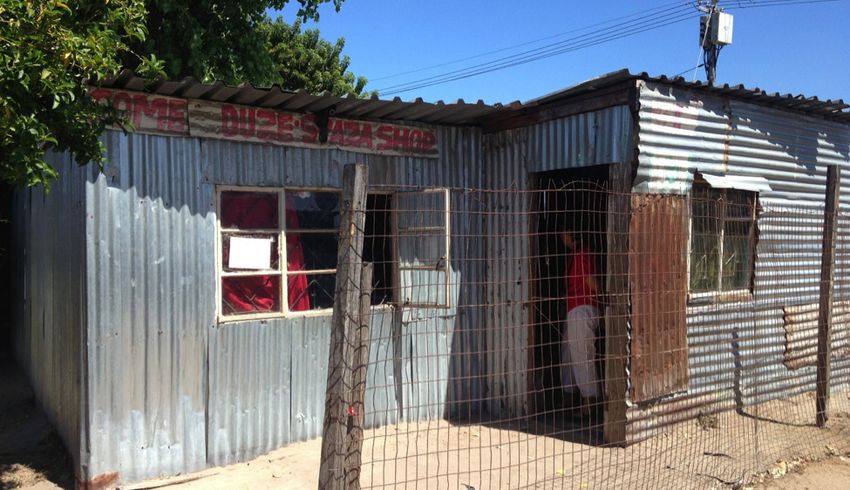
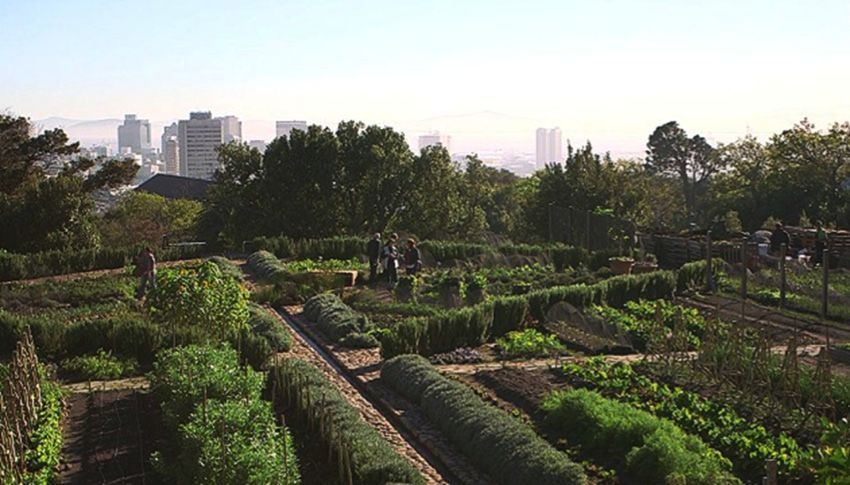
Figure 28: Philippi Horticultural Area, Cape Town                37
Figure 29: Location of Urban Agriculture Projects                40
Figure 30: Nyanga People’s Garden Centre, Cape Town              40
Figure 31: Oranjezicht City Farm                                 41
Figure 32: Sasko (Pioneer Foods) Bread Delivery                  42
Figure 33: Location of Food Processing Businesses                43
Figure 34: Flows of Food from the CTFPM                          44
Figure 35: Cape Town Fresh Produce Market                        45
Figure 36: The People’s Market at the CTFPM                      45
Figure 37: Supermarket Food Sales Turnover                       46
Figure 38: Shoprite Distribution Centre, Brackenfell             47
Figure 39: Growth of Supermarkets in Cape Town 1994-2013         47
Figure 40: Number of Supermarkets by Income Quintile             48
Figure 41: Spatial distribution of USaves in Cape Town           48
Figure 42: Location of Food Vendors in Ward 34                   50
Figure 43: Reasons for Choosing Trading Location                 50
Figure 44: Peak Business Hours for Informal Vendors              50
Figure 45: Spaza in Low-Income Area of Cape Town                 51
Figure 46: Spaza Owned by Migrants                               51
Figure 47: Sources of Produce Sold by Informal Food Vendors      52
Figure 48: Frequency of Food Purchased by Informal Vendors       52
Figure 49: Experience and Risk of Hunger in South Africa, 2013   53
Figure 50: Levels of Food Insecurity in Low-Income Areas         54
Figure 51: Levels of Food Insecurity among Migrant Households    55
Figure 52: Foods Eaten by Low-Income Households                  55
Figure 53: Months of Inadequate Food Provisioning                56
Figure 54: Household Income and Food Insecurity                  57
Figure 55: Income and Food Insecurity among Migrant Households   57
Figure 56: Food Sources of Low-Income Households                 59
HUNGRY CITIES REPORT NO. 3                                                       1

1. BACKGROUND
Cape Town is South Africa’s second largest city and plays a critical role in the
national economy. It is also the seat of Parliament and the capital city of the
Western Cape, one of South Africa’s nine provinces. The origins of the city date
back to the first use of the Cape as a provisioning station for ships of the Dutch
East India Company en route to South East Asia in the 17th century (Wor-
den et al 1998). In the years that followed, white settlers from the Netherlands
and France, having decimated the local population, developed an agricultural
slave-based economy that began to expand inland from the urban settlement in
Cape Town. Slaves were imported from various colonies in Asia, many of whom
are the forebears of today’s large mixed-race (or Coloured) population of Cape
Town. The British occupied the Cape in 1814 and hastened the development of
the modern city and agricultural hinterland of Cape Town by transforming its
local governance structures and economy.

Under British colonial occupation, by 1870 the number of urban centres in
the Cape Colony had increased from 14 to 103 (Mäki 2008). This expansion is
largely attributable to the growth of service and administrative centres. Further,
the Cape Municipal Ordinance of 1836 established municipal councils intro-
ducing local government structures of Boards of Commissioners as the formal
authority. Local government existed in the Cape from as early as 1786 with spe-
cific duties to fix the price of bread and meat as well as controlling public works
(Mäki 2008). In terms of the local economy, the British abolished slavery and
instituted a low-wage-based economy. South Africa’s minerals-based industrial
revolution in the late 19th century led to new roles and immigrant populations in
the city. Cape Town became one of South Africa’s major ports for mineral and
agricultural exports and imports of commodities including food. The total pop-
ulation for the City was only 8,400 in 1865 but increased rapidly to 181,240 in
1920. For much of the 20th century, population growth was steady, at between
2-4% per annum (Table 1).

The history of urbanization in Cape Town is highly racialized (Bickford-Smith
1995, 2003, Western 1997). Until 1945, the white population of the city was
the largest component (Figure 1). This changed when the apartheid government
came to power in 1948. The urbanization of the Coloured population, which
grew from 200,000 in 1945 to 1.2 million in 2000 in Cape Town, was partly a
result of increased movement from small towns and farming areas to the city.
The apartheid government imposed strict controls on the movement of black
Africans and sent large numbers of migrants to South Africa’s cities back to the
rural areas. This repressive and unworkable “influx control” system had broken
down by 1986 when the controls and associated pass laws were abolished (Saff
1998). The black African population of Cape Town began to grow rapidly from
2                                                          HUNGRY CITIES PARTNERSHIP

   the mid-1980s onwards. Between 1980 and 2000, the black African population
   of the city grew from less than 200,000 to 900,000, and to 1.4 million in 2011.
   In the post-apartheid period, the white population stabilized as new national
   immigration policies stopped large-scale migration from Europe and Cape Town
   began to experience a major “brain drain” with skilled and professional whites
   leaving the country (Höppli 2014).

   TABLE 1: Population Increase of the City of Cape Town, 1901-2014
     Year                                        Population            ±% p.a.
     1901                                           171,000             +9.82
     1950                                           618,000             +2.66
     1955                                           705,000             +2.67
     1960                                           803,000             +2.64
     1965                                           945,000             +3.31
     1970                                         1,114,000             +3.35
     1975                                         1,339,000             +3.75
     1980                                         1,609,000             +3.74
     1985                                         1,933,000             +3.74
     1990                                         2,296,000             +3.50
     1996                                         2,565,018             +1.86
     2001                                         2,892,243             +2.43
     2007                                         3,497,097             +3.22
     2011                                         3,740,000             +1.69
     2014                                         3,750,000             +0.09
     Sources: Worden et al (1998), Statistics South Africa

   FIGURE 1: Population Increase by Race in Cape Town, 1910-2011
       1,800,000
       1,600,000

       1,400,000
       1,200,000

       1,000,000

        800,000
        600,000

        400,000
        200,000
               0

THE URBAN FOOD SYSTEM OF CAPE TOWN, SOUTH AFRICA
HUNGRY CITIES REPORT NO. 3 3
The other distinctive aspect of Cape Town’s history is the racialization of urban
space through racial segregation policies (Western 1997). In the period before
1948, segregationist policies led to a distinctive spatial organization in which
wealthy whites, who controlled the city’s economy and politics, lived in salubri-
ous surroundings close to Table Mountain. The working-class Coloured popu-
lation lived in low-income areas, known as the Cape Flats, which were further
from the CBD, but there were also middle-class suburbs in which both whites
and people of mixed-race lived. This racial mixing was outlawed by the apartheid
government which expropriated and demolished many Coloured-owned houses
and forcibly relocated their inhabitants to the Cape Flats (Western 1997). Some
predominantly mixed-race housing areas were completely destroyed, including
District Six, close to the city centre. The city’s growing black African population
was channeled to low-cost housing areas on the periphery of the city. However,
housing construction did not keep pace with urbanization and the city landscape
became increasingly congested with rapidly-growing informal settlements.
2. DEMOGRAPHY OF CAPE TOWN
2.1 Population Composition
The 2011 South African Census recorded a population of 3,740,026 in the City
of Cape Town, with 42% Coloured or mixed-race, 39% black African, and 16%
white (Table 2). The number of women slightly exceeded the number of men,
significantly so in the case of the Coloured and white populations. Dorrington
(2000) projected that the city’s rapid post-apartheid population growth would
continue, reaching 4.3 million in 2016, and 5 million in 2031 (Table 3). Accord-
ing to this analysis, the black African population will be the largest component
of the city’s population by 2031.
TABLE 2: Racial and Gender Profile of Cape Town, 2011
Male Female Total
No. % No. % No. %
Black African 722,755 19.3 722,184 19.3 1,444,939 38.6
Coloured 759,559 20.3 825,727 22.1 1,585,286 42.4
Asian 26,155 0.7 25,631 0.7 51,786 1.4
White 280,133 7.5 305,698 8.2 585,831 15.7
Other 42,097 1.1 30,087 0.8 72,184 1.9
Total 1,830,699 48.9 1,909,327 51.1 3,740,026 100.0
Source: Statistics South Africa4 HUNGRY CITIES PARTNERSHIP
TABLE 3: Population Projections for Cape Town to 2031
2016 2021 2026 2031
No. % No. % No. % No. %
Asian 75,546 1.9 82,334 1.9 88,383 2.1 93,541 2.2
Black African 1,496,267 37.4 1,581,397 38.4 1,653,399 39.3 1,703,802 40.0
Coloured 1,697,148 42.5 1,711,661 41.6 1,712,078 40.7 1,698,536 39.9
White 728,756 18.2 744,113 18.1 754,584 17.9 759,977 17.9
Source: Dorrington (2000)
The number of households in Cape Town grew from 653,000 in 1996 to
1,069,000 in 2011, an increase of over 60% (CoCT 2017: 17). The greatest
increase was in the number and proportion of black African households, again
a function of large-scale migration to the city (Table 4). While the number of
Coloured and white households also increased, their proportional share fell by
6-7% each. While the number of households has increased, average household
size has been declining across all racial groups (Figure 2). White households are
on average the smallest and Coloured households the largest, despite an overall
decline in the average size of both since 1996. In total, 38% of households in
Cape Town are female-headed.
TABLE 4: Number of Households in Cape Town, 1996-2011
1996 2001 2011
No. % No. % No. %
Black African 168,000 25.7 251,125 32.3 444,781 41.6
Coloured 259,982 39.8 310,465 39.9 358,629 33.6
White 195,011 29.9 205,734 26.5 232,826 21.8
Other 30,092 4.6 10,065 1.3 32,336 3.0
Total 653,085 100.0 777,389 100.0 1,068,572 100.0
Source: CoCT (2016: 17)
Rapid in-migration of adults from other parts of the country has produced a
distinctive age structure in which working-age men and women between 20
and 40 years of age predominate (Figure 3). The population pyramid of the city
shows a distinctive pattern in which the largest proportion of the population is
not young children (as is the case nationally) but adults in the 25-29 age band.
Also of note is the relatively low proportion of people in their teens. This may
reflect the preference of adults to school their children in other locations.
THE URBAN FOOD SYSTEM OF CAPE TOWN, SOUTH AFRICAHUNGRY CITIES REPORT NO. 3 5 FIGURE 2: Decline in Average Household Size, 1996-2011 Source: CoCT (2016: 18) FIGURE 3: Population Pyramid of Cape Town, 2011 Source: http://www.statssa.gov.za/?page_id=1021&id=city-of-cape-town-municipality
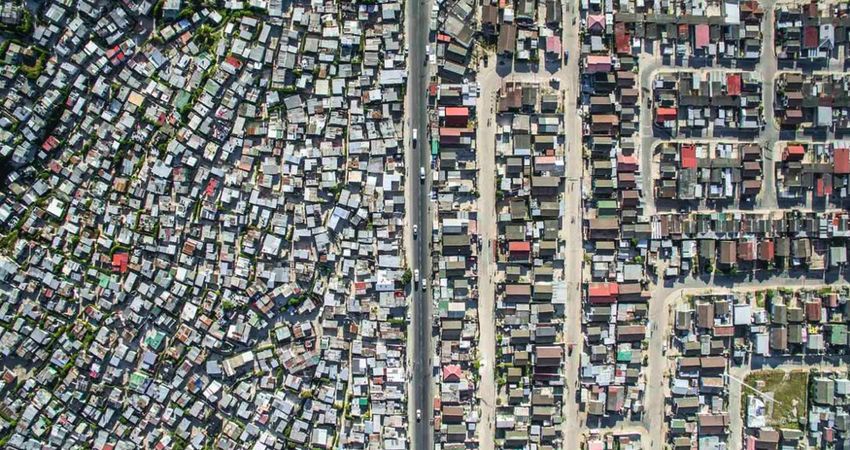
6                                                      HUNGRY CITIES PARTNERSHIP

   As well as being a major destination for internal migrants (primarily from the
   Eastern Cape), post-apartheid Cape Town has become a destination for inter-
   national migrants and refugees from neighbouring SADC (Southern African
   Development Community) countries (74,685 in 2011), other African countries
   (25,392 in 2011) and elsewhere in the world (23,854 in 2011). The actual num-
   bers may be higher since as many as 205,546 people did not specify their region
   of birth in the 2011 Census.

   2.2 Population Distribution and Density
   Cape Town is a city of major contrasts and extremes. The wealthiest suburbs are
   around Table Mountain and are inhabited primarily by whites, a legacy of the
   city’s apartheid past. This is the popular touristic image of Cape Town (Figure
   4). However, the majority of the city’s people live in formal and informal hous-
   ing further away from the mountain in an area known as the Cape Flats. One of
   the largest of these areas is Khayelitsha, which was established in the 1980s as a
   planned residential area for black Africans, 30km from the city centre. Khayelit-
   sha now houses over 1 million people, many in dire poverty, in a mix of basic
   formal housing and informal structures (Figure 5). In some areas of the city,
   large informal settlements have grown in what were whites-only areas under
   apartheid. This has produced stark juxtapositions of wealth and poverty, such as
   the case of Imizamo Yethu in Hout Bay (Figure 6).

   FIGURE 4: Cape Town Central Business District with Suburbs of Green Point
   and Sea Point

   The spatial distribution of the city’s population is still predominantly determined
   by race. More than 20 years after South Africa’s first democratic election, and
   the abolition of state-mandated racial segregation, racially-determined suburbs
   remain the dominant feature of urban settlement in Cape Town. As Figure 7 and
   Table 5 clearly show, most areas are either predominantly white, Coloured or
   black African.

THE URBAN FOOD SYSTEM OF CAPE TOWN, SOUTH AFRICA
HUNGRY CITIES REPORT NO. 3                                                   7

The parts of the city where over 90% of the residents are black African include
areas designated for Africans by the apartheid system (such as Langa, Gugule-
thu and Khayelitsha) and informal settlements (including Crossroads, Imizamo
Yethu and Philippi). In addition to Imizamo Yethu in Hout Bay, the wealthy
area of Noordhoek has a large informal settlement (Masiphumelele). Both
Imizamo Yethu and Masiphumelele are post-apartheid informal settlements
mainly occupied by recent migrants to the city. Suburbs with a predominantly
Coloured population are generally low-income and working class areas on the
Cape Flats including Mitchell’s Plain (91%), Athlone (87%), Grassy Park (87%)
and Manenberg (85%). The only suburb with a roughly equal number of black
African and Coloured residents is the low-income area of Delft. The residents
of the wealthiest suburbs, most of which are close to Table Mountain, are pre-
dominantly white.

FIGURE 5: Mix of Formal and Informal Housing, Khayelitsha

Source: Johnny Miller

FIGURE 6: Imizamo Yethu in Hout Bay

Source: Johnny Miller
8                                                                  HUNGRY CITIES PARTNERSHIP

   FIGURE 7: Dominant Population Group in Suburbs of Cape Town

   Source: https://welections.wordpress.com/guide-to-the-2014-south-african-election/race-ethnicity-
   and-language-in-south-africa/

   TABLE 5: Racial Composition of Cape Town Suburbs
     Suburb               Black African          Coloured                 White          Other
                                      Majority Black African Population
     Langa                     99.1                   0.4                   0.1            0.5
     Nyanga                    98.8                   0.3                   0.2            0.8
     Khayelitsha               98.6                   0.6                   0.1            0.7
     Gugulethu                 98.6                   0.9                   0.0            0.5
     Crossroads                96.7                   2.9                   0.1            0.3
     Mfuleni                   95.9                   3.0                   0.2            0.9
     Philippi                  94.1                   4.7                   0.1            1.1
     Nomzamo                   93.3                   4.0                   0.3            2.4
     Imizamo Yethu             91.6                   3.7                   0.1            4.6

THE URBAN FOOD SYSTEM OF CAPE TOWN, SOUTH AFRICA
HUNGRY CITIES REPORT NO. 3 9
Durbanville 85.4 14.6 0.0 0.0
Noordhoek 67.3 2.3 24.6 5.8
Klipheuwel 54.1 38.6 6.8 0.5
Fistantekraal 51.5 46.9 0.5 1.1
Castle Rock 49.5 46.3 2.8 1.4
Kraaifontein 43.3 40.2 14.4 2.1
Majority Coloured Population
Pella 1.7 97.3 0.1 0.9
Mamre 3.0 94.6 0.3 2.1
Elsies Rivier 6.8 91.4 0.3 1.5
Matroosfontein 7.0 90.9 0.1 2.0
Mitchell’s Plain 7.3 90.8 0.2 1.7
Belhar 4.9 90.2 0.3 4.7
Macassar 8.9 88.3 1.2 1.6
Grassy Park 6.2 87.4 0.6 5.8
Athlone 5.9 87.0 0.3 6.8
Atlantis 12.9 85.0 0.1 2.0
Manenberg 10.4 84.5 0.1 5.0
Eerste Rivier 16.0 81.7 0.2 2.0
Blue Downs 22.9 74.9 0.3 1.8
Kommetjie 6.1 74.5 17.8 1.6
Epping Industria 30.0 66.0 0.0 4.0
Blackheath 33.4 63.2 0.9 2.4
Parow 9.6 58.4 25.5 6.5
Kuilsriver 11.4 53.1 32.6 2.8
Delft 46.2 51.5 0.1 2.1
Cape Metro 24.2 46.8 26.9 2.2
Cape Farms 14.3 44.1 36.5 5.2
Goodwood 17.9 37.9 37.9 6.2
Philadelphia 7.2 59.1 33.7 0.0
Strand 11.6 51.1 34.2 3.1
Majority White Population
Fish Hoek 9.7 5.1 82.2 3.1
Durbanville 5.5 10.1 82.2 2.2
Melkbosstrand 7.8 10.0 80.5 1.6
Camps Bay 12.2 4.4 80.2 3.1
Brackenfell 9.8 9.0 79.0 2.2
Newlands 8.9 5.9 77.0 8.2
Constantia 11.5 9.2 75.3 4.0
Scarborough 16.2 9.8 69.6 4.5
Gordons Bay 10.9 19.8 65.6 3.7
Claremont 16.8 11.1 64.1 8.0
Green Point 21.5 9.7 62.4 6.5
Somerset West 13.0 24.5 60.1 2.510 HUNGRY CITIES PARTNERSHIP
Hout Bay 6.8 32.3 57.4 3.6
Simon’s Town 31.4 8.9 56.0 3.6
Bellville 15.7 29.4 50.3 4.6
Muizenberg 23.2 18.4 49.9 8.5
Milnerton 29.9 17.3 47.7 5.0
Blouberg 44.4 6.5 44.7 4.5
Source: Compiled from 2011 Census data at http://www.statssa.gov.za/?page_id=1021&id=city-of-
cape-town-municipality
The legacy of urban racial segregation can also be seen in the highly variable
population density across the city. In general, high and low-density areas are
in different parts of the city. Densities are very low in the middle and upper
(predominantly white) suburbs close to the mountain and around the Cape pen-
insula (Figure 8). By contrast, densities are extremely high in the city’s informal
settlements. In between are the Cape Flats suburbs with relatively high-density
formal housing. In the last three decades, the city has undergone a process of
inverse densification with the periphery densifying much faster than the urban
core (Turok 2011).
FIGURE 8: Population Density in Cape Town, 2011
Source: SACN (2011)
THE URBAN FOOD SYSTEM OF CAPE TOWN, SOUTH AFRICAHUNGRY CITIES REPORT NO. 3 11
3. FORMAL ECONOMY OF CAPE TOWN
3.1 Major Economic Activities
Cape Town is an important contributor to the national and provincial (Western
Cape) economies, making up around 10% of national GDP in 2014 (CoCT
2016: 45). Its real GDP per capita and GDP per capita growth rate closely mirror
that of the national economy, although GDP per capita is consistently higher
in Cape Town (Figure 9). Cape Town’s economy is primarily service-driven,
with the tertiary sector contributing almost 80% of the city’s economic output
(CoCT 2016: 46). Between 2005 and 2014, the finance and insurance industry
contributed over 30% of economic growth. Retail and wholesale trade, con-
struction and business services also made significant contributions (Figure 10).
FIGURE 9: Comparison of National and Cape Town GDP Indices
90,000
80,000
70,000
60,000
50,000
40,000
30,000
20,000
10,000
0
Source: CoCT (2016: 45)12 HUNGRY CITIES PARTNERSHIP FIGURE 10: Sectoral Contributions to Economic Growth, 2005-2014 Source: CoCT (2016: 46) 3.2 Employment and Unemployment The growth of the city’s economy is reflected in the rising number of jobs, which increased from 1.34 million in 2008 to over 1.5 million in 2014 (with a marked dip between 2008 and 2010 during the global financial crisis) (Figure 11). The importance of the tertiary sector (which includes services, finance, private house- holds, transport and trade) as a source of employment is evident from Figure 12, which shows that over 1 million jobs are in tertiary industry. Secondary industry provides around 200,000 jobs with clothing and textiles and agro-processing as major employers. Primary industry (agriculture and mining) is much less signifi- cant, employing less than 10,000 people. As the sectoral breakdown suggests, Cape Town’s labour market favours those with skills. Many new migrants to the city are semi-skilled or unskilled and are therefore mostly absorbed into the informal sector. However, the city still has a very high unemployment rate. Between 2008 and 2015, unemployment increased from 19.2% to 22.1%, although there was a sharp decline during the course of 2015 (CoCT 2016: 48). While Cape Town’s unemployment rate is well below the national average (Figure 13), unemployment for youth in the city is as high as 47%. THE URBAN FOOD SYSTEM OF CAPE TOWN, SOUTH AFRICA
HUNGRY CITIES REPORT NO. 3                              13

FIGURE 11: Employment in Cape Town, 2008 to 2015
  1,550,000

  1,500,000

  1,450,000

  1,400,000

  1,350,000

  1,300,000

  1,250,000

 1,200,000

 1,150,000

Source: CoCT (2016: 49)

FIGURE 12: Employment by Sector in Cape Town, 2013-15
 350,000

 300,000

 250,000

 200,000

 150,000

 100,000

  50,000

        0

Source: CoCT (2016: 52)
14 HUNGRY CITIES PARTNERSHIP
FIGURE 13: South African and Cape Town Unemployment Rates, 2008-2015
Source: CoCT (2016: 49)
4. THE INFORMAL ECONOMY
4.1 Size and Significance
Various commentators have said that the informal economy in South Africa is
small in comparison with that of other African countries and given the coun-
try’s high rates of formal sector unemployment. According to the City of Cape
Town (CoCT 2015: 45), “the informal sector incorporates a broad spectrum
of economic activities and business typologies in a diverse range of geographic
locations across the city, with varying intensities of relations with formal busi-
ness.” An estimated 122,000 people (or 9% of the total workforce) were infor-
mally employed at the time of Census 2011, an increase from 47,000 in 2001
(CoCT 2016: 53). Current estimates suggest that the sector has grown rapidly
in the last five years and may now provide employment or self-employment for
between 160,000 and 186,000 people. The Cape Town Partnership claims that
the local informal economy constitutes 12% of the city’s total economy and that
it employs 18% of economically active residents. According to the City (CoCT
2016: 53):
The informal sector’s socio-economic impact in Cape Town is even larger than
its contribution to employment would imply, as the income received from informal
work accrues disproportionately to those who live close to the poverty line… The
THE URBAN FOOD SYSTEM OF CAPE TOWN, SOUTH AFRICAHUNGRY CITIES REPORT NO. 3 15
relatively low wages of informal-sector workers, who tend to live in poor households
with larger- than-average household size, result in a substantial decrease in the city’s
poverty rate.
The City calculates that there is a 4.5% decline in the poverty rate once informal
sector income is factored in or the equivalent of pulling 186,000 people out of
poverty. While individual incomes can be low, the informal economy supports
large numbers of dependants in poor households.
A City of Cape Town 2015 study of the informal sector found that 60% of the
participants were male and 40% were female (Table 6). Nearly half were black
African, with 36% Coloured and only 15% white. As many as 41% were youth
(under the age of 35, according to the ILO definition). Participation by people
over the age of 50 was much lower (at 18%). The participants were relatively well
educated with 38% having completed high school and 10% with some tertiary
education. Contrary to expectations, only 12% of informal-sector workers were
employed or self-employed in informal settlements. By far the greatest number
were in formal areas of the city. The informal sector is also “incredibly fluid”
with individuals moving backwards and forwards between it and formal employ-
ment. Many participants use their savings from a formal job as start-up capital for
an informal business.
Figure 14 maps the major areas of the city in which informal businesses operate
and shows that there is considerable variation in the degree to which they are
operating with City business permits. In the CBD for example, all operators
have permits, while the proportion in Strand with permits is only 56%. The
map also suggests that the mix of informal sector activities varies considerably by
location, although trade in food and apparel is found to a greater or lesser degree
in every location.
TABLE 6: Characteristics of Participants in the Informal Sector
% of Informal Sector Workers
Gender
Male 59.8
Female 40.2
Race
Black African 48.5
Coloured 36.0
White 14.9
Other 0.5
Age
15-29 26.5
30-34 14.516 HUNGRY CITIES PARTNERSHIP
35-49 41.1
50-64 17.9
Education
None 3.0
Primary (some/completed) 13.6
Secondary (some/completed) 80.4
Tertiary 10.4
Location
Urban formal 88.2
Urban informal 11.8
Source: CoCT (2015: 48)
FIGURE 14: Characteristics of Informal Sector by Location
Source: CoCT (2015: 49)
CoCT (2015) divides informal traders into two main types: (a) general traders
who rely on high-volume, low-margin sales and (b) specialized traders who sell
higher-margin goods to smaller numbers of customers. The former are “more
responsive to pedestrian flows, as customer convenience is their main competi-
tive advantage” (CoCT 2015: 49). They are primarily retailers who sell “cheap
and popular items” such as fruit, vegetables and snacks. While retailing/trading
is the major informal sector activity, the informal economy is much more diverse
than simply the buying and reselling of goods:
THE URBAN FOOD SYSTEM OF CAPE TOWN, SOUTH AFRICAHUNGRY CITIES REPORT NO. 3 17
Structurally, the components of this informal economy include a notable informal
retail economy which is manifest as street trading in the inner city and spaza retail-
ing in township areas. The Cape Town market street trading economy includes a
distinctive element of traders who are engaged with the city’s burgeoning formal tour-
ism economy through the vending of arts and crafts. Beyond retail, however, there is
evidence of an informal economy of services (which includes among others, hairdress-
ing and shebeens); of manufacturing (especially informal clothing), construction,
recycling and repairs (garage mechanics in townships, cell phone repairs); and, a
highly distinctive economy in which an estimated 15,000 practitioners collectively
are involved gathering wild-harvest resources to support the traditional medicine
economy (Rogerson 2015).
Additional detail on informal activity in particular localities comes from other
recent surveys. First, a recent study of the informal sector in the low-income
suburb of Delft in Cape Town shows the relative importance of different types of
informal sector activity (Charman et al 2016). The number of micro-enterprises
more than doubled from 879 in 2010 to 1,798 in 2015 (Figure 15). While almost
all types of activity saw some growth, the increase was particularly marked for
take-away (cooked) food, street trading, meat, poultry and fish selling, and wood
and coal sales. There was an overall decline in the number of spaza shops, which
may be related to recent attacks and looting of these types of outlet (Charman
and Piper 2012).
FIGURE 15: Informal Micro-Enterprises in Delft, Cape Town, 2010 and 2015
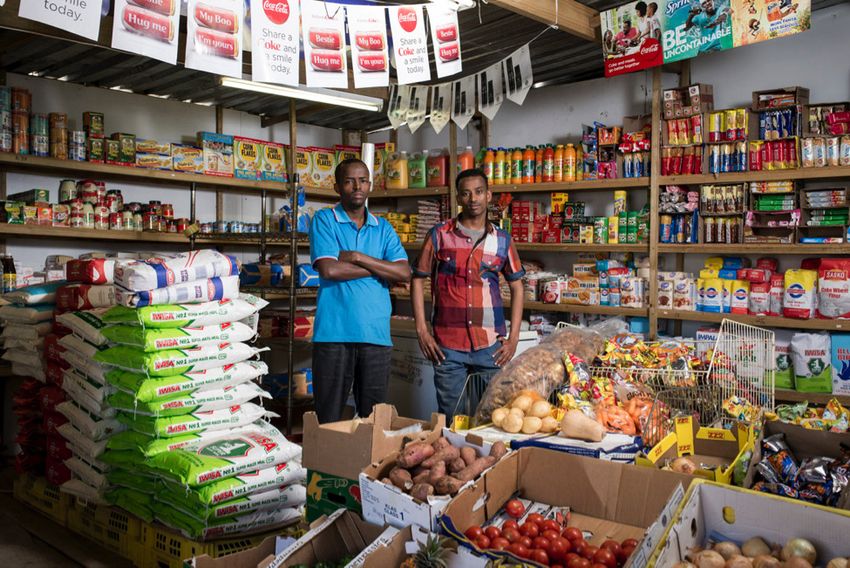
Source: Charman et al (2016: 4)18 HUNGRY CITIES PARTNERSHIP A study of small businesses in Khayelitsha found that there were 85,000 SMMEs of which 32,000 were informal micro-enterprises and 45,000 were classified as “survivalists” (USB 2014: 2). The study classified enterprises into (a) medium- sized enterprises (20-50 staff) such as taxi operators or large childcare centres; (b) small enterprises (6-20 staff) such as corner shops, repair workshops and restau- rants; (c) micro-enterprises (5 or fewer staff) such as spaza, shebeens, hairdressers and taxis; and (d) survivalist operations such as street vending, cleaning and waste removal. There have been various studies of the involvement of migrants and refugees in the informal economy of Cape Town (Gastrow and Amit 2013, Kalitanyi and Visser 2010, Khosa and Kalitanyi 2014, Slabbert and Tengeh 2013, Tawodzera et al 2015, Tengeh 2013a, 2013b, Tengeh et al 2011). African migrant entrepre- neurs in Cape Town are engaged in a wide range of entrepreneurial activities. Tengeh et al (2011: 16) found that the array of informal sector activities included cell phone repairs, shoe repairs, crafts, restaurants, panelbeaters, ethnic clothing, manufacturing and even operating night clubs. Most – almost two-thirds – were involved in various forms of trading. Certain activities were dominated by par- ticular groups of foreign nationals including Somalis in clothing, Senegalese in footwear, Congolese in hairdressing, and Malawians and Ugandans in arts and crafts (Kalitanyi and Visser 2010). A 2015 SAMP study of 518 migrant-owned businesses in Cape Town confirmed that the migrants came from a wide variety of countries (Table 7) (Tawodzera et al 2015). There is a common public percep- tion, reinforced by official statements, that most migrants are in South Africa illegally. However, the SAMP study found that over 60% were either recognized refugees or asylum-seekers and only 7% had no official documentation (Table 8). The survey concentrated on micro-enterprises in three major sectors: (a) retail, trade and wholesale; (b) manufacturing; and (c) services. Sixty-two percent of the migrant entrepreneurs were engaged in retail, trade and wholesale activities, 28% in services and 10% in manufacturing. The entrepreneurs conducted their business activities from a variety of temporary and permanent locations (Table 9). Some operate in more than one location. The most significant location was a temporary stall on the street (38% of the total sample). Next was a permanent stall on the street (at 21%). Other fixed premises included workshops or shops (16%), their own home (11%), a permanent stall in a market (11%) and a shop in a house, yard or garage (3%). Other temporary sites of significance included taxi ranks (11%) and in the customer’s home (3%). A total of 9% were mobile, predominantly selling goods door-to-door. THE URBAN FOOD SYSTEM OF CAPE TOWN, SOUTH AFRICA
HUNGRY CITIES REPORT NO. 3                                              19

TABLE 7: Country of Origin of Informal Migrant Entrepreneurs
                                              No.                 %
SADC
Zimbabwe                                      118                22.8
Malawi                                         39                 7.5
Tanzania                                        9                 1.7
Lesotho                                         5                 1.0
Zambia                                          5                 1.0
Angola                                          4                 0.8
Mozambique                                      4                 0.8
Other African
Somalia                                        70                13.5
Democratic Republic of the Congo               58                11.2
Nigeria                                        48                 9.3
Ethiopia                                       37                 7.2
Cameroon                                       22                 4.3
Ghana                                          17                 3.3
Congo (Brazzaville)                            14                 2.7
Uganda                                         12                 2.3
Kenya                                          11                 2.1
Rwanda                                          5                 1.0
Other
Pakistan                                        8                 1.5
Bangladesh                                      4                 0.8
Other country                                  27                 5.2
Total                                         517               100.0

TABLE 8: Immigration Status of Informal Migrant Entrepreneurs
                                              No.                 %
Refugee permit holder                         162                31.5
Asylum-seeker permit holder                   158                30.7
Permanent resident of South Africa             61                11.9
Work permit holder                             40                 7.8
No official documentation                      38                 7.4
Visitor’s permit holder                        30                 5.8
Other immigration status                       12                 2.3
Unknown                                        12                 2.4
Citizen of South Africa                         1                 0.2
Total                                         514               100.0
20 HUNGRY CITIES PARTNERSHIP
TABLE 9: Business Locations of Informal Migrant Enterprises
No. % of total
Permanent
Permanent stall on the street 109 21.0
Workshop or shop 85 16.4
Permanent stall in a market 55 10.6
In own home 55 10.6
Shop in house/yard/garage 18 3.5
Taxi/public transport station in permanent structure 10 1.9
Restaurant or hotel 2 0.4
Temporary
Temporary stall on the street 198 38.2
Taxi rank 57 11.0
Mobile (e.g. door-to-door) 46 8.9
In customer’s home (e.g. hairstyling) 17 3.3
From vehicle (car, truck, motor bike, bike) 6 1.2
Other
Other location 34 6.6
Note: multiple response question
Only a few of the businesses (less than 5%) were established before 2000. The
majority (over 50%) started between 2010 and 2014 (Figure 16). Comparing the
year in which the migrants came to South Africa with the year they established
their business, shows that there is a clear time lag between the two as they raise
sufficient capital from other activities (formal employment as well as working for
an informal business owner) to set up their own business.
FIGURE 16: Year of Arrival in South Africa and Year of Business Start-Up
THE URBAN FOOD SYSTEM OF CAPE TOWN, SOUTH AFRICAHUNGRY CITIES REPORT NO. 3 21 4.2 Policies Towards Informality Cape Town’s 2013 Informal Trading Policy emphasizes the importance of the informal economy to the city: The City acknowledges the legitimacy and role of the informal economy in terms of its employment and economic growth prospects. Urbanising cities and towns glob- ally are experiencing growth in the number of entrants to the informal sector. The informal economy also has low barriers to entry and serves as a social safety net: it also often sustains the livelihoods of foreign nationals who seek refuge from war torn countries. The informal economy is thus important socially and economically. The response to the sector will determine how well it thrives (CoCT 2013: 10). Officials from the Department of Economic Development have noted that new policy adopts “a more developmental approach” (Rogerson 2015). Skinner (2013) draws attention to the more restrictive dimensions of the official response and regulation of the street trading economy of Cape Town. First, the City of Cape Town has committed much less funding for infrastructure in sup- port of informal retailing. Second, Cape Town has declared a significantly larger area of defended space, in the form of restricted or prohibited trade areas, than any other leading city in South Africa. Third, compared to other South African cities, Cape Town has fewer public space traders generally and a reduced number of inner-city traders. Waiting lists for permits can be up to two-and-a-half years in certain parts of the city (Chapman, 2014). Donaldson et al (2014: 292) argue that the policy “limits who can trade; traders that do not get a permit find this unfair. Traders that have one find that the process to add or change the type of goods they sell is too onerous.” Crush et al (2015: 44) conclude that while the policy environment varies across different parts of the city, as well as between dif- ferent elements of informal economic activities, for Cape Town as a whole “the modernizing vision of the ‘world-class city’ with its associated antipathy towards informality and the pathologizing of informal space and activity seems to pre- dominate.” There is evidence of a subtle but systematic exclusion of street traders through “ongoing harassment of traders throughout the city” and the allocation of only 410 street trading bays across the entire inner city (Crush et al, 2015: 44). A completely different set of regulatory challenges confront migrant entrepre- neurs undertaking operations in Cape Town township areas as opposed to the inner city. Gastrow and Amit (2013) record that low regulatory barriers to entry facilitated the growth of Somali trading in Cape Town townships. Indeed, low regulatory requirements as well as lack of enforcement of applicable legislation “have benefited spaza traders who might otherwise struggle to meet the complex, legal, technical and bureaucratic requirements in more regulated areas” (Gastrow and Amit, 2013: 18). In low-income areas, spazas and “house shops” are not reg- ulated under the informal trading policy but instead by the zoning schemes that
22                                                            HUNGRY CITIES PARTNERSHIP

   apply to residential areas (Rogerson 2015). The city’s zoning scheme differenti-
   ates between two types of single residential zoning. In higher-income residential
   areas – SR1 – the zoning regime does not allow for spazas or house shops. But in
   lower-income areas, such as townships, SR2 zoning makes provision for spazas
   (Rogerson 2015). The intention is that owners use house shops for supplemen-
   tary income only and do not lease out their shops for rent. Shops that expand and
   exceed these conditions are expected to formalize and relocate to areas that are
   zoned for business purposes (Rogerson 2015).

   Although spaza traders are legally required to possess business licences, Cape
   Town authorities have been generally reluctant to enforce licensing in townships
   mainly because of lack of capacity. Many, if not most, township spazas, whether
   run by locals or migrants, therefore operate in contravention of this requirement
   for a business licence, which applies to sellers of perishable items such as milk,
   bread or meat (Gastrow and Amit, 2013). The absence of clarity in regulations
   about spaza operations and zoning was articulated as follows by the Chairperson
   of the Somali Association of South Africa:
        What spaza shops normally face is that there are areas which are zoned and areas
        which are not zoned. In all those areas which are zoned, there’s always challenges
        that the spaza owners face because they don’t understand how the regulation works:
        what they’re supposed to do and not supposed to do when they open a shop for the
        first time. What happens is that somebody opens a shop somewhere and receives a
        warning letter from the municipality saying ‘no, you have to close down’. And he
        doesn’t understand why. And the person who gives the letter doesn’t explain a lot of
        things. The municipalities don’t usually run workshops or things like that for spaza
        shops to teach them about what regulations or by laws mean. You think it is a free
        zone where you can just trade and do what you want. People are fined and told ‘you
        are doing illegal business. You don’t have a license.’ So, there’s a lot of confusion
        when it comes to the by laws or regulations that apply to places that are not zoned
        specifically. And the municipality or the local government is not actually very clear
        with their law (Quoted in Rogerson 2015).

   In spite of the existence of regulations and the important role of the informal
   economy in Cape Town, informal enterprises continue to face a number of dif-
   ficulties (Rogerson 2015). Traders are unsure of their rights and their economic
   role, especially when their goods are confiscated by the police with devastating
   impacts on their livelihoods.

THE URBAN FOOD SYSTEM OF CAPE TOWN, SOUTH AFRICA
HUNGRY CITIES REPORT NO. 3 23
5. POVERTY AND INCOME
5.1 Household and Personal Income
Average annual household income in Cape Town in 2011 was ZAR57,300 per
year. However, there were wide variations in levels of income across the city with
high-income areas located around the mountain and Cape Peninsula and lower-
income areas located on the periphery of the city (Figure 17). In 2011, 147,000
households (14%) had an income of zero and 332,000 (31%) had an income of
less than ZAR20,000 per year. At the other end of the spectrum, 141,000 house-
holds had an income of more than ZAR300,000 per year.
FIGURE 17: Average Household Income in Cape Town, 2001
Percentage in Informal
Standalone Housing
R0–R39,537.17
R39,537.17–R77,992.85
R77,992.85–R124,689.06
R124,689.058–R200,492.71
R200,492.71–R1,091,651.80
Source: Peyton, 201224 HUNGRY CITIES PARTNERSHIP FIGURE 18: Distribution of Household Income, 2011 Source: https://wazimap.co.za Statistics South Africa reports that between 2001 and 2011 there was a decrease in the number of low-income households in Cape Town: 56% of households had a monthly income of ZAR3,200 or less in 2001 but, by 2011 that figure had dropped to 47%. During the same period, only one percent of households moved into the category of households with no income: from 13% to 14%. There was also very little movement at the other end of the income spectrum as the percentage of households with a monthly income of ZAR25,600 or more increased from 10% to 14%. Black African and Coloured households expe- rienced this increase in income. In 2001, 87% of Black Africans and 54% of Coloured households had an income of ZAR3,200 or less and by 2011 that fig- ure had dropped to 69% for Black African and 41% for Coloured households. Cape Town is becoming a more unequal society as the gap between the rich and the poor increases. The Gini coefficient for Cape Town improved from 0.60 in 2001 to 0.57 in 2010. However, in 2011/2012 it increased to 0.67. 5.2 Housing Type Census 2011 found that 56% of dwellings in Cape Town were formal houses and 21% were informal shacks (Table 10). Most shacks are located in informal settlements scattered around the city (Figure 17). Forty-two percent of the Black African population of the city lived in informal housing in 2011 and around 10,000 new shacks are constructed annually. Up-to-date information on the location of settlements in relation to household income is not yet available. How- ever, plotting their location on a base map of income levels across the city in 2001 suggests that there is a strong correlation between the two (Figure 17). THE URBAN FOOD SYSTEM OF CAPE TOWN, SOUTH AFRICA
HUNGRY CITIES REPORT NO. 3                                                                       25

TABLE 10: Households by Type of Dwelling, 2011
                                                                  No.               %
House                                                           601,956             56.3
Shack                                                           218,781             20.5
Apartment/flat                                                  106,161                 9.9
Semi-detached house                                              74,484                 7.0
Others                                                           67,194                 6.3

Housing type is clearly differentiated by race with 43% of black African house-
holds in informal dwellings in 2011, compared with only 7% of Coloured house-
holds and 0.3% of white households (Table 11). The proportion of black African
households in informal dwellings did, however, decline between 2001 and 2011.

TABLE 11: Housing Type by Race, 2001 and 2011
                                       Black       Coloured        Indian           White
                                    2001   2011   2001   2011   2001      2011   2001         2011
Informal/backyard dwellings          8.6   12.3    3.7    5.0    0.5       1.1    0.2          0.1
Informal dwelling not in backyard   43.0   30.3    1.8    2.1    0.4       1.0    0.2          0.2
Formal dwellings                    45.2   56.4   92.1   91.3   97.4      97.1   98.5         99.0

6. THE URBAN FOOD SYSTEM
The Cape Town food system is embedded within the wider food system of
South Africa. The country’s food system is a product of its apartheid past, which
was designed specifically to benefit a particular racial group. White South Afri-
cans were recipients of direct development support that has resulted in market
dominance by a small core group. Instead of a post-apartheid transformation
of the food system, its inequalities were compounded by legal and governance
processes that followed the country’s first democratic election in 1994.

Three notable developments impacted directly on the nature and shape of the
food system that emerged after apartheid’s collapse. First was the signing of the
Uruguay Round of Global Agreement of Trade and Tariffs (GATT), which led
to the formation of the World Trade Organization (WTO) in 1994. This process
obligated countries to trade agreements with implications for the multiple food
systems of production and distribution. Second was the dismantling of the legal
and regulatory systems governing agricultural and food products in South Africa,
and their replacement with a combination of free market systems and forms of
industry self-regulation (as opposed to policy and regulatory systems).
26 HUNGRY CITIES PARTNERSHIP
These processes culminated in legislation enabling the dismantling of state-led
systems: the Marketing of Agricultural Products Act (MAPA) of 1996. This was
supported by the third process, enacted before the previous ones but of criti-
cal importance. This was the amendments to the Co-operatives Act (in 1993).
These amendments allowed the removal of co-operative infrastructure from
farmer control, and the subsequent privatization of these assets. Combined,
these three processes opened the door to the expansion of corporate power in
the South African food system (Greenberg 2016). These shifts are important as
they lay the foundation for the type and structure of the South African (and Cape
Town) food system and its functioning.
These changes, followed by the 2001 Strategic Plan for Agriculture, paved the
way for liberalized and competitive agricultural markets aimed primarily at
greater foreign trade in agricultural products (DoA 2001). After deregulation,
field crop prices adjusted downwards to world market levels. Commercial farm-
ers shifted production approaches to greater mechanization and relocated on-
farm field crop production to better quality soils, abandoning more marginal
areas. The result has been a simultaneous consolidation and expansion of large
commercial (industrial) farms, a decrease in the number of smaller family-owned
farms and an overall increase in average farm size (Vink and Van Rooyen 2009).
There has been a marked decline in the number of farming units in every prov-
ince (Figure 10). Vink and Van Rooyen (2009) reported that between 1990 and
2008, there was a 76% decline in the number of farmers farming on land over
20ha. While this figure has been contested, and absolute numbers may differ
slightly, the dual trend of farmer decline and farm consolidation is a reality in the
South African agrifood sector.
FIGURE 19: Decline in Number of Commercial Farms
0 2,000 4,000 6,000 8,000 10,000 12,000
Source: DAFF (2013)
THE URBAN FOOD SYSTEM OF CAPE TOWN, SOUTH AFRICAHUNGRY CITIES REPORT NO. 3 27 The Cape Town food system includes activities, actors and institutions connect- ed to, and interacting, in the production, processing and packaging, distribu- tion and retail, and consumption of food as well as waste disposal. The preferred outcome of these interactions is food security for all of the city’s residents. Cape Town’s food system is complex, reflecting the above regulatory changes running concurrently with an informal food system that originally emerged to counter the inequalities enforced by apartheid. The informal system is active and vibrant and engages in similar activities as the formal sector. The only difference is effectively one of visibility, in terms of policy and law. The informal sector remains largely illegal, despite the fact that it and the formal sector are directly connected and often reliant on one another. This mutuality is perhaps most evident in the fact that recently Massmart (the South African Walmart subsidiary) stated that as much as 50% of its business comes from the informal sector. The connections exist not only in retail but also in production, processing, packaging, and waste management, and even in the prepared food sector. All of the components of a typical city food system are represented to a greater or lesser degree within the city limits and Figure 20 assists in demonstrating its inter-connected components. However, the complex nature of the food sys- tem means that in the absence of a long-term recording of food system activi- ties, much of it remains unseen, masked by corporate confidentiality concerns, unclear reporting measures (such as on food flows), and a general absence of an obligation to report information and data. The absence of a food governance mandate in Cape Town (and in all other South African cities) means that no institution is tasked with the monitoring of the food system. The food system is largely in the hands of the private sector, which means that data is not uniformly recorded or readily available. The control of substantial components of the food system by large private sector players is thus a fundamental challenge to evidence-based food system governance (Haysom 2015).
28                                                     HUNGRY CITIES PARTNERSHIP

   FIGURE 20: Components of the Urban Food System

   Source: Troosters (2015: 29)

   6.1 Sources of Food and Food Flows

   6.1.1 National Food Sources

   South African commercial agriculture, while highly mechanized, is a high-risk
   activity. Only 35% of South Africa’s land surface receives sufficient rainfall for
   dryland crop production and only 13% of the land is suitably arable, with only 3%
   considered high potential agricultural land (Haysom and Metelerkamp 2012). As
   climate volatility increases, the viability of the local food system is coming under
   severe pressure. When the resource challenges are combined with the volatil-
   ity that comes with open and liberalized markets, the food system pressures are
   further amplified. This was highlighted in the 2016 Bureau for Food and Agri-
   cultural Policy (BFAP) report:

THE URBAN FOOD SYSTEM OF CAPE TOWN, SOUTH AFRICA
HUNGRY CITIES REPORT NO. 3                                                                29

   Despite some volatility owing to its dependence on global markets and on an inclem-
   ent climate, gross value added by the sector expanded by more than 15% in real
   terms since 2005. However, this expansion peaked at over 30% in 2014, before
   declining rapidly in the past two seasons as a result of extreme drought in the sum-
   mer rainfall regions (BFAP 2016: 1).

Agricultural outputs fall into three broad categories: field crops, horticulture and
animal production. Largely driven by the changes in the nature of the agricul-
tural economy, there has been a shift in the relative importance of each with
declines in field crops, increases in horticulture, and livestock remaining rela-
tively constant before a fairly dramatic increase in recent years (Table 12).

TABLE 12: Sectoral Share of Agricultural Output,1981-2013
Years                     Field Crops (%)        Horticulture (%)    Animal Production (%)
1979-1983                      44.8                   16.2                   39.0
1984-1988                      39.5                   18.0                   42.5
1989-1993                      34.5                   21.3                   44.2
1994-1998                      33.5                   23.6                   43.2
1999-2003                      34.0                   25.7                   40.3
2004-2008                      26.8                   26.5                   46.7
2009-2013                      26.8                   25.6                   47.6
Source: DAFF (2016)

The relative importance of animal production is a result of poor soils and the
climate and rainfall needed for field crops and horticulture. From a field crop
perspective, very little maize – a key staple for most people within the city of
Cape Town and the province – is produced in the Western Cape. However, the
province is a key wheat-growing region in South Africa, accounting for around
a third of all wheat produced (Figure 21).

Trends in vegetable production, classified under horticulture, are reflected in
Figure 22. This figure raises critical questions about the changes taking place in
the South African food system. The product showing the greatest growth is the
potato crop. When considered against a backdrop of the tepid performance of
other horticultural crops, this expansion in production output provides further
insights into changes in both agricultural production, resource use (for example
water), and diets.

Fruit production in South Africa has benefited from the opening up of markets.
Access to new markets, and changes in how farmers and producer organizations
could engage the market, resulted in the expansion of fruit production. As the
Western Cape is ideally suited to the production of wine and some pome fruits,
the expansion resulted in marked changes in the production landscape. Despite
30                                                                      HUNGRY CITIES PARTNERSHIP

    this, open markets mean that the fruit available to the Cape Town consumer is
    often imported. Figure 23 shows South African production changes in some key
    fruits (though not all are grown in the Western Cape).

    FIGURE 21: Wheat Production by Province, 1994-2015
                  1,000

    Source: DAFF (2016: 12)

    FIGURE 22: Selected South African Vegetable Production, 1990-2015
                         3,000

                         2,500

                         2,000
   Production (1,000t)

                         1,500

                         1,000

                          500

                            0
                                 Potatoes   Tomatoes   Pumpkin   Onions   Cabbage   Carrots

    Source: DAFF (2016: 54)

THE URBAN FOOD SYSTEM OF CAPE TOWN, SOUTH AFRICA
HUNGRY CITIES REPORT NO. 3 31
FIGURE 23: Key Fruit Crop Production, 1990-2015
2,500,000
2,000,000
1,500,000
1,000,000
500,000
0
Source: DAFF (2016: 35,36,37,50)
Changes in the eating habits of South African consumers are perhaps best reflect-
ed in the meat industry. There is a general trend of reduced consumption of beef
and pork (and other red meat) and an increase in the consumption of poultry
(Figure 24). The size of the cattle herd has remained constant since the 1980s
with a reported herd size of 12.9 million head in 1980 and 13.7 million in 2014/5
(DAFF 2016: 56). Poultry has eclipsed all other meat consumed and is arguably
the key source of protein for most South Africans.
FIGURE 24: Consumption of White and Red Meat, 1990-2014/5
45.00
40.00
35.00
30.00
25.00
20.00
15.00
10.00
5.00
0.00
Source: DAFF (2016: 66)32 HUNGRY CITIES PARTNERSHIP
South Africa’s apartheid legacy is a food system with high levels of concentration
in all aspects of the food value chain. For example, there are 5-6,000 wheat farm-
ers but the four main millers control 87% of the market and are integrated with
plant bakers (Cutts and Kirsten 2006). There are only 13 milk buyers of which
the largest four process 65% of commercial milk. The broiler meat industry is
controlled by two major players who control 50% of the industry (Louw et al
2007:4). Maize and soy are the main inputs for chicken feed - and four compa-
nies control 75% of maize milling (Makgetla 2017) . The nature of the South
African agro-food system is described by Greenberg (2016: 36) as follows:
The South African agro-food system has the characteristics of a corporate-led food
regime, accompanied by economic concentration and centralisation of power, espe-
cially since deregulation in the early 1990s. Although there is an ongoing role for
the state, the combination of greater corporate self-regulation and the multinationali-
sation of agro-food capital ensure a shift in the relationship towards greater corporate
power. Characteristics of the contemporary regime include economies of scale, merg-
ers and acquisitions and concentration and centralisation of ownership and power.
Despite the high degree of corporate concentration, there is intense competi-
tion by companies and a related unwillingness to supply detailed information
on food flows to researchers. Any attempt to ascertain what proportion of the
cereals, fruit, vegetables and livestock produced nationally makes its way to Cape
Town and is actually consumed there is thwarted. Cape Town consumption of
food therefore needs to be considered within the context of wider South African
consumption patterns (Figure 25). What is evident is a real decline in grain con-
sumption and an increase in meat consumption.
FIGURE 25: Consumption Expenditure on Key Foods
40.00
35.00
30.00
25.00
20.00
15.00
10.00
5.00
0.00
Source: DAFF (2016: 96)
THE URBAN FOOD SYSTEM OF CAPE TOWN, SOUTH AFRICAYou can also read