The Venture Capital and Private Equity Country Attractiveness Index 2021 - Tenth Edition Alexander Groh, Heinrich Liechtenstein, Karsten Lieser ...
←
→
Page content transcription
If your browser does not render page correctly, please read the page content below
The Venture Capital and Private Equity
Country Attractiveness Index 2021
Tenth Edition

Alexander Groh, Heinrich Liechtenstein, Karsten Lieser and Markus Biesinger
Foreword by the Research Team

We are pleased to present the tenth edition of our results from exclusively focusing on those factors
Venture Capital and Private Equity Country which really shape the attractiveness of particular
Attractiveness Index. The index measures the VC and PE markets, and weighting them
attractiveness of countries for investors in the reasonably.
venture capital (VC) and private equity (PE) asset
 In future editions, selected data series may be
classes. It provides the most up-to-date aggregated
 substituted by newer or more appropriate ones.
information on the quality of the investment
 Additional data could be added, while other series
environment and an assessment of the ease of
 with poor explanatory power can be deleted. As a
transaction-making in 125 countries.
 result, our composite measure remains a dynamic
Although we are aware that the stage of research product that always takes into account the
development in many of the covered emerging most relevant and recent data. We believe this index
markets is not yet sufficiently mature to support VC is unique in providing such a broad scope of
or PE transactions, we expect improvements in the information on the VC and PE capital market
future. We have therefore started tracking these segment. We hope that investors appreciate the
emerging economies and our index illustrates the information generated to aid their decision-making;
progress of their investment conditions. while politicians may utilise the index to benchmark
 their countries and to make improvements to attract
As we did in recent years, we prove that our index
 international risk capital.
corresponds with the actual VC and PE investment
activity in our sample of countries. This We are very grateful for the support of our Research
demonstrates the quality of our composite measure Assistants Ferdinand Schwarzer, Diego Cobián, and
and its value to investors. The high explanatory Rishin Banerjee. They provided substantial effort to
power of our index for the real VC and PE activity update the data and to compile the new index.

 The Venture Capital and Private Equity Country Attractiveness Index 2021 | 2
Website

Please visit our website http://blog.iese.edu/vcpeindex/ where you can download the pdf of this annual, and find
additional information, links to literature, multimedia presentations, and analytical tools for country benchmarking
purposes.

 The Venture Capital and Private Equity Country Attractiveness Index 2021 | 3
Contents

About the Editors ............................................................................................................................................ 5
Research Team............................................................................................................................................... 6
How to Measure a Country’s Attractiveness for Investors in VC and PE Assets .................................................. 7
Building the 2021 Index................................................................................................................................. 12
The 2021 VC and PE Country Attractiveness Ranking..................................................................................... 16
The Regional VC and PE Attractiveness Landscape ........................................................................................ 18
Historic comparison and allocation recommendations..................................................................................... 19
Tracking Power of our Index .......................................................................................................................... 19
Summary and Outlook .................................................................................................................................. 21
References ................................................................................................................................................... 22
Appendix 1: Structure of the VC/PE Index, Separate VC and PE Indices, and Weighting Schemes ................... 25
Appendix 2: Computation of the Index ........................................................................................................... 30
Appendix 3: Statistical Validation of the Index ................................................................................................. 33

 The Venture Capital and Private Equity Country Attractiveness Index 2021 | 4
About the Editors

Prof. Dr. Alexander Groh
Alexander Groh is Professor of Finance at EMLYON Business School, France. He has held visiting positions at
the University of California, Berkeley, U.S., the University of New South Wales, Sydney, Australia, IESE Business
School, Barcelona, Spain, and INSEAD, Fontainebleau, France. His research focuses on VC and PE, and
includes performance measurement and socio-economic determinants for the development of vibrant VC and PE
markets. His papers have been published in the Journal of Financial Economics, the European Economic Review,
the Journal of Banking and Finance, the Journal of Corporate Finance, the Journal of International Money and
Finance, the European Financial Management Journal, the Journal of Alternative Investments, the Journal of Real
Estate Finance and Economics, the Emerging Markets Review, in Venture Capital, the Journal of Business
Venturing, and Research Policy among others. He was involved in VC/PE fund management education courses
for Invest Europe (formerly EVCA), and has worked for Quadriga Capital, a Frankfurt based Private Equity fund,
since 1996.
Dr. Groh received a joint Master’s Degree of Mechanical Engineering and Business Administration from
Darmstadt University of Technology, where he also gained his Doctoral Degree in Finance.

Prof. Dr. Heinrich Liechtenstein
Heinrich Liechtenstein is Professor of Financial Management at IESE Business School, Barcelona – University of
Navarra, Spain. His areas of interest are entrepreneurial finance, Venture Capital and Private Equity, wealth
management and families’ strategies. He is active in the supervisory and advisory boards of several family
holdings and foundations, as well as a private equity firm.
Dr. Liechtenstein has experience in wealth management and owners’ strategies at LGT and as a consultant at
The Boston Consulting Group. He has previously founded and sold two companies.
Dr. Liechtenstein received an MA in Business Administration from the University of Graz, an MBA from IESE
Business School, and a Doctoral Degree of Business and Economic Sciences from the University of Vienna.

Dr. Karsten Lieser
Karsten Lieser is Managing Partner and CIO of eXapital, a pan-European investment and capital solutions firm for
alternative assets. Prior, he was Investment Director of Allianz Real Estate overseeing large pan-European
transactions across multiple sectors. He previously worked as investment professional at leading international
private equity and real estate firms.
Dr. Lieser holds a joint Master’s Degree in Business Administration and Engineering and a PhD in Finance. He is
fluent in German, English, French and Spanish.

Markus Biesinger
Markus Biesinger is Associate, Private Equity at the European Bank for Reconstruction and Development (EBRD)
where he works on the origination, execution, and monitoring of a variety of growth capital investments. Prior to
joining EBRD, he was a research fellow at IESE Business School in Barcelona. Prior to that, he worked at ODDO
BHF in Frankfurt, where he advised on equity capital markets transactions.
Mr Biesinger holds a joint degree in Business Administration and Computer Science from Technology University
of Darmstadt, where he is also pursuing a part-time PhD in finance.

 The Venture Capital and Private Equity Country Attractiveness Index 2021 | 5
Research Team

Alexander Groh
Professor, EMLYON Business School, groh@em-lyon.com

Heinrich Liechtenstein
Professor, IESE Business School, hl@iese.edu

Karsten Lieser
Managing Partner/CIO, eXapital, kl@exapital.com

Markus Biesinger
Guest Researcher, IESE Business School

Ferdinand Schwarzer
Research Assistant, IESE Business School

Diego Cobián
Research Assistant, IESE Business School

Rishin Banerjee
Research Assistant, IESE Business School

 The Venture Capital and Private Equity Country Attractiveness Index 2021 | 6
How to Measure a Country’s Attractiveness for Investors in
VC and PE Assets

Without being familiar with the socio-economic conditions that motivate our index. The existence of
environment in various host countries, an investor a prospering VC and PE market infrastructure and
cannot make rational international VC and PE investment environment requires many socio-
allocation decisions. Investors overcome potential economic and institutional prerequisites. We
knowledge deficits and gather data to analyse the presume that several emerging countries are not yet
determinants they deem important before allocating sufficiently mature in terms of their socio-economic
to a particular country. However, this country due development to support the VC and PE business
diligence is time-consuming and costly. Additionally, model. Too early entrance in those countries does
the pace of economic development of many not appear to be a beneficial strategy. However, our
emerging countries makes the selection of those index tracks the countries’ socio-economic and
that meanwhile support VC and PE activity more institutional development and reveals improvements.
and more cumbersome. Our index guides This allows investors to better observe foreign
institutional investors to solve the problem of where markets and to recognise good timing for
to allocate their capital. We aggregate and provide allocations.
the requisite information for international VC and PE
allocation decisions. Of course, this information
cannot act as a substitute for investors’ own efforts What are Institutional Investors’ International VC and
to build up country knowledge and experience. It PE Allocation Criteria?
can only facilitate this process and support the initial
 Our index addresses the first level of investors’
due diligence stage.
 concerns from a top-down perspective and
We propose a composite measure that benchmarks evaluates countries with respect to socio-economic
the attractiveness of 125 countries to receive criteria for international VC and PE allocation. These
institutional VC and PE allocations. Our intention is criteria assess, in the first instance, the
to serve the investment community, preparing and determination of local demand for VC and PE and
analysing a large quantity of socio-economic data. second, the expectation of an efficient deal-making
However, it is not only the financial community that environment which allows matching with the
can benefit from our research, politicians may also supplied capital. Further levels of the allocation
conclude that vibrant risk capital markets increase process include the selection of particular fund
innovation, entrepreneurial activity, economic management teams. Thereby, the investors evaluate
growth, employment, competitiveness and wealth the general partners’ competencies, their track
and hence they may be interested in increasing the records and other parameters in their fund due
supply of risk capital in their countries. diligence before committing to a general partner.1
 However, these criteria cannot be considered in our
There is a major shift of focus from “traditional” and
 index because they depend on individual cases,
mature VC and PE markets towards emerging
 personal judgment and mostly undisclosed data.
regions. Emerging countries attract investors by high
economic growth opportunities. Nevertheless, as we Institutional investors communicated to us that
subsequently discuss, growth opportunities are not levels of valuation are also important for their
the only factor that renders countries attractive for decisions. Unfortunately, we cannot compare
VC and PE investments, and it is these broader valuation levels across countries for two major

1
 For more details please refer to Groh, Alexander and Capital Funds, European Journal of Financial Management, Vol.
Liechtenstein, Heinrich (2011): The First Step of the Capital Flow 17, Issue 3, 2011, pp. 532-559. Related working papers are
from Institutions to Entrepreneurs: The Criteria for Sorting Venture available on http://blog.iese.edu/vcpeindex/.

 The Venture Capital and Private Equity Country Attractiveness Index 2021 | 7
reasons. First, there is too little information provided Importance of Economic Activity
on transaction multiples. Second, multiples reflect
 Evidently, the state of a country’s economy affects
the relationship between the expected growth in
 its VC/PE attractiveness. An economy’s size and
certain industries (and countries) and the
 employment levels are proxies for prosperity, the
opportunity cost of capital. It is impossible to
 number and diversity of corporations and general
estimate these parameters and to find a common
 entrepreneurial activity, and therefore also for
benchmark for all of our sample countries. Instead,
 expected VC and PE deal flow. Economic growth
we need to take a practical approach and assess
 expectations require investments and provide the
the expected deal opportunities arising from the
 rationale to enter many emerging countries.
socio-economic environment in a country without
 Gompers and Lerner (1998) argue that more
addressing valuation levels. Investors will need to
 attractive VC and PE investment opportunities exist
enrich our assessment with their own knowledge
 if an economy is growing quickly. Romain and van
and expectations about deal values.
 Pottelsberghe de la Potterie (2004) find that VC/PE
Our index summarises factors that shape national activity is cyclical and significantly related to GDP
VC and PE markets into one single composite growth. Wilken (1979) highlights the fact that
measure. The determinants of vibrant VC and PE economic prosperity and development facilitate
markets have been extensively studied in academic entrepreneurship, as they provide a greater
literature. We reviewed this literature and collect accumulation of capital for risky investments. The
data for our index spanning several years to verify number of new ventures that qualify for VC backing
these studies and actually contribute to a better is related to societal wealth, not solely because of
understanding of the drivers of international VC and generally better access to financing, but also
PE activity. With every subsequent index edition, we because of higher income among potential
become more confident in our ability to assess the customers in the domestic market. Economic size
right criteria for VC and PE investors. These criteria and growth are certainly very important criteria to
are derived from the research on the topic that we assess expected deal opportunities and VC/PE
group into six sub-headings. These sub-headings country attractiveness. However, economic growth
illustrate the structure of our index as each presents itself is also a result of many other criteria which we
one of six “key drivers” of country attractiveness for discuss within the subsequent key drivers.
investors in VC and PE assets:
 1. Economic Activity,
 Importance of Depth of Capital Market
 2. Depth of Capital Market,
 Black and Gilson (1998) discuss major differences
 3. Taxation, between bank-centred and stock market-centred
 4. Investor Protection and Corporate capital markets. They argue that well-developed
 Governance, stock markets, which allow general partners to exit
 via IPOs, are crucial for the establishment of vibrant
 5. Human and Social Environment, and VC/PE markets. In general, bank-centred capital
 6. Entrepreneurial Culture and Deal markets are less able to produce an efficient
 Opportunities. infrastructure of institutions that support VC/PE
 deal-making. They affirm that it is not only the strong
These key drivers define a subset of criteria we need
 stock market that is missing in bank-centred capital
to assess for our sample countries in order to
 markets; it is also the secondary institutions in place,
aggregate our index.2
 including bankers’ conservative approach to lending
 and investing, and the social and financial incentives
 that reward entrepreneurs less richly (and penalise

2
 For a comprehensive review please refer to Groh, Alexander, Indices, Journal of Corporate Finance, Volume 16, Issue 2, April
Liechtenstein, Heinrich and Lieser, Karsten (2010): The European 2010, pp. 205 – 224.
Venture Capital and Private Equity Country Attractiveness

 The Venture Capital and Private Equity Country Attractiveness Index 2021 | 8
failure more severely), that compromise Importance of Taxation
entrepreneurial activity. Jeng and Wells (2000) stress
 Bruce (2000 and 2002), and Cullen and Gordon
that IPO activity is the main force behind cyclical VC
 (2002) reveal that tax regimes matter for business
and PE swings because it directly reflects the
 entry and exit. Djankov et al. (2008) show that direct
returns to investors. Kaplan and Schoar (2005)
 and indirect taxes affect entrepreneurial activity.
confirm this. Similar to Black and Gilson (1998),
 Poterba (1989) builds a decision model showing the
Gompers and Lerner (2000) point out that risk
 advantages of becoming an entrepreneur, driven by
capital flourishes in countries with deep and liquid
 taxation incentives. Bruce and Gurley (2005) explain
stock markets. Similarly, Schertler (2003) uses the
 that increases in personal income tax can raise the
capitalisation of stock markets or the number of
 probability of becoming an entrepreneur: large
listed companies as measures for stock market
 differences between personal income tax rates and
liquidity and finds that they significantly impact VC
 corporate tax rates provide an incentive for start-up
and PE investments.
 activity.
As well as the disadvantages of bank-centred
 While it is much discussed in economic literature
capital markets, Greene (1998) emphasizes that low
 and reasonable to predict that taxation of income
availability of debt financing is an obstacle for
 drives corporate activity and new venture creation, it
economic development, especially for start-up
 is more difficult to detect a direct link with VC and
activity in many countries. Corporations and
 PE investments. There are countries with relatively
entrepreneurs need to find backers — whether
 high corporate income tax rates but also very large
banks or VC/PE funds — who are willing to bear
 VC and PE investments at the same time. On the
risk. Cetorelli and Gambera (2001) provide evidence
 other hand, there are many (especially emerging)
that bank concentration promotes the growth of
 countries with low corporate tax rates where no
those industrial sectors that have a higher need for
 remarkable VC and PE investments are reported. In
external finance by facilitating credit access to
 general, developed countries have higher tax
companies.
 brackets, but also more VC and PE investments.
To summarise, the state of a country’s capital This signals that the levels of taxes themselves do
market evidently affects its VC and PE activity. There not strongly affect VC and PE activity. It also points
is a direct link between the quoted capital market, to the characteristic reliance of the VC and PE asset
banking activity and the unquoted segment. Banks classes on tax transparent fund and transaction
are required for transaction financing and credit structures that neutralise the differentials across tax
facilities. The size of the IPO market indicates the regimes. Therefore, we focus on the incentives for
potential for the preferred exit channel and IPOs new venture creation provided by the spread
likewise spur entrepreneurial spirit because they between personal and corporate income tax rates
reward entrepreneurs. This may be considered as as suggested by Bruce and Gurley (2005) and
analogous to the size of the M&A market, which also reward tax regimes with low administrative burdens
incentivises entrepreneurial managers and presents and requirements in our index. However, since
the second preferred VC/PE divestment channel, as these tax aspects are more important for start-up
well as deal sourcing opportunities. Therefore, the activity, and hence for the VC segment, we assign a
liquidities of the M&A, banking, and public capital low weight to this key driver and do not use it to
markets provide good proxies for the VC and PE assess attractiveness in the PE-only index as
segment because they assess the quality of the VC subsequently discussed.
and PE deal-making infrastructure. In countries with
a strong public capital market, M&A, and banking
activity, we also find the professional institutions,
such as investment banks, accountants, lawyers,
M&A boutiques or consultants, which are essential
for successful VC and PE deal-making.

 The Venture Capital and Private Equity Country Attractiveness Index 2021 | 9
Importance of Investor Protection and Corporate enforcement possibilities. VC and PE are strongly
Governance exposed to this circumstance because they are
 based on long-term relationships with institutional
Legal structures and the protection of property
 investors, where the investment source and host
rights strongly influence the attractiveness of VC and
 countries can be distant and different. Investors rely
PE markets. La Porta et al. (1997 and 1998) confirm
 on their agents, and the general partners
that the legal environment determines the size and
 themselves rely on the management teams they
extent of a country’s capital market and local
 back. If investors are not confident that their claims
companies’ ability to receive outside financing. They
 are well protected in a particular country, they refuse
emphasize the differences between statutory law
 to allocate capital.
and the quality of law enforcement. Roe (2006)
discusses and compares the political determinants
of corporate governance legislation for the major Importance of Human and Social Environment
economies and focuses on the importance of strong
shareholder protection to develop a vibrant capital Black and Gilson (1998), Lee and Peterson (2000),
market. Glaeser et al. (2001) and Djankov et al. and Baughn and Neupert (2003) argue that cultures
(2003 and 2005) suggest that parties in common- shape both individual orientation and environmental
law countries have greater ease in enforcing their conditions, which may lead to different levels of
rights from commercial contracts. entrepreneurial activity. Megginson (2004) argues
 that, in order to foster a growing risk capital
Cumming et al. (2006) find that the quality of a
 industry, education with respect to schools,
country’s legal system is even more closely related
 universities and research institutions plays an
to facilitating VC/PE backed exits than the size of a
 important role.
country’s stock market. Cumming et al. (2009)
extend this finding and show that cross-country Rigid labour market policies negatively affect the
differences in legality, including legal origin and evolution of a VC/PE market. Lazear (1990) and
accounting standards, have a significant impact on Blanchard (1997) discuss how protection of workers
the governance of investments in the VC/PE can reduce employment and growth. It is especially
industry. Desai et al. (2006) show, that fairness and important for start-up and medium-size corporations
property rights protection largely affect growth and to respond quickly to changing market conditions.
the emergence of new enterprises. Cumming and Black and Gilson (1998) argue that labour market
Johan (2007) highlight the perceived importance of restrictions influence VC/PE activity, though not to
regulatory harmonisation with respect to investors’ the same extent as the stock market.
commitments to the asset class. La Porta et al. Djankov et al. (2002) investigate the role of several
(2002) find a lower cost of capital for companies in societal burdens for start-ups. They conclude that
countries with better investor protection, and Lerner the highest barriers and costs are associated with
and Schoar (2005) confirm these findings. Johnson corruption, crime, a larger unofficial economy and
et al. (1999) show that weak property rights limit the bureaucratic delay. This argument is of particular
reinvestment of profits in start-up companies. importance in some emerging countries with high
Finally, and more broadly, Knack and Keefer (1995), perceived levels of corruption.
Mauro (1995), and Svensson (1998) demonstrate
that property rights significantly impact investments
and economic growth. Importance of Entrepreneurial Culture and Deal
The numerous studies cited above illustrate the Opportunities
importance of the quality of a country’s legal system The expectation regarding access to viable
for its capital market, be it in terms of the quoted or investments is probably the most important factor
unquoted segment. Nevertheless, what is important for international risk capital allocation decisions.
for financial claims is equally valid for any claim in Particularly for the early stage segment, we expect
the corporate world. Doing business becomes the number and volume of investments to be related
costly without proper legal protection and to the innovation capacity and research output in an

 The Venture Capital and Private Equity Country Attractiveness Index 2021 | 10
economy. Gompers and Lerner (1998) show that evaded. On the other hand, many of the criteria are
both industrial and academic research and highly correlated with each other. Black and Gilson
development (R&D) expenditure significantly (1998) call it a “chicken and egg” problem: it is
correlates with VC activity. Kortum and Lerner impossible to detect which factor causes the other.
(2000) highlight that the growth in VC fundraising in One line of argument is that modern, open and
the mid-1990s may have been due to a surge of educated societies develop a legislation that
patents in the late 1980s and 1990s. Schertler protects investors’ claims, which favours the output
(2003) emphasizes that the number of both R&D of innovation and the development of a capital
employees and patents, as an approximation of the market. This leads to economic growth and to
human capital endowment, has a positive and highly demand for VC and PE. However, the causality
significant influence on VC activity. Furthermore, might be the reverse: economic growth spurs
Romain and von Pottelsberghe de la Potterie (2004) innovation and the development of modern
find that start-up activity interacts with the R&D educated societies. There is a third suggestion: only
capital stock, technological opportunities and the competitive legal environments allow the
number of patents. However, innovations and R&D development of the societal requirements that
are not only important for early stage VC support innovations, economic growth, the capital
investments. Without modernisation and sufficient market, and VC and PE activity. Finally, there is a
R&D, it will be impossible for established businesses fourth alternative, which may also be relevant: low
to maintain brand names and strong market taxes attract investors who provide financing for
positions, factors which attract later stage PE growth which in turn leads to modern and educated
investors. societies.
Despite the innovative output of a society, Djankov All lines of argument are reasonable and validated
et al. (2002), and Baughn and Neupert (2003) argue by the economic development of selected countries
that bureaucracy in the form of excessive rules and in different historic periods. Nevertheless, it seems
procedural requirements, multiple institutions from to be the combination of all these factors which
which approvals are needed and cumbersome need to be improved in parallel to increase VC and
documentation requirements, may severely PE attractiveness of countries and regions. For this
constrain entrepreneurial activity. Lee and Peterson reason, we do not rely on a selection of only a small
(2000) stress that the time and money required to number of parameters. For a country to receive a
meet such administrative burdens may discourage high index rank, it needs to achieve a high score on
new venture creations. all of the individual criteria. Therefore, we propose a
 structure of the discussed determinants to achieve a
 comprehensive result and to facilitate interpretation.
Summary on the Determinants of Vibrant VC and PE Firstly, we differentiate the six key drivers: economic
Markets activity, depth of the capital market, taxation,
 investor protection and corporate governance,
The research papers emphasise the difficulty of
 human and social environment, and entrepreneurial
identifying the most appropriate parameters for our
 culture and deal opportunities. We then confirm their
index. There is no consensus about a ranking of the
 choice via a survey of institutional investors,
criteria. While some parameters are more
 reported in Groh and Liechtenstein (2009) and
comprehensively discussed, and certainly of high
 (2011), and base our index structure upon them.
relevance, it remains unclear how they interact with
 Unfortunately, none of these six key drivers is
others. For example, it is arguable whether the
 directly measurable, so we seek data series that
VC/PE activity in a country with a high quality of
 adequately express their character. Hence, we try to
investor protection is affected more by the liquidity
 find best proxies for the aforementioned drivers of
of its stock market or by its labour regulations.
 VC/PE attractiveness. One constraint is that these
While an IPO exit is, in principle, possible at any proxies must be available for a large number of
stock exchange in the world, the labour market countries.
frictions in a particular country can hardly be

 The Venture Capital and Private Equity Country Attractiveness Index 2021 | 11
Building the 2021 Index

Assessing Six Latent Key Drivers and more deal-supporting institutions will exist to
 facilitate VC and PE activity. Hence, we assess the
The most important principle of our index is to
 latent key driver with observable data. This principle
assess the six latent drivers of VC/PE attractiveness:
 is maintained at all individual levels for the index
 1. Economic Activity, construction. An unobservable criterion is assessed
 2. Depth of Capital Market, with several proxy parameters. In principle, we
 measure the attractiveness of a country by the six
 3. Taxation, key drivers but use many more proxies for their
 4. Investor Protection and Corporate assessment. We always use several proxies so as
 Governance, not to be reliant on single individual data series
 which might be biased by different gathering
 5. Human and Social Environment, and procedures across the countries or by insufficient
 6. Entrepreneurial Culture and Deal reporting.
 Opportunities.
Latent drivers are criteria that are not directly
 How We Disaggregate the Six Key Drivers
observable, but driven by others which can be
measured. For example, we assume in a first step In accordance with the principle of assessing latent
that the VC/PE attractiveness of a country is key drivers with observable data, we disaggregate
determined by six key drivers. Nevertheless, as each key driver into sub-categories. These sub-
pointed out, the key drivers themselves are not categories are either individual data series or, again,
measurable but need to be estimated. For example, latent drivers dependent on determinants that we
ideally the quality of the deal-making environment in name “level-2 constructs.” For example, as
a country would be expressed by the number of documented in Exhibit 1, we split the key driver “2.
investment banks, M&A boutiques, law firms, Depth of the capital market” into six sub-categories:
accountants and consultants. Unfortunately, while it 2. Depth of Capital Market
might be possible to obtain these data for a
selected number of developed countries, such data 2.1 Size of the Stock Market,
does not exist on a global scale. Our only alternative 2.2 Stock Market Liquidity (Trading Volume),
is to gather more general information, for example
 2.3 IPOs and Public Issuing Activity,
on the level of debt provided by the banking sector,
or estimates about the perceived sophistication of 2.4 M&A Market Activity,
the financial system. We submit that these criteria
 2.5 Debt and Credit Market,
affect the latent key driver, the depth of the capital
market. Even if they are not perfect proxies, we 2.6 Bank Non-Performing Loans to Total
maintain that in countries where these criteria are Gross Loans, and
better developed, the capital market will be deeper

 The Venture Capital and Private Equity Country Attractiveness Index 2021 | 12
Exhibit 1: The VC and PE Country Attractiveness Index – Construction Scheme

 The Venture Capital and Private Equity Country Attractiveness Index 2021 | 13
Data series 2.2 and 2.6 are provided by the World power of the individual key drivers. We will return to
Bank while the other indicators are constructs this topic in a later section of this annual.
themselves. For instance, we assess “2.3 IPOs &
Public Issuing Activity” by volume and by number of
issues. This approach has two major advantages. Separate VC and PE Indices
First, individual data series do not gain too much To account for differences with respect to the two
weight when they are grouped, and this limits the market segments, VC vs. PE, we propose three
impact of outliers. Second, the overall results can be related indices. The first one combines both
traced to more granulated levels which provide segments (VC/PE). The second focuses on early
complete transparency and better interpretation. stage VC only and the third index on later stage PE.
 The combined index includes all data series
 proposed in Appendix 1, while we discard the data
The Weighting Scheme
 series that are less important for either of the two
We spent a great deal of effort refining the statistical market segments when calculating the individual VC
analyses and optimising the structure for previous and PE indices.
index editions.3 We keep this optimised structure
 For the VC index, we consider the level-2 construct
and apply equal weights for all data series when we
 “2.5 Debt & Credit Market” to be of minor
aggregate them to the level-2 constructs and equal
 importance and hence, discard it. We also delete
weights for the level-2 constructs or indicators to
 “2.6 Bank Non-Performing Loans to Total Gross
aggregate them on the next higher level of the six
 Loans” from the VC index.
key drivers. Finally, the individual weights for the six
key drivers depend on the number of their level-2 For the PE index, we discard key driver “3.
constructs/indicators. For example, “1. Economic Taxation,” because the criteria considered are barely
Activity” consists of three level-2 indicators, “2. relevant for later-stage PE. Similarly, we drop “5.1
Depth of Capital Market” of six Education & Human Capital” from the human and
indicators/constructs, while “3. Taxation” consists of social environment key driver and keep only “6.5
only one. Overall, we use 21 level-2 constructs for Corporate R&D” to assess the deal opportunities
our index, and hence, “1. Economic Activity” related to proprietary research output of
receives a weight of 3/21, which is 0.143, while the corporations.
weight of “2. Depth of Capital Market” is 6/21, which The weights for the individual index items in the
is 0.286, and for “3. Taxation” it is 1/21 =0.048, separate VC and PE indices are determined in the
respectively. same way, and this leads to changes of some of the
The advantage of this weighting scheme is that the key driver weights. The results are highlighted on the
key drivers which include more level-2 individual country pages subsequent in this annual.
constructs/indicators, and hence more data, gain Appendix 1 shows the data series, the level-2
more weight. First, this represents their actual constructs and the weights for the combined
importance for VC and PE attractiveness as VC/PE, and the separate VC-only and PE-only
revealed by our own analyses and second, we indices. The weights are presented with respect to
diminish the effect of potential outliers. This final the next aggregation level. Hence, “1.1 Size of the
index structure results from substantial prior Economy”, “1.2 Expected Real GDP Growth” and
optimisation effort. We find that any statistically “1.3 Unemployment” receive each a weight of
“more sophisticated” technique does not improve 33.3% when determining the Economic Activity key
the index quality. The weighting scheme assigns driver. The key driver itself has an importance of
appropriate emphasis according to the explanatory 14.3% for the aggregation of the overall VC/PE

3
 Details about the applied statistical procedures to determine Attractiveness Indices, Journal of Corporate Finance, Volume 16,
weights for the data series are provided in our paper Groh, Issue 2, April 2010, pp. 205 – 224. Related working papers are
Alexander, Liechtenstein, Heinrich and Lieser, Karsten (2010): available at http://ssrn.com/author=330804.
The European Venture Capital and Private Equity Country

 The Venture Capital and Private Equity Country Attractiveness Index 2021 | 14
index. We provide more information about the and “2.7. Financial Market Sophistication” from our
aggregation technique in the appendix. 2021 Index calculation. The latter data series was a
 level 1 indicator. Thus, its discontinuation also
 affects the overall index weighting scheme. The
Changes with Respect to the Prior Index Version modifications cause rank changes for some
Compared to our previous index structure, the countries compared to previously published index
number of underlying data series has decreased. versions. We comment on important incidents in the
The providers of five individual indicators subsequent section.
discontinued gathering/publishing their data and we
were unable to retrieve appropriate replacement at
 Country Coverage
the desired data quality level and for the necessary
sampling period. Therefore, we needed to discard We aim to cover as many countries as possible, and
data series “5.2.2. Rigidity of Hours Index”, “5.2.3. the inclusion/exclusion of a particular country is only
Difficulty of Firing Index”, “5.3.3.Extra contingent on data availability. This allows us to
Payments/Bribes”, “6.1.2. Capacity for Innovation”, cover 125 countries.

Region* Countries

Africa (31) Algeria, Angola, Benin, Botswana, Burkina Faso, Burundi, Cameroon, Chad, Côte d'Ivoire, Egypt, Ethiopia, Ghana,
 Kenya, Lesotho, Madagascar, Malawi, Mali, Mauritania, Mauritius, Morocco, Mozambique, Namibia, Nigeria,
 Rwanda, Senegal, South Africa, Tanzania, Tunisia, Uganda, Zambia, Zimbabwe

Asia (22) Armenia, Azerbaijan, Bangladesh, Cambodia, China, Hong Kong, India, Indonesia, Japan, Kazakhstan, Korea
 South, Kyrgyzstan, Malaysia, Mongolia, Pakistan, Philippines, Russia, Singapore, Sri Lanka, Taiwan, Thailand,
 Vietnam

Australasia (2) Australia, New Zealand

Eastern Europe (21) Albania, Belarus, Bosnia-Herzegovina, Bulgaria, Croatia, Czech Republic, Estonia, Georgia, Hungary, Latvia,
 Lithuania, Macedonia, Moldova, Montenegro, Poland, Romania, Slovakia, Slovenia, Turkey, Ukraine, Serbia

Latin America (17) Argentina, Bolivia, Brazil, Chile, Colombia, Dominican Republic, Ecuador, El Salvador Guatemala, Jamaica, Mexico,
 Nicaragua, Panama, Paraguay, Peru, Uruguay, Venezuela

Middle East (10) Bahrain, Israel, Jordan, Kuwait, Lebanon, Oman, Qatar, Saudi Arabia, Syria, United Arab Emirates

North America (2) United States, Canada

Western Europe (20) Austria, Belgium, Cyprus, Denmark, Finland, France, Germany, Greece, Iceland, Ireland, Italy, Luxembourg, Malta,
 Netherlands, Norway, Portugal, Spain, Sweden, Switzerland, United Kingdom

Note: * Number of countries covered in parentheses.

 The Venture Capital and Private Equity Country Attractiveness Index 2021 | 15
The 2021 VC and PE Country Attractiveness Ranking

We gathered the individual data series in Appendix 1 activity, thus narrowing the gaps among the “Depth
for all our sample countries from 2000 onwards to of Capital Market” key driver of many countries.
most recent data retrieved including the expected Potential Brexit effects are not (yet) visible in the
economic growth rates for 2021. We calculate the data and superimposed by the Covid-related
2021 index and find that, not surprisingly, the United damages.
States remains the most attractive country for VC
 Table 1 presents the ranking of The VC and PE
and PE allocations, retaining its ranking from all
 Country Attractiveness Index 2021. The table is
previous index editions. We rescaled the US score
 open to debate. Some readers might argue that
to 100.4 The US is followed by the United Kingdom,
 particular countries are ranked too high, others too
Japan, Germany, and Canada. While the distance
 low. However, we note that the index ranking is the
between the US and the UK has widened in our new
 result of commonly available, transparent,
index version, the gaps between the UK and her
 aggregated socio-economic data, which describes
followers and among the followers themselves have
 relevant characteristics for investors in VC and PE
become rather small. The UK scores 90.3 and her
 assets. The results can be traced to the level of the
followers achieve 87.4, 87.3, and 87.2, respectively.
 individual data series, and hence, can be reconciled.
These scores assign virtually equal ranks to Japan,
 Our index assesses a “probability for success” from
Germany, and Canada. We further note remarkable
 the institutional and socio-economic perspective.
rank changes compared to previous index versions
 This probability increases with better developed key
for Germany, China, South Korea, and France which
 driving forces as defined above.
could improve their positions, while Canada lost
attractiveness. These changes are partly driven by Please note that the underlying data is the most
the modification of the index structure as described recent information available. Hence, we show the
in the previous section and partly by the impact of current attractiveness ranking including the
the Covid pandemic. All high ranked countries are economic outlook for 2021 and invite investors and
assumed to recover relatively quickly from the Covid advisers to enrich the information with their own
related recession with China leading their peers. knowledge, experience and expectations when
Covid also strongly affected overall financial market drawing their conclusions on asset allocation.

4
 We explain the rescaling procedure in the appendix.

 The Venture Capital and Private Equity Country Attractiveness Index 2021 | 16
Table 1: The Venture Capital and Private Equity Country Attractiveness Ranking 2021
Country Rank Score Country Rank Score Country Rank Score
United States 1 100.0 Indonesia 43 57.8 Uruguay 85 34.8
United Kingdom 2 90.3 Cyprus 44 57.4 Mongolia 86 34.8
Japan 3 87.4 Lithuania 45 57.3 Tanzania 87 33.9
Germany 4 87.3 Vietnam 46 56.9 Botswana 88 33.5
Canada 5 87.2 Brazil 47 56.5 Macedonia 89 33.2
Singapore 6 85.0 Bulgaria 48 56.5 Armenia 90 32.9
China 7 84.7 Slovenia 49 56.5 Bosnia-Herzegovina 91 32.2
Australia 8 84.0 Greece 50 55.5 Georgia 92 31.7
Korea, South 9 83.8 Colombia 51 54.9 Zambia 93 31.4
France 10 83.6 Philippines 52 54.5 Azerbaijan 94 30.3
Hong Kong 11 82.4 Egypt 53 54.2 Algeria 95 29.5
Netherlands 12 81.7 Kazakhstan 54 54.1 Ecuador 96 29.2
Sweden 13 81.0 Morocco 55 54.0 Cambodia 97 28.4
Denmark 14 80.8 Malta 56 53.8 Kyrgyzstan 98 28.3
Switzerland 15 79.5 Croatia 57 53.1 Malawi 99 28.1
Finland 16 78.9 Qatar 58 52.3 Uganda 100 27.8
Norway 17 78.1 Kuwait 59 51.9 Moldova 101 27.0
New Zealand 18 76.7 Peru 60 51.8 Ivory Coast 102 25.9
Israel 19 76.5 Pakistan 61 51.6 Albania 103 25.6
Spain 20 76.1 Iceland 62 50.9 Bolivia 104 25.3
Belgium 21 75.0 Tunisia 63 50.7 Dominican Republic 105 24.2
Austria 22 75.0 Latvia 64 50.2 Guatemala 106 24.0
Malaysia 23 74.8 Serbia 65 50.0 Ethiopia 107 22.8
Ireland 24 73.9 Argentina 66 49.4 Mozambique 108 22.3
Taiwan 25 71.9 Bahrain 67 49.2 Senegal 109 22.1
India 26 71.0 Oman 68 48.4 Zimbabwe 110 21.9
Italy 27 70.8 Sri Lanka 69 48.0 El Salvador 111 21.9
Poland 28 67.8 Mauritius 70 47.8 Paraguay 112 21.2
Thailand 29 66.3 Jordan 71 47.7 Burkina Faso 113 20.9
Russian Federation 30 66.1 Slovakia 72 47.5 Mali 114 20.5
Portugal 31 65.4 Belarus 73 47.3 Madagascar 115 20.5
United Arab Emirates 32 64.8 Nigeria 74 46.7 Nicaragua 116 19.9
Czech Republic 33 64.1 Ghana 75 45.3 Benin 117 19.6
Chile 34 64.0 Kenya 76 44.8 Syria 118 19.5
Mexico 35 61.4 Montenegro 77 43.9 Cameroon 119 19.2
Luxembourg 36 61.4 Namibia 78 42.7 Lesotho 120 17.0
Saudi Arabia 37 61.4 Bangladesh 79 41.8 Mauritania 121 16.2
Estonia 38 61.0 Ukraine 80 40.7 Angola 122 15.1
Turkey 39 60.8 Panama 81 40.6 Chad 123 12.8
South Africa 40 60.3 Jamaica 82 39.8 Burundi 124 12.1
Romania 41 58.8 Rwanda 83 38.5 Venezuela 125 5.2
Hungary 42 58.8 Lebanon 84 37.6

 The Venture Capital and Private Equity Country Attractiveness Index 2021 | 17
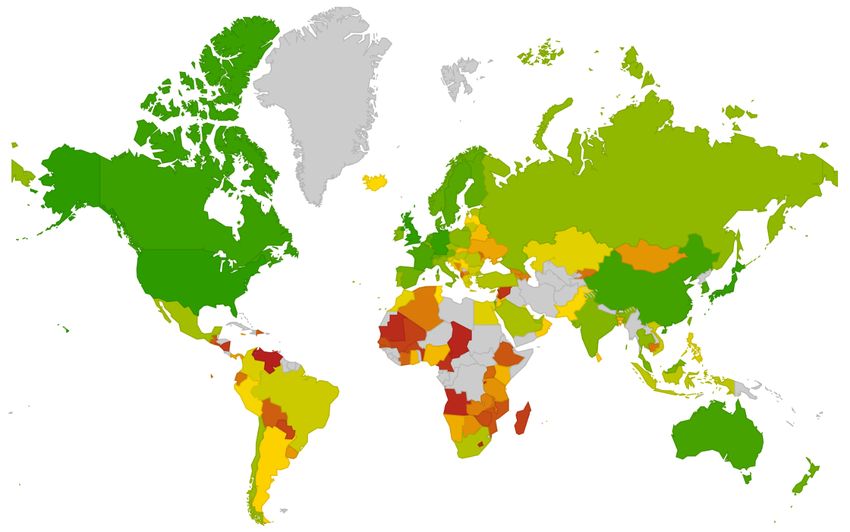
The Regional VC and PE Attractiveness Landscape

Our methodology allows calculating regional key Eastern Europe) and frontier markets (Latin America
driver scores as presented in Table 2. Note that and Africa) with respect to their capital market
these regional scores are not computed as “simple depth, investors’ protection, their human and social
averages”. They result from weighting the individual environment, and related to that, innovation driven
data series of the countries corresponding to a entrepreneurial and deal opportunities. We stress
particular region either by GDP or population, again that “Taxation” does not measure the levels of
whatever is more appropriate. We realize that the marginal corporate or capital gains tax rates. The
higher ranked core markets (North America, key driver rather assesses incentives for
Australasia and Western Europe) have consistently entrepreneurship resulting from the differential of the
better developed key drivers with the exception of personal and corporate income tax rates and the
economic activity. The table also reveals particular administrative burdens when determining and
weaknesses of emerging (Asia, Middle East and paying taxes.

Table 2: Regional VC and PE Attractiveness Landscape

 Investor
 Protection and Human Entrepreneurial
 Economic Depth of Corporate and Social Culture and Deal
Region VC/PE Index Activity Capital Market Taxation Governance Environment Opportunities

1. North America 95.4 95.0 95.8 100.2 101.5 89.3 94.3

2. Australasia 81.4 83.2 80.7 101.8 107.4 56.0 82.3

3. Western 75.7 79.3 71.1 106.4 89.8 57.5 79.0
Europe

4. Asia 65.6 81.8 66.0 91.7 76.7 42.9 62.8

5. Middle East 56.1 71.9 54.5 88.9 69.3 36.6 51.8

6. Eastern Europe 53.6 68.6 45.5 95.1 71.2 33.9 55.8

7. Latin America 44.9 69.0 40.2 85.3 55.1 27.2 41.8

8. Africa 38.9 62.4 28.5 82.2 59.0 26.5 35.9

 The Venture Capital and Private Equity Country Attractiveness Index 2021 | 18
Historic comparison and allocation recommendations

In order to demonstrate shifts in the VC and PE investors avoidance of the countries in the lower left
country attractiveness, we calculate our current quadrant. Contrarily, we see the promising
index back for the year 2016 and compare the development of the countries to the right-hand side
rankings. Exhibit 2 shows the current country ranks of the ordinate. The countries in the right upper
(ordinate) and the historic rank changes (abscissa - quadrant can be considered highly attractive
positive to the right and negative to the left) between investment hosts. The lower right corner groups the
the two indices. It provides interesting insights and countries with increasing but yet moderate levels of
reveals strong increases of VC and PE attractiveness. The further down we get in the graph
attractiveness for certain countries, and downgrades the lower the maturity of these countries to support
for others. We aim to avoid commenting on VC and PE transactions. However, investors should
individual countries and rather refer the reader to our stay alert not to miss the right time to enter.
website where Exhibit 2 is linked with the individual
 For more information and comparisons, we refer to
country profiles and additional analytic tools. Exhibit
 the individual country profiles on our website
2 allows insights from interpreting the four
 http://blog.iese.edu/vcpeindex/ where additional
quadrants of the graph. Obviously, all countries on
 graphs, analyses, and benchmarking tools are
the left-hand side of the exhibit should be carefully
 available.
observed by investors, in particular the lower their
current rank. It seems reasonable to recommend to

Exhibit 2: Current Ranks and Rank Changes between Index Version 2016 and 2021
 1
 Japan
 Singapore China
 Decreasing at t ract iveness, France Highly at t ract ive,
 Sweden
 observe Finland increase exposure
 Belgium Spain
 I reland
 I ndia

 Unit ed Arab Emirat es
 Chile
 Turkey Est onia
 I ndonesia Cyprus
 Brazil Viet nam
 Slovenia Greece
 Colombia Philippines
 Egypt
 Morocco Malt a
 Rank 2021

 Qat ar Kuwait
 Peru Pakist an I celand
 Lat via Serbia
 Argent ina
 Oman
 Slovakia Belarus
 Nigeria Ghana
 Mont enegro
 Ukraine
 Lebanon
 Bot swana Macedonia
 Georgia Bosnia- Herzegovina
 Zambia Azerbaijan
 Malawi
 Albania I vory Coast
 Bolivia

 El Salvador
 Mali Burkina Faso
 Unat t ract ive, I ncreasing at t ract iveness,
 Cameroon Syria
 avoid Lesot ho st ay alert
 Chad
125
 - 20 - 15 - 10 -5 0 5 10 15 20
 Change in rank 2016-2021
 Africa Asia Aust ralasia East ern Europe Lat in America Middle East Nort h America West ern Europe

 The Venture Capital and Private Equity Country Attractiveness Index 2021 | 19
Tracking Power of our Index

Our index ranks the attractiveness of countries from predictive power of our index. Negative correlation
the perspective of institutional investors deciding on would mean a contradictive signal of our index while
their VC/PE allocations. The index relies on a large correlations close to 0 would indicate that our index
number of socio-economic data series which need has no predictive power.
to be available for all countries over the observation
 We determine a Pearson correlation of 0.87
period. The composite measure can deviate from
 between the VC/PE activity measure and our index
the actual risk capital market activity.
 scores. This is a notably strong result confirming the
To analyse the index’ tracking power, we compare appropriateness of the underlying data and our
the rankings with the actual VC and PE activity in index methodology. We illustrate this high
the respective countries. Therefore, we refer to the correlation in Exhibit 5.
logarithm of an average of all VC and PE
 The exhibit shows the tracking power of our index.
investments made in a certain country over the last
 We plot the countries’ investment activity on their
three years. We use logarithmic transformation to
 index scores and identify a strong link. The exhibit
account for the large activity divergence (e.g. activity
 further illustrates that we only observe VC and PE
in the US vs. several emerging countries), and we
 activity at index levels above approximately 45
refer to an average over three years to smooth
 points. For countries with scores below this level, no
annual fluctuations.
 activity is (publicly) reported. Hence, 45 points can
The statistical measure for such a comparison is the be considered a threshold for the emergence of VC
Pearson correlation coefficient which ranges and PE markets.
between -1 and 1. The closer to 1, the higher the

Exhibit 5: Tracking Power of our Index

 12
 3-Year Avg.Investment (LN USD mn)

 10

 8

 6

 4

 2

 0
 10 20 30 40 50 60 70 80 90 100
 VC/PE Index

 The Venture Capital and Private Equity Country Attractiveness Index 2021 | 20
Summary and Outlook

We provide a composite measure that determines criteria. We observe that strong investor protection
the attractiveness of 125 countries to receive capital and corporate governance rules favour deep and
allocations from investors in the VC and PE asset liquid capital markets. These elicit the required
class. The composite measure is based on six main professional community to secure deal flow and exit
criteria: economic activity, depth of the capital opportunities for VC and PE funds which affects a
markets, taxation, investor protection and corporate country’s attractiveness for institutional investments
governance, the human and social environment, in the VC and PE asset class.
and entrepreneurial culture and deal opportunities.
 However, this discussion reflects the capital supply
The definition of these criteria is based on an
 side only. We should also take into account that, as
extensive review of academic literature, on a survey
 revealed by our analyses, many countries lack
of institutional investors we conducted prior to our
 several important characteristics. Without a
study, and on our own econometric analyses. The
 sufficient entrepreneurial culture, and with rigid
six criteria are not directly observable. Therefore, we
 labour markets, bribery and corruption, there will be
use proxy variables to assess them for each
 firstly less demand for VC and PE, and secondly
country. As a result, we obtain a country ranking
 returns to investors will diminish.
and provide detailed analyses on the strengths and
weaknesses of the particular nations and Emerging VC and PE markets provide interesting
information on the historic development of the opportunities to investors. However, it is the
criteria. Our index performs well in terms of discussed lack of balance of the key driving forces
explaining the differences of observed VC and PE that renders emerging VC/PE allocation decisions
activity, and excellently tracks historic country challenging. Exceptional growth opportunities come
performance. However, it does not qualify as a at the cost of disadvantageous conditions with
crystal ball for investment advisers. We highlight our respect to investors’ protection, usually less liquid
intention to enrich the discussion regarding national exit markets, lower innovation capacity and higher
VC and PE markets and to propose a valuable perceived bribery and corruption.
informational tool, rather than an arbitrage We invite you to examine and thoroughly analyse
instrument. our results. If you are an investor, please enrich the
We find a general pattern if we compare country information provided with your own expertise and
characteristics. There is considerable dispersion knowledge about the key driving forces and market
with respect to the six key drivers. Some countries conditions in the individual countries to make your
attract investors with tax incentives. Many countries allocation decisions. If you are a politician, please
show strong entrepreneurial culture and deal use our analyses as a demonstration of how
opportunities. There is great dispersion in economic investors can evaluate and benchmark countries. If
activity, especially with respect to emerging markets you are a researcher, and this is equally valid for the
and in the human and social environment. However, whole constituency, please do not hesitate to
the two key criteria, depth of capital markets, and criticise our approach and findings. We will continue
investor protection and corporate governance make to update our index annually and very much
the difference across the large sample. Common appreciate any critique and comment.
law countries dominate the others regarding these

 The Venture Capital and Private Equity Country Attractiveness Index 2021 | 21
References

Baughn CC, Neupert KE. Culture and national conditions facilitating entrepreneurial start-ups. Journal of
 International Entrepreneurship 2003; 1; 313-330.
Black B, Gilson R. Venture Capital and the structure of capital markets: Banks versus stock markets. Journal of
 Financial Economics 1998; 47; 3; 243-277.
Blanchard OJ. The medium run. Brookings Papers on Economic Activity 1997; 2; 89-158.
Bruce D. Effects of the United States’ tax system on transition into self-employment. Labor Economics 2000; 7;
 5; 545–574.
Bruce D. Taxes and entrepreneurial endurance: Evidence from the self-employed. National Tax Journal 2002; 55;
 1; 5-24.
Bruce D, Gurley T. Taxes and entrepreneurial activity: An empirical investigation using longitudinal tax return data.
 Small Business Research Summary 2005; 252; 1-51.
Cetorelli N, Gambera M. Banking market structure, financial dependence and growth: International evidence from
 industry data. The Journal of Finance 2001; 56; 2; 617-648.
Cornelius P, Broes L, van Rossum M., Big is better: Growth and market structure in global buyouts. Journal of
 Applied Corporate Finance 2007; 19; 109–116.
Cullen JB, Gordon R H. Taxes and entrepreneurial activity: Theory and evidence for the U.S. NBER Working
 Paper 9015; 2002.
Cumming D, Dai N. Fund size, limited attention and the valuation of venture capital backed firms. Journal of
 Empirical Finance 2011; 18; 1; 2-15.
Cumming D, Fleming G, Schwienbacher A. Legality and venture capital exits. Journal of Corporate Finance 2006;
 12; 214 – 245.
Cumming D, Johan S. Regulatory harmonization and the development of private equity markets. Journal of
 Banking and Finance 2007; 31; 3218 – 3250.
Cumming D, Schmidt D, Walz U. Legality and venture capital governance around the world. Journal of Business
 Venturing (forthcoming) 2009.
Desai M, Gompers P, Lerner J. Institutions and entrepreneurial firm dynamics: Evidence from Europe. Havard
 NOM Research Paper 03-59; 2006.
Djankov S, Ganser T, McLiesh C, Ramalho R, Shleifer A. The effect of corporate taxes on investment and
 entrepreneurship. NBER Working Paper 13756; 2008.
Djankov S, La Porta R, Lopez-de-Silanes F, Shleifer A. The regulation of entry. Quarterly Journal of Economics
 2002; 117; 1; 1-37.
Djankov S, La Porta R, Lopez-de-Silanes F, Shleifer A. Courts. Quarterly Journal of Economics 2003; 118; 2;
 453-517.
Djankov S, La Porta R, Lopez-de-Silanes F, Shleifer A. The law and economics of self-dealing. NBER Working
 Paper 11883; 2005.
Garicano L. Hierarchies and the organization of knowledge in production. Journal of Political Economy 2000;
 108; 874-904.

 The Venture Capital and Private Equity Country Attractiveness Index 2021 | 22
You can also read