The way forward: an independent review of the governance and organisational capabilities of Birmingham City Council: Supporting Analysis ...
←
→
Page content transcription
If your browser does not render page correctly, please read the page content below
The way forward: an independent review of the
governance and organisational capabilities of
Birmingham City Council: Supporting Analysis

 Department for Communities and Local Government
 Strategic Analysis Team
 December 2014
Contents

Slide 3: Background

Slides 4-8: Demographics

Slide 9-11: Worklessness

Slide 12: Economy

Slide 13: Deprivation

Slide 14-16: Education and Skills

Slides 17-22: Annex: Birmingham’s Functional Economic Geography

                                                                  2
Background

• This evidence pack provides supporting analysis used in the review ‘The way
  forward: an independent review of the governance and organisational
  capabilities of Birmingham City Council.’ It contains information on the
  demographics of Birmingham and on performance across a number of
  different measures, historically and compared to other areas.

• To provide context, indicators have been compared to other areas: Leeds,
  Liverpool, Manchester, Newcastle Upon Tyne, Sheffield, and Glasgow
  City. These are referred to throughout the document as ‘comparator areas.’
  In addition, comparisons have been made with London and some London
  boroughs when looking at the age structure and ethnicity of Birmingham’s
  residents.

• It should be noted that simple comparisons between local authorities do
  not control for any potential underlying causes of differences, such as
  deprivation.
                                                                          3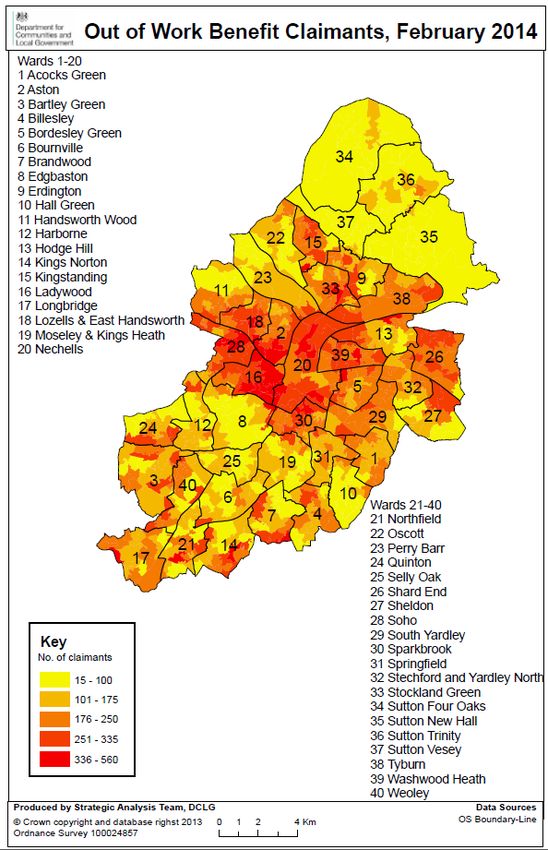
Demographics             Worklessness          Economy             Deprivation        Education & Skills     Annex

                                                               Birmingham’s population has grown by 11%
                                                                                             since 2001...
                                                     Population Trends over time (1981-2013)
1.20                                                                                                      2001-2013
                                                                  1991-2000                    Birmingham's population
                      1981-1990                      Birmingham's population fell by 2%        increased by 11% over this period
1.15      Birmingham's population fell by            over this period, whilst the Great        whilst Great Britain’s population       Great Britain
          3% over this period, whilst Great          Britain’s population increased by         increased by 9%.
          Britain’s population increased by          3%.                                                                                Manchester
1.10      2%.

1.05
                                                                                                              Leeds
                                                                                                                                   Birmingham
1.00                                                                                                                                                    Note: Population growth is shown in
                                                                                                                                                        index form, and is relative to
                                                                                                                                                        population in 1981.
0.95

0.90

0.85

0.80

0.75

                                        Birmingham           Leeds           Great Britain         Manchester                                     Source: ONS, Mid Year Population Estimates

•      Between 1981-1990 Birmingham’s population fell by 3%. Many other comparator areas also saw declines in
       their population over the same period, including Manchester (6% fall) and Leeds (2% fall). Great Britain on the
       other hand saw a 2% increase in its population.

•      Between 1991-2000 Birmingham’s population fell by 2%. In comparison, Leeds’ population increased by 1%,
       whilst Manchester’s fell by 2.5% and Great Britain’s increased by 3%.

•      From 2001-2013 Birmingham’s population increased by 11% and in 2013 the population stood at 1,092,300.                                                                    4
       In comparison, the population of Leeds grew by 7% over the same period, whilst Manchester’s grew by 22%.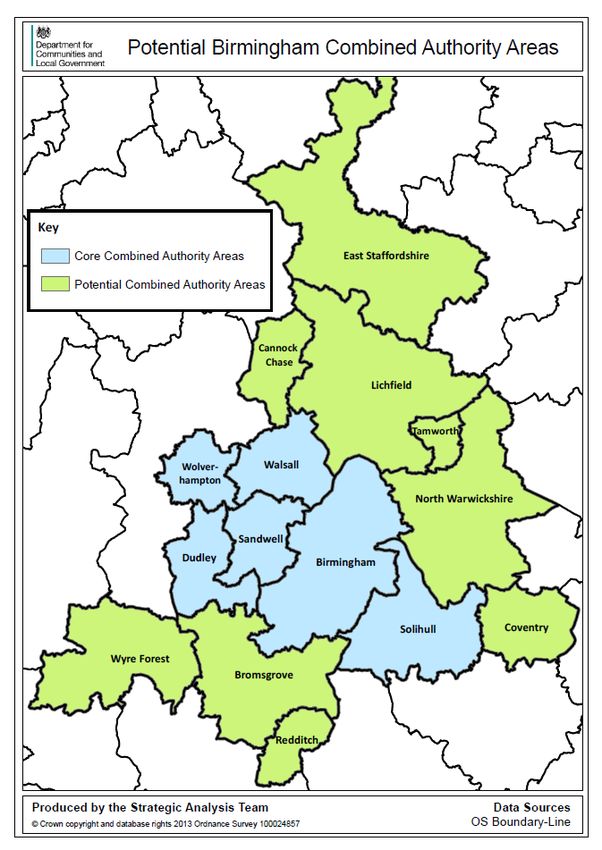
Demographics Worklessness Economy Deprivation Education & Skills Annex
…and it is expected to continue growing
strongly
• ONS forecasts that Birmingham’s population will
grow by 150,000 residents (14%) between 2011-2031.
• The wards in Birmingham with the largest expected
population growth (based on historical growth) are:
Ladywood (38%)
Soho (37%)
Washwood Heath (31%)
Nechells (30%)
• Forecasted population growth for Ladywood has been
adjusted to reflect planning permissions for residential
development. Whilst it is expected to see significant
population growth, it is unlikely to be as large as was seen
between 2001-2011.
• There is a concentration of areas around central
Birmingham that are expected to experience significant
population growth in the next 20 years.
Source: Birmingham City Council forecasts using Census 2001 & 2011 data and ONS Sub-
national population projections 5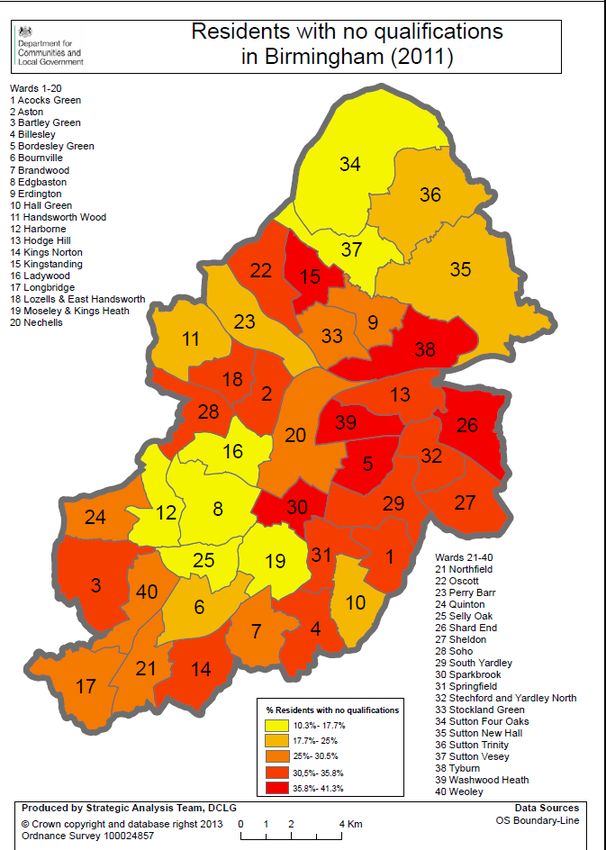
Demographics   Worklessness               Economy           Deprivation           Education & Skills          Annex

                                                                       Birmingham’s population is relatively young
                                                                                       compared to other areas...
                                                                                                                                Age Breakdown of Birmingham and comparator areas (2013)
                                                                                                            60%
                                                                                                                             46% of Birmingham's population is aged
 Detailed Age Breakdown of Birmingham and selected areas (2013)                                                              below 30 years old. Amongst comparator
                                                                                                            50%              areas, only Manchester has a higher
Aged 85 and over                                                                                                             proportion of residents aged below 30.
                           Birmingham
Aged 80 - 84 years                                                                                          40%
                               Birmingham
Aged 75 - 79 years
                                 Birmingham                                                                 30%
Aged 70 - 74 years
                                  Birmingham
Aged 65 - 69 years                                                                                          20%
                                     Birmingham
Aged 60 - 64 years
                                         Birmingham                                                         10%
                                                                                            Manchester
Aged 55 - 59 years
                                            Birmingham
Aged 50 - 54 years                                                                                          0%
                                               Birmingham                                                          Birmingham    Leeds       Sheffield   Liverpool Manchester Newcastle       Great
Aged 45 - 49 years                                                                          Great Britain                                                                     upon Tyne       Britain
                                                   Birmingham
                                                                                                                      % under 15 years old        % under 30 years old        % over 65 years old
Aged 40 - 44 years
                                                    Birmingham
                                                                                                             •      Birmingham has a relatively young population
Aged 35 - 39 years
                                                    Birmingham                              Leeds                   compared to comparator areas. 22% of
Aged 30 - 34 years
                                                         Birmingham                                                 Birmingham’s residents are aged under 15 years old
Aged 25 - 29 years                                                                                                  and 46% are aged under 30 years old.
                                                          Birmingham
                                                                                            Birmingham
Aged 20 - 24 years
                                                                 Birmingham                                  •      Amongst comparator areas, Manchester has a
Aged 15 - 19 years                                                                                                  higher proportion of residents aged below 30 years
                                                       Birmingham
Aged 10 - 14 years                                                                                                  old. Some London boroughs (Newham, Tower
                                                    Birmingham
                                                                                                                    Hamlets and Barking and Dagenham) also have a
  Aged 5 - 9 years
                                                       Birmingham                                                   similarly high share of young people.
  Aged 1 - 4 years
                                                   Birmingham
Aged under 1 year                                                                                            •      In contrast to this, Birmingham has a lower
                          Birmingham
                                                                                                                    proportion of residents aged 65 years and older
                     0%   2%        4%        6%         8%      10%     12%    14%   16%
                                                                                                                    than GB and other comparator areas (apart from
                                                                                                                    Manchester).
Source: ONS, Mid Year Population Estimates, 2013
                                                                                                                                                                                                        6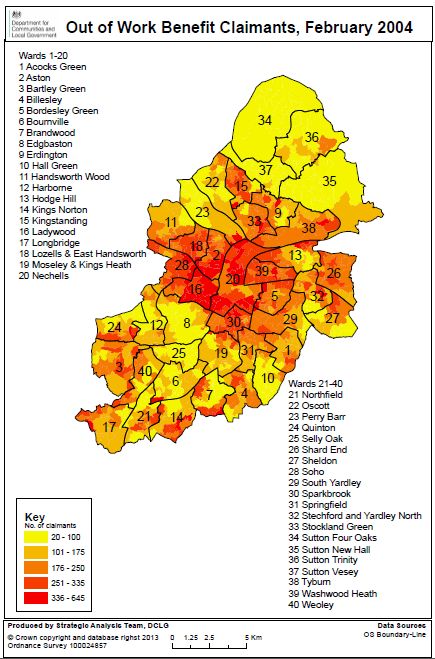
Demographics      Worklessness     Economy             Deprivation    Education & Skills    Annex

                                          ...and has become increasingly diverse…

     Ethnicity of Birmingham residents, 2001                                Ethnicity of Birmingham residents, 2011
                                                                                                                2%
                                                 White British                               9%
                        1%
              4%   6%
                                                 Other White
                                                                                  7%
     11%                                         Mixed/multiple ethnic
                                                 group
                                                 Indian

6%                                                                          13%
                                                 Pakistani
                                                                                                                     53%
    3%                        66%                Other Asian or Asian
                                                 British
                                                 Black or Black British           6%
         5%

                                                 Other ethnic group                     4%
                                                                                              5%                       Source: Census 2011
Source: Census 2001

•         The proportion of White British residents in Birmingham decreased by 13 percentage
          points (ppts) between 2001 and 2011.

•         Over the same time period, there was a 3.4 ppts increase in residents from other Asian/Asian
          British background, 2.9 ppts increase in Black or Black British residents, and 2.8 ppts increase
          in Pakistani residents.

•         After White British, the next biggest ethnic group in Birmingham is Pakistani, making up                                       7
          13% of the resident population.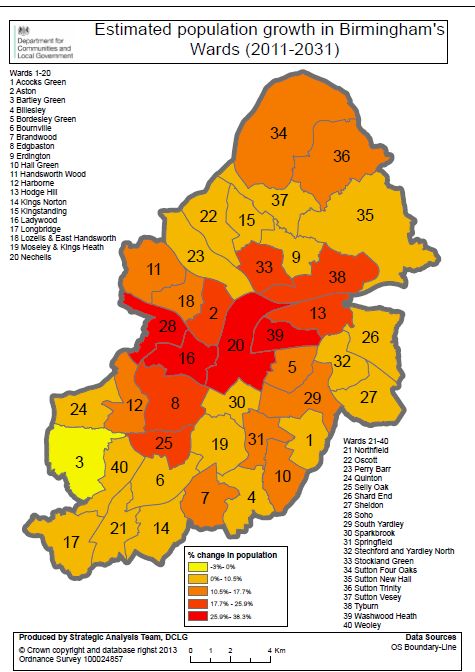
Demographics        Worklessness             Economy        Deprivation     Education & Skills   Annex

                                                      ...especially in comparison to other areas

   Ethnicity of Birmingham residents, 2011                                   Ethnicity of England residents, 2011
                    2.0%                                                                   3.1% 3.5%     1.0%
                                                                                    2.1%
                                                                           2.6%
        7.1%      9.0%
                                      White British
                                                                         2.3%                                              •      53% of Birmingham’s
                                      Other White
                                      Mixed/multiple ethnic group
                                                                                                                                  population is White
                                                                     5.7%
                                      Indian                                                                                      British, lower than the
          13.5%
                           53.1%      Pakistani                                                                                   England average (80%) and
                                      Other Asian or Asian British
                                                                                                                                  most other core cities.
                                      Black or Black British
       6.0%                                                                                              79.8%
                                      Other ethnic group
          4.4%                                                                                                             •      In this sense,
                 4.8%
                                                                                                                                  Birmingham’s population
   Ethnicity of Manchester residents, 2011                                   Ethnicity of London residents, 2011                  is more like that of
                    3.1%                                                                         3.4%                             Manchester (where 59% of
       6.3%                                                                                                                       residents are White British).
                 8.6%
                                                                                             13.3%
8.5%                                                                              9.1%                                     •      Birmingham’s population
                                                                                                                 44.9%
2.3%                               Ethnicity of Leeds residents, 2011                                                             is not as ethnically diverse
                           59.3%
   4.6%                                   3.0%
                                                 2.6% 3.4% 1.1%                                                                   as London’s, where 45% of
                                                                              2.7%       6.6%
                                   2.1%                                                                                           resident population is White
        7.3%                        2.6%                                                                                          British.
                                                                                     5.0%        14.9%
                                   4.0%

                                                                 81.1%                                                                                    8
                                                                                           Source: Census 2011
Demographics Worklessness Economy Deprivation Education & Skills Annex
Worklessness is a continuing issue for
Birmingham...
Employment rate in Birmingham and Comparator Areas (1995/96-2013/14)
85.0
Employment rate gap in 1997/1998 between
Birmingham and GB was 8.3 ppts.
80.0
75.0
Great Britain
70.0 In 2013/14 the employment
rate gap between Birmingham
and Great Britain was 11.4
65.0 ppts. This gap has narrowed
compared to 2012/13, when it
60.0 was 13.2 ppts.
Birmingham
55.0
Employment rate was at its
50.0 lowest in 2011/12 (57%). The
gap with GB was 13.2 ppts
45.0
Source: Labourforce Survey, Annual Population
Survey, 1995/96- 2013/14
Glasgow City Birmingham Glasgow City Leeds Liverpool Manchester Sheffield Great Britain
• The employment rate in Birmingham is lower than that of Great Britain, as well as other comparator areas.
In 2013/14, Birmingham’s employment rate was 60.3%, 11.4 ppts behind that of Great Britain (71.7%). This
employment gap has worsened since 1995/96, when it stood at 8.8 ppts, although it has narrowed slightly since
2012/13, when it was 13.2 ppts.
• Birmingham’s relative position compared to other areas has worsened since 1995/96, and its employment
rate is now lower than other comparator areas. Birmingham, including its surrounding primary urban area, was 9
ranked in the bottom 5 in terms of employment rate compared to other major UK cities in Centre for Cities’ ‘Cities
Outlook 2014.’Demographics Worklessness Economy Deprivation Education & Skills Annex
...with nearly 16% of working aged residents
currently claiming out of work benefits...
Proportion of out-of-work benefit claimants (2000- 2014)
35.0
• Birmingham has a higher proportion of
working age residents claiming out of
30.0 work benefits compared to Great Britain.
Peak in Feb 2010 of
18.8%, 6.1 ppts gap In Feb 2014, 15.8% of working age residents
with GB
25.0 were claiming out of work benefits in
Birmingham, compared to 10.6% in Great
20.0 Britain.
Birmingham
15.0
• The gap between Birmingham and Great
Britain has narrowed slightly since 2000,
Great Britain from 6 ppts to 5.2 ppts in Feb 2014.
10.0
• The proportion of out of work benefit
claimants is similar to that of Manchester
Birmingham Leeds Sheffield Newcastle upon Tyne (15.5%) and has followed a similar trend in
Glasgow City Liverpool Manchester Great Britain the last 8 years.
7.5% Key out-of-work benefits: consists of the following groups: job seekers,
UNEMPLOYMENT 4.0% Employment Support Allowance (ESA) and incapacity benefits, lone
parents and others on income related benefits
3.1%
10
Source: DWP Benefits/ Labourforce Survey (2000-2014)Demographics Worklessness Economy Deprivation Education & Skills Annex
…and persistent concentrations of out of
work benefit claimants in central Birmingham
• The wards with the highest
number of out of work
benefit claimants in 2014
were Sparkbrook,
Washwood Heath, Aston,
Ladywood, Soho and
Nechells.
• There has been some
persistence in terms of the
concentration of out of
work benefit claimants,
with the same wards in 2004
and 2014 having high
numbers of out of work
benefit claimants.
11
Source: DWP Benefits, Feb 2004 and Feb 2014Demographics Worklessness Economy Deprivation Education & Skills Annex
Birmingham’s economy has fared worse
than many other major areas…
.• Gross Value Added (GVA) per capita in Birmingham rose by about 12% in real terms between 1997 and 2012, compared
to UK growth of 22%. Over the same time period, most other comparator areas grew by more than Birmingham, with only
Leeds growing by less (10%).
• Between 2011 and 2012, Birmingham’s GVA per capita fell by 1.8% in real terms, compared to 0.2% fall in UK’s GVA per
capita. Over the same period, comparator areas experienced either positive or no growth.
• However, Birmingham’s GVA per capita in 2012 was still greater than most other comparator areas (and Greater
Birmingham and Solihull LEP), with the exception of Liverpool. Leeds had the lowest GVA per capita, and this has been the
case since 2001.
Workplace-based real Gross Value Added per capita (2013 prices)
GVA
£25,000 GVA is a measure of
£24,000 the value of goods and
services produced in an
£23,000 area.
UK average
£22,000 GVA per capita looks at
GVA as a proportion of
£21,000 an area’s entire
Birmingham
population (including
£20,000 economically inactive).
£19,000 It is a useful way of
comparing areas of
£18,000 different sizes.
£17,000
Leeds
£16,000
£15,000
£14,000
1997 1998 1999 2000 2001 2002 2003 2004 2005 2006 2007 2008 2009 2010 2011 2012
UK average Leeds Birmingham Liverpool Greater Manchester Sheffield Greater Birmingham and Solihull LEP 12
Source: ONS, Regional GVADemographics Worklessness Economy Deprivation Education & Skills Annex
…and Birmingham has relatively high levels of
deprivation
• Birmingham is the 9th most deprived local authority in England
according to the 2010 English Indices of Deprivation, falling from
IMD Ranking of Birmingham and comparator areas, 2011 10th in the 2007. Amongst comparator areas, only Liverpool (1st)
Local Authority Name IMD Rank of Average Score and Manchester (4th) are more deprived, whilst Leeds was the
Liverpool 1 least deprived.
Manchester 4
Birmingham 9
Newcastle upon Tyne 40
• At the neighbourhood level, 22.5% of Birmingham’s Lower
Sheffield 56 Super Output Areas (LSOAs) were in the 5% most deprived
Leeds 68 areas in England. Amongst comparator areas, Liverpool (39.5%)
and Manchester (25.5%) have a higher proportion of areas
amongst the 5% most deprived in England.
• It should be noted that the “average” figure for the city can mask
large disparities in deprivation within the city. Looking at the
neighbourhood level within Birmingham, deprivation is
concentrated in the inner city and east of the city with pockets
elsewhere.
LSOAs in the 5% most deprived in England for Birmingham and comparator areas
160 144 LSOAs in 45.0%
140 Birmingham are in the 39.5% 40.0%
5% most deprived
120 areas in England 35.0%
30.0%
100
25.5% 25.0%
80 22.5%
20.0%
60
15.6% 15.0%
14.2%
40 10.0%
9.5%
20 5.0%
0 0.0%
Birmingham Leeds District Sheffield Liverpool Manchester Newcastle
District District District District Upon Tyne
District 13
No of LSOAs in 5% most deprived % of LSOAs in 5% most deprived in England
Source: English Indices of Deprivation , 2010.Demographics Worklessness Economy Deprivation Education & Skills Annex
Birmingham fares relatively well in terms of
educational attainment and the quality of
schools...
Achievement of 5 or more A*-C grades at GCSE or equivalent,
including English and Maths • A higher proportion of students residing
65.0
Birmingham in Birmingham achieved at least 5 A*-C
60.0 grades at GCSE compared to other areas,
55.0 with nearly 60% of students achieving at least
50.0 5 GCSEs at A*-C in 2012/13. Birmingham
45.0
has been outperforming other areas since
2008/09.
40.0
35.0 • Birmingham has a higher proportion of
30.0 local authority run schools which
2007/08 2008/09 2009/10 2010/11 2011/12 2012/13 received an “Outstanding” OFSTED
Birmingham Leeds Sheffield
Manchester Liverpool Newcastle upon Tyne
rating in their most recent inspection
compared to England average and
Proportion of LA controlled schools receiving "Outstanding" OFSTED comparator areas. Nearly a quarter of local
rating in most recent inspection, June 2014
30.0% authority run schools in Birmingham were
rated as “outstanding”, compared to 18% in
25.0% England overall.
20.0%
• However, in their latest report, Ofsted have
15.0% identified that the potential for the
radicalisation of pupils and the narrowing of
10.0%
the curriculum remain key areas of concern
5.0% for Birmingham schools.
0.0% 14
England Birmingham Newcastle Leeds Liverpool Manchester Sheffield
Sources: GCSE and Equivalent Results in England, Department for Education
upon Tyne
Maintained Schools Inspections and Outcomes, OFSTEDDemographics Worklessness Economy Deprivation Education & Skills Annex
But adults lack skills - particularly at high levels…
• Birmingham has a higher proportion of
Highest level of qualification of residents aged 16+, 2011, per cent residents with no qualifications (28%) than
40% 40.0% England (22.5%). Amongst comparator areas
9,656,810 233,835 54,885 111,532 93,765 142,481 109,841 only Liverpool has a higher proportion of
30% 30.0%
residents with no qualifications (nearly 29%).
• Birmingham also has a lower proportion of
20% 20.0%
residents with level 4 or above qualifications
(23%) than England and most comparator
10% 10.0% areas. Only Liverpool has a lower proportion of
residents with level 4 or above qualifications
0% 0.0% (22%).
England Birmingham Newcastle Liverpool Manchester Leeds Sheffield
upon Tyne
No qualifications Level 1 qualifications Level 2 qualifications • Since 2001, the gap between Birmingham and
Level 3 qualifications Level 4 qualifications and above Other qualifications England in terms of proportion of residents with
Apprenticeship Dummy (for labels) no qualifications has narrowed.
Highest level of qualification of residents aged 16+, 2001, per cent
• However, the gap in terms of those with level 4
40% 40.0%
or above qualifications has widened slightly.
35% 10,251,674 252,209 62,223 121,583 96,757 160,778 119,880 35.0%
30% 30.0%
25% • Level 1= foundation GNVQ, three to four GCSEs at grades D-E,
25.0%
Business & Technology Education Council (BTEC) first certificate
20% 20.0%
• Level 2= four or five GCSEs at grades A*–C, BTEC first diploma
15% • Level 3= two or more A levels, BTEC Ordinary National Diploma
15.0%
10% 10.0%(OND), City & Guilds Advanced Craft.
• Level 4= BTEC Higher National Certificate (HNC) or Higher
5% 5.0% National Diploma (HND), or City & Guilds Full Technological
0% 0.0% Certificate / Diploma
England Birmingham Newcastle Liverpool Manchester Leeds Sheffield
upon Tyne
15
Source: Census, 2001 and 2011Demographics Worklessness Economy Deprivation Education & Skills Annex
…with particularly large concentrations of
unskilled residents in East Birmingham
• There are large concentrations of residents
with no qualifications in East Birmingham. The
wards which have particularly large numbers
include:
• Washwood Heath (41%)
• Shard End (41%)
• Kingstanding (40%)
• Bordesley Green (39%)
• Tyburn (38%)
• Sparkbrook (37%)
• All of these wards also had large concentrations of
residents with no qualifications in 2001, although
there has been some improvement since then.
16
Source: Census 2011ANNEX:
BIRMINGHAM’S FUNCTIONAL
ECONOMIC GEOGRAPHY
17Demographics Worklessness Economy Deprivation Education & Skills Annex
What is a Functional Economic Market
Area?
It is widely recognised that the economic activity does not neatly fit within the
administrative boundaries of local government. Economic flows often overlap local
authority boundaries, and at the sub-regional level one can expect to find a number of
different functional economic areas. These are known as functional economic market
areas (FEMAs).
There is no universal approach to defining FEMAs. The pattern of economic flows can
be different depending on which local markets are being considered. There is an argument
for analysing Census commuting or migration data, as the most reliable flow data, and
supplementing this with data from other key markets: such as housing markets; supply
chains in industry and commerce; and service markets for consumers.
Ideally, FEMAs would be defined on the basis of several markets or catchment areas
which best reflect the drivers of the local economy
Source: Definition taken from ‘Functional Economic Market Areas: An Economic Note’, DCLG (2010)
18Demographics Worklessness Economy Deprivation Education & Skills Annex
Travel to Work Areas
The most widely accepted approach to identifying FEMAs is by reference to
“Travel to Work Area”. This is defined so that:
At least 75 per cent of residents work within it and
75 per cent of workers live within it (known as self-containment rates).
The area must also have a working population of at least 3,500. However,
for areas with a working population in excess of 25,000, self-containment
rates as low as 66.7% are accepted.
Travel to Work Areas (TTWA) have been developed by ONS and are based
on commuter flows data from Census 2001. ONS will be updating these
TTWAs in 2015 to reflect commuter flows from 2011 Census.
There are some areas not within the Greater Birmingham and Solihull Local
Enterprise Partnership (LEP) which are in the TTWA, including parts of the Black
Country LEP and parts of Warwick District.
There are also some areas that are part of the Greater Birmingham and Solihull
LEP which aren’t in the TTWA, including large parts of Cannock Chase and East
Staffordshire.
19Demographics Worklessness Economy Deprivation Education & Skills Annex
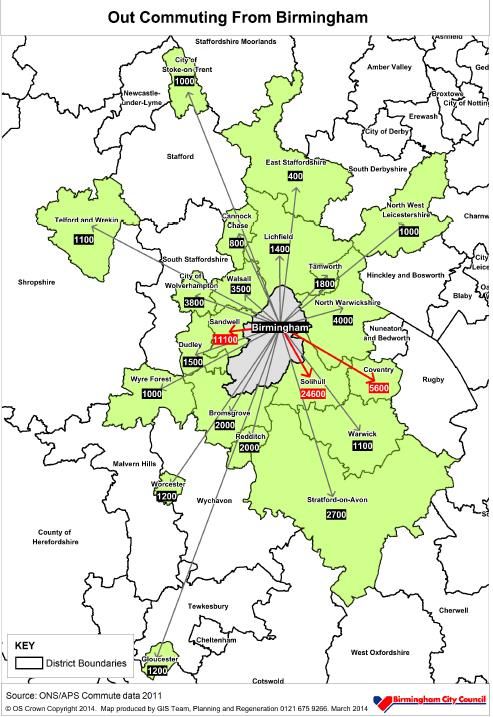
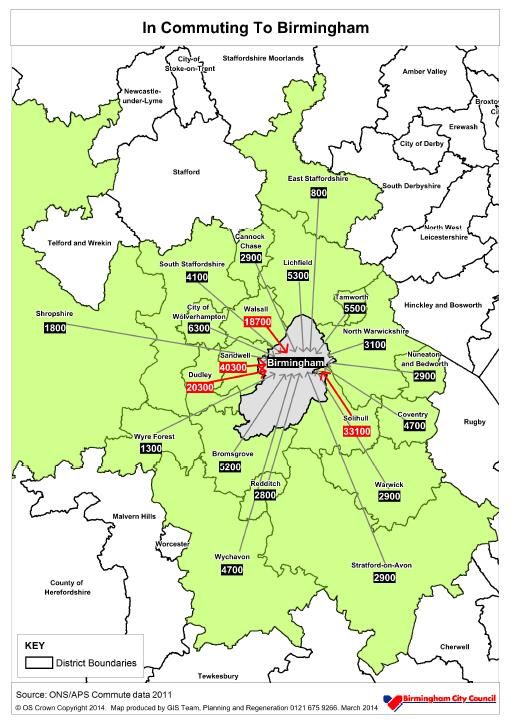
Commuter flows between Birmingham and the
Black Country
There are significant commuter
flows between Birmingham and
the Black Country local
authorities. Out of 509,000 people
commuting into Birmingham in order
to work, nearly 86,000 workers
(17%) commute in from the Black
Country LEP area. This is more
than the number people commuting
in from other parts of Greater
Birmingham and Solihull LEP
(approximately 57,000 workers).
A Combined Authority which
included Birmingham and the
Black Country would have a high
degree of self containment. 87%
of employed residents would also
be working in the area and 81% of
Source: Birmingham City Council map based on Annual Population Survey, 2011
workers would reside in the area.
Major employers in the area This exceeds the ONS thresholds
There are several major employers which are likely to account for a lot of jobs in the area
and commuter flows. Jaguar Land Rover have two manufacturing sites, both located in for TTWAs.
Solihull. Kraft Foods are located in the Bournville ward of Birmingham, and Amey and
Deutsche Bank are located in the Ladywood ward of Birmingham. 20Demographics Worklessness Economy Deprivation Education & Skills Annex
Commuter flows between Birmingham and
Solihull
• There are significant commuter flows between
Solihull and Birmingham. Over a third of
Solihull’s employed residents work in Birmingham,
and over a quarter of jobs in Solihull are currently
taken by Birmingham residents.
• Including Solihull in a combined authority area
along with Birmingham and the Black Country
would increase the degree of self containment
of the area. 89% of employed residents of the
area would also work in the area, and 84% of
workers would reside in the area.
21
Source: Annual Population Survey, 2011Demographics Worklessness Economy Deprivation Education & Skills Annex
Areas which could be included in a Combined
Authority
• A combined authority area which included
Birmingham, Solihull and the Black Country
would have a very high degree of self
containment of the area. 89% of employed
residents of the area would also work in the area,
and 84% of workers would reside in the area.
• A Combined Authority which also included
Bromsgrove, Lichfield, Tamworth, Wyre Forest,
Redditch, Cannock Chase, East Staffordshire,
North Warwickshire and Coventry would have
slightly higher degree of self containment. 90%
of employed residents of the area would also work in
the area and 87% of workers would also reside in
the area.
22Sources
• Slide 4: Population: ONS Mid Year Population Estimates
• Slide 5: Population Growth: Census of Population & ONS Sub-national Population Projections
• Slide 6: Age breakdown: ONS Mid Year Population Estimates
• Slides 7- 8: Ethnic Diversity: Census of Population
• Slide 9: Employment: Labourforce Survey & Annual Population Survey
• Slides 10-11: Out of Work Benefit Claimants: DWP Benefits
• Slide 12: Economy: ONS Regional GVA
• Slide 13: Deprivation: English Indices of Deprivation 2010
• Slide 14: Educational Attainment: GCSE and Equivalent Results in England, Department for Education
• Slide 14: OFSTED Inspections: Maintained schools inspections and outcomes, OFSTED
• Slide 14: OFSTED Inspections: OFSTED Annual Report 2013/14
• Slides15-16: Skills: Census of Population
23
• Slides 20-22: Commuter Flows: Commuting Patterns, Annual Population SurveyYou can also read