The Welfare Impact of Parallel Imports: A Structural Approach Applied to the German Market for Oral Anti-diabetics - Tomaso Duso; Annika Herr & ...
←
→
Page content transcription
If your browser does not render page correctly, please read the page content below
WP 14/09

   The Welfare Impact of Parallel Imports: A Structural
  Approach Applied to the German Market for Oral Anti-
                        diabetics

                 Tomaso Duso; Annika Herr &

                       Moritz Suppliet

                         April 2014

                                              york.ac.uk/res/herc/hedgwp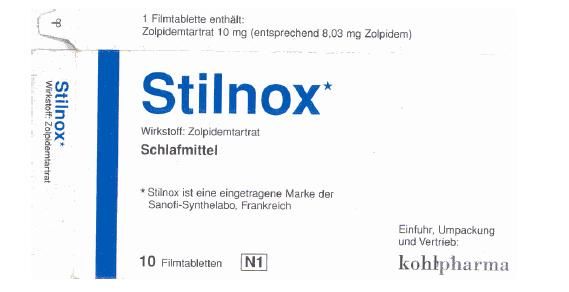
The Welfare Impact of Parallel Imports: A
   Structural Approach Applied to the German
          Market for Oral Anti-diabetics∗
         Tomaso Duso†              Annika Herr‡             Moritz Suppliet‡
                                       April 2014

         Abstract We investigate the welfare impact of parallel imports using
      a large panel data set containing monthly information on sales, ex-factory
      prices, and further product characteristics for all 700 anti-diabetic drugs
      sold in Germany between 2004 and 2010. We estimate a two-stage nested
      logit model of demand and, based on an oligopolistic model of multi-
      product firms, we then recover the marginal costs and markups. We
      finally evaluate the effect of the parallel imports’ policy by calculating
      a counter-factual scenario without parallel trade. According to our esti-
      mates, parallel imports reduce the prices for patented drugs by 11% and
      do not have a significant effect on prices for generic drugs. This amounts
      to an increase in the demand-side surplus by e19 million per year (or
      e130 million in total) which is relatively small compared to the average
      annual market size of around e227 million based on ex-factory prices. The
      variable profits for the manufacturers of original drugs from the German
      market are reduced by e18 million (or 37%) per year when parallel trade
      is allowed, yet only one third of this difference is appropriated by the
      importers.

   Keywords: parallel imports, pharmaceuticals, structural models, anti-diabetic
drugs
JEL Codes: I11, I18, L13, L51

   ∗ Our research has greatly benefited from discussions with Matteo Lippi Bruni, Daniel Cou-

blucq, Laura Grigolon, Florian Heiß, Harald Tauchmann, and Hannes Ullrich. We are also
grateful for comments from participants at the DICE Research Seminar, the European Work-
shop on Health Economics and Econometrics 2013, the workshop of the Health Economics
Committee of the German Economic Association 2013, the Conference of the German Asso-
ciation for Health Economics 2014, and the Annual MaCCI Conference 2014. Furthermore,
we thank IMS Health for providing the data. Support from the German Research Foundation
(DFG) through grant HE 6825/2-1 is gratefully acknowledged. All authors state that there
were no conflicts of interest involved in this study.
   † Deutsches Institut für Wirtschaftsforschung (DIW Berlin) and Düsseldorf Institute for

Competition Economics (DICE), Mohrenstraße 58, D-10117 Berlin, Tel: +49 30-89789-520,
Fax: +49 30-89789-103, E-mail: tduso@diw.de
   ‡ Düsseldorf Institute for Competition Economics (DICE), Heinrich-Heine-Universität, Uni-

versitätsstr. 1, D-40225 Düsseldorf; annika.herr@dice.hhu.de; moritz.suppliet@dice.hhu.de
1 Introduction
The controversial welfare effects of parallel trade in pharmaceutical markets
have been critically debated in health economics and policy (e.g., Ganslandt
and Maskus, 2004; Dutta, 2011). The core of this policy debate is the tension
between achieving price reductions that directly or indirectly benefit consumers
in the short-run and long-run incentivising innovation into new products as well
as securing the safety of drugs.
Since most drug manufacturers are active in international markets, both pro-
duction and R&D activities are typically carried out at the global level. Yet,
intellectual property rights (IPR) on active substances are generally exhausted
at the national level, which creates entry barriers across geographical (national)
markets. These barriers try to eliminate arbitrage gains, which would be possi-
ble in pharmaceuticals since the prices for the same drugs differ across countries
as a response to heterogeneous national demand and income conditions and as
a reaction to different national regulations (Kyle, 2011).
In this context, parallel imports – i.e., a drug made or sold legally in other
countries, which is imported without the permission of the intellectual property
right-holder (e.g., the patent owner) by licensed trading firms – are expected to
generate some downward pressure on price levels. In theory, the welfare effects
of parallel trade are ambiguous and depend on the differences in the national
price regulations (Bennato and Valletti, 2014; Jelovac and Bordoy, 2005), the
patients’ preferences (Jelovac and Bordoy, 2005) and the vertical integration
of the trade firms (Ganslandt and Maskus, 2007) among other reasons. If the
cross-country price differentials do not reflect true discrepancies in the efficiency
of production and they are rather the outcome of different regulatory policies,
parallel imports may lead to a price convergence that constitutes a mere wel-
fare transfer from consumers in low-price countries to consumers in high-price
countries and most likely benefits arbitrageurs (Danzon, 1998). Furthermore,
the loss in profits for patent holders may lead to decreased R&D investments
(Rey, 2003). However, even from a theoretical point of view, these mechanisms
are not unequivocally clear. Parallel imports might well have positive effects
on the innovation intensity due to the different incentives firms and regulators
face when IPRs are internationally rather than nationally exhausted (e.g., Ben-
nato and Valletti, 2014; Grossman and Lai, 2008). Hence, the assessment of
the welfare effects of parallel trade is essentially an empirical issue. To identify
causal effects, however, it is necessary to observe situations where parallel trade
is allowed.
To this aim, the process of European integration provides a great policy ex-
periment. The European Court of Justice commonly supports the community-
wide exhaustion of IPR which allows free trade within the EU and prohibits
the trade of patented products from and to non-European countries.1 Indeed,
drug trade mostly emerges from low-price countries such as Portugal, Spain, and
Greece to high-price countries such as the UK, Sweden, and Germany (Kyle,
2011; Grossman and Lai, 2008). In 2012, parallel trade amounted to about
e5.3bn in the EU and to e2.9bn (based on ex-factory prices) in Germany (Mur-
ray and Weissenfeldt, 2013). The total market shares of parallel imports ranged
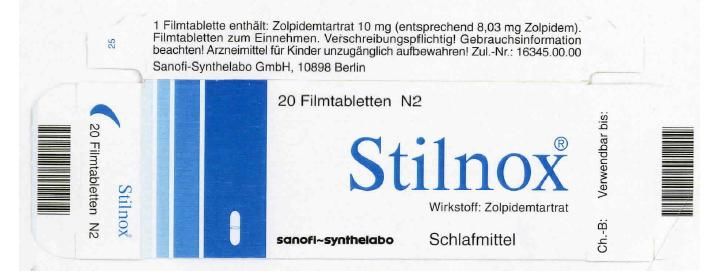
1 Parallel imported products are generally allowed in Europe and only differ in terms of
packaging or colour, as the trading firms have to add package inserts and provide labelling in
German either by a new package or by a sticker overlay. As an example, see Figures 1 and 2.
2in 2010 from 24% in Denmark, to 11% in Germany, 10% in the Netherlands,
and 7% in the UK (EFPIA, 2013). In the market for patented drugs, parallel
imports covered 25% of the sales in Germany in 2010 (Deutscher Bundestag,
2010), whereby Germany is by far the largest European market for pharmaceu-
ticals and the heaviest parallel importer in the EU (Murray and Weissenfeldt,
2013).
Our paper aims at adding to this controversial discussion by analysing the
effect of parallel trade in the German anti-diabetics market. We estimate a
structural model of demand and supply for a large panel data set containing all
oral anti-diabetic drugs sold between 2004 and 2010. We focus on this indication
for four reasons: First, changes in demographics and lifestyles made diabetes
type 2 one of the most widespread diseases in Western countries. For instance,
between 2000 and 2009 the number of German diabetes patients increased by
49% (Köster, Schubert, and Huppertz, 2012). Second, we observe the coexis-
tence of original drugs, generics, and parallel imports across the different active
substances. Third, oral anti-diabetics are prescribed exclusively for the treat-
ment of this single disease, which makes a definition of the potential market size
easier to identify. Finally, the prescription procedure for a particular drug pack-
age can be modelled more easily in this market than in other pharmaceutical
markets.
The data that we use are provided by IMS Health and entail monthly in-
formation on sales, ex-factory prices, and further product characteristics such
as package size, producer and re-seller names, and market entry. We model de-
mand through a two-stage nested logit approach (e.g., Berry, 1994; Verboven,
1996; Stern, 1996), where the upper-nest corresponds to the chemical group
(ATC4) and the lower-nest corresponds to the active substance (ATC5). This
two-level structure based on the chemical groups and active substance covers
the most relevant aspects of patient heterogeneity as well as the most relevant
decisions’ criteria of the physicians and the patients.
We build on Björnerstedt and Verboven (2012) and expand their approach to
the estimation of different price coefficients for different chemical groups (Slade,
2004).2
While own price elasticities vary across chemical groups and active sub-
stances as well as over time, we estimate a mean own-price elasticity of -6.6
and mean cross-price elasticities that range from 5.082 to 0.002. Based on an
oligopolistic model of multi-product firms, we then recover the marginal costs
and, accordingly, relative markups on prices, which range between 22% and
86% depending on the specific drug type. Using these estimated demand- and
supply-side parameters, we then simulate the new equilibrium prices, market
shares, and changes in demand-side surplus and producers’ variable profits that
would result absent parallel trade.3 According to our estimates, parallel imports
strongly decrease the average price of patented drugs by 11% while they only
imply a limited increase by 0.7% for the price of generic drugs that are sub-
2 For a general discussion on the benefits of alternative modelling alternatives for discrete
choice models of demand see also Grigolon and Verboven (2014). However, Björnerstedt and
Verboven (2012) conclude that – even in the specifically regulated pharmaceutical industry –
the nested logit model seems to be strongly supported for use in competition analysis.
3 We talk about demand-side welfare instead of consumer welfare because, given the struc-
ture of the German health care markets, this surplus is shared among the patients, physicians,
and the statutory health care system.
3ject to intense competition also without parallel imports. The overall increase
in demand-side welfare due to parallel trade is estimated to be e130 million
over seven years, which amounts to an increase by around 4% of the total de-
mand side surplus calculated in the market for oral anti-diabetics absent parallel
trade. The corresponding decrease in variable profits in Germany due to parallel
trade for the manufacturers of original drugs amounts to e125 million over the
seven sample years.4 Parallel importers only appropriate a small fraction (e41
million) of this rent.
Our study contributes to the growing empirical literature on the effects of
parallel imports on prices and welfare, whose results are still controversial.5
While some of these studies find that parallel trade achieves only limited price
reductions (e.g., Ganslandt and Maskus, 2004; Granlund and Yesim Köksal,
2011; West and Mahon, 2003), Kanavos and Vandoros (2010) even identify a
small tendency of price increases after the entry of parallel imports in six Eu-
ropean countries. Kyle (2011) explains the relative small price reductions as
the outcome of the strategic reaction of the original producer. Kanavos and
Costa-Font (2005) and Enemark, Pedersen, and Sørensen (2006) conclude that
in the early 2000s, parallel imports led to rather small cost reductions for the
German health insurances but to high losses in market shares and profits for
the original producers.6 Yet, all of these studies are mostly descriptive price or
entry regressions and/or based on reduced-form price equations, which neither
allow a careful modelling of the complex market structure nor an assessment of
the effect of parallel trade on welfare.
Hence, to make a more precise assessment of the welfare implications of
different policy interventions, our approach builds on recent developments in
the empirical health economic literature that estimates structural models of
demand and supply. The most recent studies in this strand of literature anal-
yse the market entry of generic and “me-too” drugs in the U.S. (Ching, 2010;
Branstetter, Chatterjee, and Higgins, 2011; Arcidiacono, Ellickson, Landry, and
Ridley, 2012; Bokhari and Fournier, 2013). Almost all these papers show that
the entry of generic drugs benefits consumers more than it harms the producers
by decreasing prices of the former patented drug. Furthermore, there seems to
exist substitutability not only across brand-names and generics or “me-toos” of
the same molecule but also among different molecules (Branstetter, Chatterjee,
and Higgins, 2011; Bokhari and Fournier, 2013). Since parallel imports are not
allowed and patented drugs’ prices are relatively high in the U.S., comparisons
to Europe are difficult.
Probably the papers closest to our study are those by Dutta (2011) and
Chaudhuri, Goldberg, and Jia (2006). They model the effects of stricter in-
tellectual property rights on welfare in India. Both measure substantial loss
in consumer welfare from patent enforcement and price deregulation but quite
limited gains for foreign patent holders. These results cannot be transferred di-
rectly to the European case since in the EU patent enforcement is so strict that
4 This number must be taken cautiously since our data does not contain information on
profits original producers gain by selling their drugs to parallel traders outside of Germany
(compare Subsection 3.5).
5 For an overview of studies about parallel trade see the EU Report “Competitiveness of
the EU Market and Industry for Pharmaceuticals” (European Commission, 2009).
6 In an earlier study, Kyle (2007) found fewer market entries of innovative products in
low-price countries where parallel import is allowed and concluded that parallel trade indeed
hinders innovation activities.
4cheaper copies from other producers are not available in markets for patented
drugs. Instead, parallel imports of the original drug from low-price to high-price
countries exist. Hence, our research adds to this growing literature by looking
for the first time at the welfare effect of parallel trade in the largest European
market for oral anti-diabetics. Furthermore, it constitutes the first attempt to
estimate a structural demand model for the German pharmaceutical market.
The paper is organised as follows. Section 2 describes the institutional details
of the regulations in the German drug markets and the characteristics of the
market for oral anti-diabetics. Section 3 describes our data, while Section 4 sets
up our modelling strategy. Section 5 presents the results of our estimation and
simulation. Section 6 concludes with a discussion of the results and their policy
implications.
2 Diabetes and the German market for oral anti-
diabetic drugs
Diabetes is a metabolic chronic disease in which either the body does not pro-
duce enough insulin (type 1 diabetes) or it does not respond to the insulin that
is produced (type 2 diabetes). Usually, the disease results in hyperglycaemia,
or high blood sugar, and leads to damages of the body’s systems, e.g., nerves
and blood vessels (WHO, 2013).
The causes of type 1 diabetes are unknown and the disease is unpreventable.
The treatment includes medication with insulin. We focus on type 2 diabetes
which accounts for 90% of all patients with diabetes (WHO, 2013). Type 2
diabetes differs substantially from type 1 diabetes and its causes include obesity,
tobacco use, and physical inactivity. In Germany, 6 to 7 million patients are
estimated to have suffered from type 2 diabetes in 2010 and a large number of
unknown cases is assumed. Thus, diabetes type 2 is estimated to affect around
8% of the German population (Rathmann and Tamayo, 2012).
The German market for oral anti-diabetic drugs is large. In 2010, it amounted
to about e572 million in pharmacy selling prices and e249 millions in ex-factory
prices (own calculations). The treatment of type 2 diabetes ranges from dietary
nutrition and physical activity to oral anti-diabetic drugs and, in severe cases,
insulin. Seven chemical groups of oral anti-diabetics were available between
2004 and 2010 comprising 22 active substances. The drugs either suppress glu-
cose production by the liver (biguanide), delay glucose absorption of the blood
(alpha-glucosidase inhibitors), stimulate the production of insulin (sulfonylureas,
glinides), increase the physiological function of insulin (thiazolidinediones), or
decreases blood glucose levels indirectly by increasing incretin levels (Dipeptidyl
peptidase 4 (DPP-4) inhibitors). Furthermore, a range of drugs that combine
groups of active substances (so-called combinations, e.g., biguanide and thiazo-
lidinediones) were also available in the market. Each chemical group comprises
several active substances that can be divided into either off-patent markets with
free access for generic products or markets for patented drugs with strictly regu-
lated access. However, independently of the specific regulation of reimbursement
and disposal, all firms are free to set prices.
5Cost-sharing and the distribution of parallel imports
More than 85% of the German population – around 69.8 million people – are cov-
ered by the statutory health insurance system (BMG, 2013). We only consider
this group in our analysis. These insureds face a co-payment of 10% per package
(minimum e5, maximum e10) on pharmaceutical prices for prescription drugs,
which are uniform across all German pharmacies as prices are. Moreover, most
off-patent markets are regulated by reference pricing where the patient addi-
tionally pays the positive difference of the drug’s price to the reference price,
if applicable. Thus, off-patent markets face fierce competition by generic drugs
and reference pricing (e.g., Herr and Suppliet, 2012). Rebate contracts do not
play a big role in our analysis since they only became available in 2008 and not
relevant for patented drugs or parallel imports.
In Germany, the distribution of parallel imports is supported by the regu-
lator. Pharmacists need to fulfil a specific quota: the share of total turnover
gained by parallel imports per patented active substance has to exceed 5%
(BMG, 2013).7 Furthermore, the parallel imported drug’s price has to be at
least 15% or e15 below the original product’s package price to be considered as
a parallel imported drug in the 5% quota. However, in our data, these thresh-
olds are only met by a small fraction of parallel imports and we observe both
prices below and above them.
3 Empirical Strategy
To empirically analyse the extent of competition in the German market for oral
anti-diabetic drugs, we follow the existing literature (e.g., Crawford and Shum,
2005; Dunn, 2012; Dutta, 2011; Kaiser, Mendez, Rønde, and Ullrich, 2013) and
derive a demand function from the joint utility maximization of the two main
agents – the patient and the physician – who participate in the decision process.8
In this sense, the demand-side of our model is a reduced form of a more complex
decision making structure. We approximate this process by using a two-level
nested logit model described below.
3.1 Demand Model
We observe one geographical market (Germany) over t = 1, ..., 84 months from
2004 to 2010. For each month, we calculate the potential market size, Mt , as
the number of defined daily doses (DDD) for all diabetes patients in Germany.
The potential market size is about twice as large as the actual market due to
patients that either choose a non-prescription drug or other therapies to treat
type 2 diabetes. The following specification of the demand estimation closely
follows previous work from Berry (1994); Verboven (1996), and Slade (2004).
7 Additionally,this must hold for each health insurance and quarter.
8 Potentially,pharmacists and health insurers also are involved in this decision process, yet
their influence in the determination of the demand for specific drugs is expected to be limited.
6Joint utility maximization
The I agents, i = 1, ..., I, in each market/month t choose one out of Jt products,
j = 1, ..., Jt .9 In our setting, the agent’s choice is represented by the joint
decision of the two stakeholders: the patient and the physician.
The patient first provides information on her health status and, after dis-
cussing with the physician the most suitable chemical group and active sub-
stance, she finally chooses which specific product and package to buy at the
pharmacy. We expect patients to show price-sensitive behaviour and have a
preference for drugs that are fully exempt from co-payments. We also assume
that patients respond to prices, as co-payments are a monotonic transformation
of them, but to a smaller extent than doctors given the nature of the regulatory
system and the limited amount of the co-payments.
The doctor is assumed to mostly decide in the patient’s interest with re-
spect to medical needs and other preferences, such as price sensitivity or taste.
However, physicians are also assumed to purse their own utility as they are
encouraged to consider economic aspects in their prescription behaviour even
though they are not directly punished or compensated based on their decisions.
Only if physicians exceed their individual drug budgets do they have to justify
it to their supervising organization. Still, they should prefer to prescribe less
expensive drugs such as generics (if available) to avoid audits and ease their
overall budget constraint.
The model incorporates the option that agents might decide not to buy any
drug or/and another product. This so-called outside good j = 0 extends the
choice set to Jt + 1 products. The agent i’s conditional indirect utility function
for drug j is assumed to be:
uijt = −αgj pjt + βxjt + ξjt + υijt , (1)
where pjt is the price of product j in time/market t, and xjt is the vec-
tor of other observed product characteristics, such as the active substance, the
strength, or the package size. Among these other characteristics, we also con-
sider whether the drug is exempt from co-payments. This should capture an
important aspect of the patients’ decision, i.e. the preference not to pay to get
a drug. We use a more flexible specification compared to the standard nested-
logit model and allow the price coefficients αg to depend on the characteristics
of the product, namely on the chemical groups g = 1, ..., G (Slade, 2004).10
The first reason for this modelling assumption is that we assume preferences on
9 Discrete choice models such as the nested-logit do not allow modelling of complementary
goods. In our context, this might be problematic since a mix of drugs is sometimes prescribed.
However, we specifically consider a chemical group which contains drugs combining different
groups of active substances. We are therefore able to ease the complementarity problems by
defining bundles of drugs which can be seen as substitutes to single drugs entailed in other
nests.
10 In a robustness check, we additionally insert the co-payments into this utility function to
try to better disentangle the physician’s and the patient’s utilities. Yet, this is problematic
from a theoretical viewpoint. Moreover, it would induce multicollinearity problems in almost
all ATC4 groups. In the only sensible specification, where we do not estimate group-specific
price and co-payment coefficients and after controlling for full co-payment exemption, the co-
payment variable is not significant while the price is. Therefore, it does seem that the demand
side’s price sensitivity is mostly due to the physicians’ economic incentives as well as patients’
preference for full exemption. The results are available upon request.
7prices and thus elasticities to differ by different patients’ medical needs, severity
of illness, medical history, age, etc. which is reflected by the choice of differ-
ent chemical groups. Second, this approach helps to ease the well-known issue
in logit models that elasticities –and thus markups and marginal costs c– de-
pend on products’ prices in a linear fashion (Berry, Levinsohn, and Pakes, 1995;
Nevo, 2000).11 The vector ξj t contains characteristics that are observed by the
firms, the patients, and the physicians but are unobserved by the researcher and
might include brand perception, marketing expenditures, or publicly unknown
interactions with other drugs. The random utility terms υijt reflect the influ-
ence of individual-specific taste. We assume that each agent maximises utility,
uijt , given the characteristics of the product. The mean utility of product j in
time/market t is:
δjt = −αgj pjt + βxjt + ξjt (2)
and the mean utility of the outside good j = 0 in each time/market is
normalised to zero: δ0t = 0.
Nesting structure
In the market for oral anti-diabetics, there is a natural order of choices, which
we exploit in our nesting structure. First, the physician chooses the chemical
group and second the active substance suitable to the patients’ physical condi-
tion (e.g. body weight), individual preferences, medical history, co-morbidities,
side-effects, and age. It is well understood that physicians make this choice
in a hierarchical order with respect to both across and within chemical groups
and active substances. For instance, the guidelines of the National Institute
for Health Care and Excellence in the UK clearly advise initiating oral glucose
control therapies for type 2 diabetes with metformin, followed by insulin sec-
retagogues or acarbose, then other oral agents such as exenatide, and finally
thiazolidinediones. When exactly the physician is expected to switch across
groups depends on the patient’s health status.12
Based on the specific decision structure described above, we define hierarchi-
cal nests of products by using ATC4 as the upper nest and ATC5 as the lower
nest. We believe that the nesting parameters for the groups and the subgroups
cover some of the most relevant aspects of patient heterogeneity as well as the
most relevant aspects of the physicians’ and the patients’ decisions in these mar-
kets, while the product’s continuous characteristics play a less fundamental role
(e.g., Grigolon and Verboven, 2014). They are mostly captured by the product
fixed-effects in our setting.13
11 The linear dependency results in larger elasticities for more expensive products, which is
not consistent with economic intuition.
12 For the German guidelines see http://www.deutsche-diabetes-gesellschaft.de/
fileadmin/Redakteur/Leitlinien/Evidenzbasierte_Leitlinien/EBL_Dm_Typ2_Update_
2008.pdf p. 51-53 and for UK compare e.g., http://www.nice.org.uk/nicemedia/live/
12165/44320/44320.pdf p. 13-18.
13 Since diabetes type 2 is a chronic disease, package size does not play an important role.
The active substance’s strength may be an important characteristic for the drug’s choice, but
there is not much variation within the active substances considered here. Yet, as a robustness
check, we consider the active substance’s concentration as an exogenous demand factor in the
specification where we use firm-level fixed-effects (Firm FE.IV).
8The first level of nests are G different chemical groups, g = 1, ..., G. The sec-
ond level of nests consists of Hg , h = 1, ..., Hg , different active substances within
the chemical group g. The specific composition of the nests is given in Table
1. We then apply a standard two-level nested logit model and assume a vari-
ance component error structure of the agent-specific error term, υijt . Following
Verboven (1996), we derive the estimation equation for each period t:
ln(sjt ) − ln(s0t ) = −αg pjt + βxjt + ξjt + σ1 ln(sj|hg,t ) + σ2 ln(sh|g,t ), (3)
PJ
where sjt = qjt /Mt and s0t = 1 − j=1 [qjt /Mt ] are the market shares of
drug j and of the outside good, respectively, qjt are sales in defined daily doses
[DDD] and pjt is the price per DDD in EUR in monthPt. Inner-group market
qjt
shares are defined as sj|hg,t = P qjt and sh|g,t = PG
j∈Hg
.
qjt
P
j∈Hg g=1 j∈Hg qjt
3.2 Identification
The unobserved characteristics of product j at time t are assumed to be known
to the firms, the patients, and the physicians but not to the researchers, and
they are captured by ξjt . When firms set their prices they most likely use this
information, which in turn implies that prices and inner-group market shares
are correlated with this structural error term. Thus, they are endogenous. To
partially alleviate this problem, we assume a two-way error component model
by ξjt = ξj + ξt + ωjt . We then capture part of the unobserved heterogeneity
by means of a large set of fixed-effects: the component ξj is captured by 700
product fixed-effects and ξt is captured by 84 time dummies similar to Nevo
(2001). The remaining error term ωjt is defined as a product-and-time-specific
error term.14 In our main specification, the identification condition is therefore
E[pjt |ωjt ] = 0.
This does not seem to be a particularly restrictive assumption since it is dif-
ficult to imagine systematic sources of correlation among prices and the changes
in unobserved product characteristics. Yet, in order to assess the robustness
of our findings, we adopt a second identification strategy and estimate a spec-
ification where we use firm-specific fixed-effects together with product-specific,
mostly time-invariant, characteristics and we instrument the German prices for
drug j at time t by means of the Danish prices for the same drug in the same
time period.15
This strategy also has an additional advantage. Since we use ex-factory
prices, one might claim that they are measured with error due to the existence
of rebate contracts among generic producers and health insurance companies.
This might in turn create endogeneity problems if the contracted rebates are
systematically correlated with the temporal change in unobserved characteristics
14 For a discussion of the inclusion of product fixed-effects see Dube, Chintagunta, Petrin,
Bronnenberg, Goettler, Seetharaman, Sudhir, Thomadsen, and Zhao (2002); Kaiser, Mendez,
and Rønde (2010).
15 This approach is similar to Hausman, Leonard, and Zona (1994) and Nevo (2001). It as-
sumes that prices in different geographical markets are driven by common cost drivers that are
independent of country-specific demand shocks. The prices of all authorised pharmaceutical
products marketed in Denmark are publicly available at http://medicinpriser.dk/.
9of the products (our error term). While we do not think that this should be
a major problem in our case, the IV approach would nonetheless allow us to
obtain consistent estimate.16
In our setting, inner group market shares are also potentially endogenous.
Hence, we use an instrumental variable approach to obtain unbiased estimates
for the parameters σ1 and σ2 . Following Berry (1994) and Dutta (2011) we use
nine standard instruments which account for the crowdedness in the product
space.17 The identifying assumption is therefore that the instruments, which are
correlated with the inner-group market shares and prices through the markups,
are uncorrelated with the product-specific error term.
Finally, to account for the potential serial correlation of the error terms
due to the relatively high-frequency time structure of the data, we cluster the
standard errors at the product-level.
3.3 Elasticities
We follow Berry (1994) and Verboven (1996) by calculating own-price elasticities
and cross-price elasticities that are different for drugs in the same sub-nest, Hg ,
of active substances, for drugs in the same nest, G, of chemical groups, and
for drugs in different groups. The formulas we used to compute the elasticities
can be found in the Appendix. We can compute one matrix of price elasticities
for all products sold in each month. This results in 84 (Jt × Jt ) matrices of
elasticities.
Even though the nested-logit model is restrictive in the representation of
substitution patterns within or outside groups, it is quite flexible when it comes
to the asymmetry of cross-price elasticities across products or groups as these
only depend on the structural parameters and the price and market shares of the
substitute good/group. This is particularly important in our context where the
substitution among different chemical groups is mostly hierarchical and cannot
be assumed to be symmetric.
3.4 Supply Side
In our analysis, we assume that firms in pharmaceutical markets sell a range of
differentiated products and compete in prices. Typically, differentiation in drug
markets stems from the active substance, strength, package size, and branding.
In our sample 68 firms sell 700 products either in the same or in different classes
of active substances. Hence, we assume that all these drugs (patented, imported,
16 Since first, rebate contracts in Germany only became used starting in 2008, second, they
only play a major role for generic drugs and, third, among these, only for a small fraction of
the largest companies, we do not think that measurement problems due to rebates are an issue
in our sample. Furthermore in a robustness check, we restrict our sample to the years 2004
to 2007. Coefficient estimates are quite similar, but a bit less precise than in our preferred
model. Only for two ATC4 groups (1 and 4) the price coefficients’ estimates are smaller and
not significantly different from zero since generic competition started later in these groups
(results available upon request).
17 Our instruments are: the number of different packages a firm offers per product, the
number of firms active in the product specific ATC5 group and in all other ATC5 as well as
ATC4 groups, the number of products within each chemical group (total and by firm), and
the number of products without the own firm’s products within the same active substance
and the same chemical group. All variables are inverted and log-linearised (e.g., Björnerstedt
and Verboven, 2012).
10or generic) are, to some extent, substitutes one of the other. Indeed, our demand
estimation approach enables us to recover all possible cross-price elasticities
among them. Further, we use the observed ownership structure to account for
the fact that multi-product firms internalise the competitive externalities that
each of their products exerted on the demand of their other products.
Finally, we assume that firms compete in prices. This is the standard as-
sumption made in the relevant literature (e.g., Dunn, 2012; Dutta, 2011) and
reflects the observation that pharmaceutical firms do not compete in quantities
when producing chemical drugs.18 In off-patent markets, such as metformin,
market entry is a common phenomenon and demand-side regulation supports
price competition, e.g., by reference pricing or co-payments. In markets for
patented drugs, like the one for thiazolidinediones, the patent holder is granted
a short run monopoly. However, since in our model we explicitly allow for
parallel imports and model the competition patented drugs face from similar
active substances, we believe that Bertrand-Nash behaviour with differentiated
goods is a reasonable approximation to describe the market for patented oral
anti-diabetics.
The profit functions of the multi-product firm f (f = 1, . . . , 68) active in
time/market t that manufacture a subset Ff t , of the J products is:
X
Πf t = (pjt − cjt )qjt (pt ) − Cf , (4)
j∈Ff t
where qjt (pt ) is the sold quantity of product j in time/market t as a function
of the vector of all prices, pt , here defined as qjt (pt ) = sjt ×Mt . This definition
allows us to include the market share of the outside good as well as to keep
the market size fixed in our simulation while at the same time enabling the
total quantity of products sold to increase (Nevo, 2000). We assume constant
marginal costs cjt – yet we allow them to vary over time – and we denote the
fixed costs with Cf .
Furthermore, we also assume that a Bertrand-Nash equilibrium in prices
exists and that the prices that support it are strictly positive (e.g., Nevo, 2000).
In each time/market t, the price vector, pt , has to satisfy the following Jt first-
order conditions (in matrix notation):
qt (pt ) + (ΩF
t ⊗ ∆(pt ))(pt − ct ) = 0, (5)
where qt (pt ), pt , and ct are Jt × 1 vectors of quantities, price, and marginal
costs, respectively. ΩF t is the firms’ product ownership matrix (Jt × Jt ) with
elements (ΩF t (j, k)) equal to 1 if product j and k are produced by the same
firm in time/market t, and 0 otherwise. The (Jt × Jt ) matrix of first derivatives
∆(pt ) = ∂q∂p
t (pt )
0 is multiplied element-by-element with the ownership matrix.
t
To identify the marginal cost ct , Equation (5) can be rearranged into
−1
ct = pt − (ΩF
t ⊗ ∆(pt )) qt (pt ). (6)
18 Other ways to model conduct in this market would be to assume joint profit maximization
due to collusion or a Stackelberg pricing game, where the producers of original drugs are the
price leaders and generics are the followers. However, these would be also very particular
assumptions, which had not been identified to hold in general for this market.
11Clearly, the identification and the estimation of the marginal costs rely on
our demand estimates and on the assumption of Bertrand-Nash competition.
3.5 Simulation
To quantify the welfare effects of parallel imports in Germany we compare the
status quo market with parallel imports versus a hypothetical market without
parallel imported drugs. We motivate this hypothetical situation by the fact
that firms constantly try to avoid parallel trade (Kyle, 2007), for instance by not
entering low-price countries or by offering slightly different versions (in package
size or strength) in different countries. Furthermore, as Desogus (2010) shows
discussing the Adalat Case, quantity restrictions on intra EU trade –limiting
the availability of parallel imports– have been interpreted as a unilateral con-
duct by the EU. The situation is different in the U.S., where re-imports are
prohibited mostly because of patient’s safety issues but also because they are
expected to harm innovative firms.19 Kanavos and Vandoros (2010) conclude
that "Drawing on the European evidence, [. . . ] opening the US market to paral-
lel imports will not necessarily lead to competition and enhance pharmaceutical
cost containment." Nevertheless, there is an ongoing debate in the U.S. about
disadvantages and advantages, for example by stopping illegal imports from
Canada or Mexico.
Hence, we assume that the choice set in the counterfactual situation is differ-
ent to that in the status quo. Specifically, similar to the structural models that
estimate the value of the introduction of new products (e.g., Petrin, 2002), we
define the counterfactual choice set where parallel imported drugs are excluded
as Jtsim = Jt − It , where It is the number of parallel imports in time/market t.
Accordingly, we define the Jtsim nested-logit demand functions as:
qjt (psim
t , δˆt ) = Mt · sjt (psim
t , δˆt ) · sj|hg,t (psim
t , δˆt ) · sh|g,t (psim
t , δˆt ) (7)
Similarly, the J sim first-order conditions are:
qt (psim
t , δˆt ) + (ΩF sim ˆ
t ⊗ ∆t (pt , δt ))(psim
t − cˆt ) = 0, (8)
We then determine the equilibrium simulated prices (psim t ) and simulated
quantities (qt (psim
t )) by using a Newton algorithm on Equations (7) and (8).
With the new simulated equilibrium (psim t and qt (p sim
t )) and the estimated
structural parameter (δˆt and σ̂) we calculate the demand-side surplus (e.g.,
Dutta, 2011):20
g X Hg (1−σ̂1 )
1 X
DS(psim
t )= M ln(1 + ( (1−σ̂2 ) (1−σ̂2 )
Dh|g, ) ), (9)
α̂g g=1 h=1
19 Golec and Vernon (2006) show that U.S. firms are more profitable, earn higher stock
returns, and spend more on research and development (R&D) than manufacturers in the EU.
20 The demand-side surplus corresponds to the typical consumer surplus calculated for a
nested logit model. As we mentioned above, since only a part of this surplus goes directly to
the consumers, we prefer to use the notation demand-side surplus.
12
                       X           δjt
    where Dh|g,t   =        exp           and the firms’ variable profits are:
                                 1 − σ1
                     jt∈h|g
                                     X
                      V P (psim
                             t  )=       (psim              sim
                                           jt − ĉjt )qjt (pt   )              (10)
                                       j∈Ff t

   We finally compare them with the status quo welfare measures calculated
by using the observed instead of the simulated prices and quantities.

4     Data
Our data set contains monthly sales and prices of all oral anti-diabetic drugs sold
in Germany between January 2004 and December 2010. Price and sales data are
available at the package level and at the level of defined daily doses (DDD)21 ,
thus allowing us to compare products with different active substances and pre-
sentations. Each of the drugs is characterised by the name, active substance,
company name (either producer or parallel importer), package size, strength, de-
fined daily dosages, and an indication if the drug was exempt from co-payments.
All data were provided by IMS Health, a private marketing consulting firm, and
extracted from their database Pharmascope National which is restricted to the
German Statutory Health Insurance (SHI) market (IMS Health, 2012).
    The strength, or concentration, varies considerably by active substances (in
total from 0.5 mg to 1000g), which motivates the use of DDD as the basic
metrics. The ex-factory prices per daily dose range from e0.01 to e0.27 and
reflect the fact that some products are sold in markets for patented drugs while
others are sold in off-patent markets.
    To calculate the size of the potential market, Mt , we collect epidemiological
data about the number of patients with diabetes in Germany from the German
Diabetes Association (DDG, 2011; Giani, Janka, Hauner, Standl, Schiel, Neu,
Rathmann, and Rosenbauer, 2004; Hauner, Köster, and Schubert, 2007). An-
nual information about diabetes patients are transformed into monthly values
using average growth rates. For example, in 2010 about 8.4 million patients
had a monthly demand of about 250 million DDD of anti-diabetic drugs. We
estimate our demand specification with the two- and threefold quantity of sold
DDD as a robustness check and yield very similar results.
    To ensure homogeneous market conditions, we only include in our sample
products that are covered by the German SHI. A complete classification of
the drugs analysed in this study is given in Table 1 in the Appendix. In our
estimations, we only include packages with a market share within the subgroup
of active substances (ATC 5) larger than 0.1%.22 Furthermore, we exclude the
chemical substance exenatide due to its sub-dermal administration (pens, 158
obs.) and 83 observations of retard tablets (belonging to gliclacides). Finally,
we also exclude DPP-4 inhibators (287 observations) and the combination of
one of them (sitagliptin) with metformin (116 obs.) as well as glimepiride &
pioglitazone and gliquidone since they form a special group of late innovations
  21 The WHO Collaborating Centre for Drug Statistics Methodology in Oslo provides a list

of DDD for each active substance on a yearly basis.
  22 The preferred demand model leads to similar results when excluding all drugs with an

overall market share below 0.001% or not excluding by market shares at all. However, it
proved very difficult to correctly simulate very small market shares. The reduced sample still
covers 92% of the market in terms of sales in 2006.

                                                13
with very high prices, which would constitute an extreme outlier not suitable
for estimating a general model for the entire market (compare Table 1 in the
Appendix).23
Table 2 in the Appendix gives an overview of the 24,603 observations in-
cluded in the final estimation by firm type (originator drug manufacturer, par-
allel importer or generic manufacturer) and chemical group. We observe quite
heterogeneous competitive conditions across groups as the biguanides and sul-
fonylurea groups face severe generic competition while the other groups are
much smaller and under patent protection, so that the competitive constraints
are mainly those imposed by parallel imported drugs or potential market entry
by innovations.
Table 3 reports the descriptive statistics for the most important variables
used in this study, including the different prices, the overall market shares (sjt ),
the market shares of the products within the inner nest (sjt |h) as well as the
market shares of the inner nests within the outer nest (sht |g). The variables
are presented by firm type. In our preferred specification we control for the
patients’ preference not to pay for the chosen drugs. This is captured through
the dummy co-payment exemption that takes on the value of 1 if drugs are fully
exempt from co-payments. This happens when their price undercuts a certain
threshold, which is set at 70% of the reference price. In our sample, it only
occurs in one of the ATC4 groups (sulfonylurea).24 Prices, sales per product,
as well as market shares vary considerably across manufacturer types. In the
lowest part of the table, we report the number of firms and products within
groups and sub-groups, which are used to construct the instrumental variables
for the inner-group market shares.
[Table 3 about here]
5 Results
5.1 Demand-side Estimation
Table 4 displays the results of the two-level nested logit demand estimation
presented in Equation (3). In the first two columns, we present the results for
the specification that only includes product fixed-effects [FE], the following two
columns then report the instrumental variables estimation that accounts for the
potential endogeneity of the inner group market shares [FE.IV]. Finally, model
[Firm FE.IV] presents the results obtained including firm-effects and product
characteristics (rather than product-specific fixed-effects) and instrumenting the
prices by means of the Danish prices. The coefficients σ1 and σ2 measure the
correlation of agents’ preferences within the nests of active substances and chem-
ical groups, respectively, and the six price coefficients [αg ] represent the average
effect of the price on the market shares for each of the chemical groups. In
23 The demand estimation does yield similar results when not excluding this group but,
again, it proved very difficult to predict the market shares and prices of such an extreme
outlier using our average coefficient estimates.
24 Specifically, only 3,766 among the 10,504 observations in the ATC4 group sulfonylurea
correspond to co-payment exempt drugs. Some drugs change status (from non-exempt to
exempt and vice versa) across the sample periods which allows us to identify the effect of the
co-payment exemption in our regressions with product-specific fixed-effects.
14all specifications, all parameters (except of one) are significant and have the
expected signs.
[Table 4 about here]
As conjectured, the mean utility positively and significantly depends on the
co-payment exemption which therefore confirms the importance to control for
patients’ preferences. Moreover, both coefficients measuring the correlation of
preferences within the two nests [σ1 and σ2 ] are consistent with random utility
theory (0 ≤ σ2 ≤ σ1 ≤ 1) across all three models. They are considerably smaller
after controlling for possible endogeneity, as expected. Model Firm FE.IV addi-
tionally shows that the demand significantly increases if the drug stems from the
originator manufacturer or a parallel importer as opposed to the generic man-
ufacturer, capturing the preference for branded products. Furthermore, above
average strength is negatively associated with the market share.
From here on we focus on our preferred specification [FE.IV]. The six price
coefficients are negative and statistically significant from zero. The coefficients
cannot be interpreted as marginal effects but they show that substitution indeed
differs by chemical group: group 2 represents an off-patent market with several
generic competitors which results in a price coefficient of −4.2 and group 4
represents a market with patented active substances and a considerably lower
price coefficient of −0.5.
For a clear interpretation of these estimates in terms of substitution patterns,
we then need to calculate elasticities. The mean value of own- and cross-price
elasticities of all products across all months are presented in Table 5. The own
price elasticities vary considerably across groups (-37 to -1, mean: -6.65), while
the average cross-price elasticity within the same nest of active substances (0.45)
is larger than within the upper nest of the respective chemical group (0.26) and
indicates a strong substitution among products in similar nests. The mean
cross-price elasticity for products outside the chemical group is small (0.004
on average) and reflects the low substitutability among drugs from different
chemical groups. The high correlation among preferences for drugs of the same
chemical group is reasonable and reflects the fact that the grouped active sub-
stances differ only slightly in their molecule structure, which allows patients to
easily substitute among them. The even larger correlation among drugs con-
taining the same active substance might be driven by the same reasoning. Here,
the drugs differ only in strength, dosage form, manufacturer, colour, package
size, etc. Furthermore, it is a common finding in the literature that patients
tend to substitute toward similar drugs, (e.g., Ellison, Cockburn, Griliches, and
Hausman, 1997; Dutta, 2011).
[Table 5 about here]
We can now use Equation (6) to retrieve the marginal costs and the corre-
sponding markups for each of the 84 sample months. Table 6 presents marginal
costs and markups as a mean percentage over all drugs across all time periods.
On average, marginal costs are 33% of prices and tend to be higher for patented
drugs and lower for generic products. This result, which is mostly driven by
the chosen nested logit demand model to estimate elasticities, is a bit surprising
as marginal costs are reported to be low in the pharmaceutical industry. A
possible explanation is that high marginal costs for patented drugs reflect that
15innovative firms utilise more sophisticated production technology than generic
companies. The reported marginal costs might also partially reflect investments
in research and development that are not captured by fixed costs.
[Table 6 about here]
The variation of margins and markups over time is also presented in Figure 3
aggregated at the year level to smooth out short term volatility. Marginal costs
for all firms’ types (original producers, importers, and generic manufacturers)
seem to be quite constant over time. Interestingly, however, markups seem to
substantially vary over time with a very striking decreasing trend of the mean
value for manufacturers of original drugs. We interpret this finding as the result
of the increasing overall availability of low-priced generic products as well as
parallel import competition.
[ Figure 3: Marginal costs and markups over time about here]
5.2 Simulation
The final step of our empirical analysis consists of simulating the new equilib-
rium in prices and quantities that one would observe, had parallel imports not
been allowed. By comparing this counterfactual scenario to the status quo prices
and corresponding demand-side surplus and variable profits, we can estimate the
value of parallel imports.
Table 7 shows the estimated changes in prices (mean) and quantities (total)
due to the existence of parallel imports over all 84 months in our sample. Prices
of originator drugs decrease on average by ca. 11% and prices of generic drugs
increase on average by only 0.7% due to parallel trade in the German market
for oral anti-diabetics. The overall average price in the market increases by ca.
10% because of the existence of parallel imports, which are more expensive drugs
with respect to generics. Hence since the entire price distribution changes, one
cannot make a clear comparison with respect to the situation without parallel
trade. In order to do that, we also report the average price of original drugs
and generics excluding parallel imports. Clearly, this average price decreases as
a consequence of increased competition. Moreover, we observe an expansion of
demand by 2.7% due to the introduction of new goods through parallel trade.
Specifically, the reduction of over 218 million DDD generics (-0.5%) and over
7 million DDD original drugs (-2.5%) is overcompensated by the sales of 428
million DDD of parallel imports.
[Table 7 about here]
We then calculate the change in demand-side surplus and variable profits
generated by the introduction of parallel trade, which are shown in Table 8.
The change in demand-side surplus amounts to about e130 million in total
(3.7% of the level without parallel trade) or ca. e19 million per year. These
figures do not seem to be particularly large in comparison to the average annual
market size of e227 million based on ex-factory prices.
[Table 8 about here]
16The average demand-side effect comes mostly from the lower price level for
original drugs, but is also strongly influenced by the demand expansion as well
as the behaviour of the marginal consumer. First, the prices of original drugs
are lower and, second, some patients substitute away from original products to
parallel imports, which are even cheaper. However, these positive demand-side
effects are partially outset by a decrease in demand-side surplus from generics.
The price reduction for these drugs is minimal and several patients substitute
away from the cheaper generic drugs to the more expensive parallel imports.
These patterns are confirmed when we look at how the change in demand-side
surplus breaks down among the different chemical groups.25 Large gains from
parallel trade are observed in those chemical groups where generic competition
is not severe, while surplus losses are measured in the biguanides (metformin)
and sulfonylurea groups, where several generic products are sold. A side remark
on this result is that, apparently, competition by generics does indeed work.
When we look at the time evolution in Figure 4, we also observe some variation
in the changes of demand-side surplus over time. Specifically, we observe a
substantial jump in the change in demand-side surplus created by parallel trade
after 2007.26
[ Figure 4: Demand-side surplus over time about here]
The final step of our welfare analysis regards the gains and losses for man-
ufacturers. Since we do not have a measure of fixed costs, we only analyse the
effect of parallel trade on variable profits realised in Germany and hence mea-
sure an upper bound to the possible decrease in the incentive to invest in R&D
for originators. On average, as shown in the lower part of Table 8, variable
profits decrease by about e102 million over the seven sample years. This figure
is mostly determined by the severe decrease in variable profits for the manufac-
turers of original drugs by e125 million (not taking into account sales in foreign
countries, which would be (re-)imported).27 Only a small part of these lost prof-
its, e41 million, is transferred to parallel importers. Furthermore, producers of
generic drugs face a reduction of their variable profits by about e18 million.
Unfortunately, we cannot derive a complete welfare analysis absent a reason-
able measure of fixed costs as well as the profit effects of parallel trade in other
countries where firms active in Germany also operate. Moreover, our results
are clearly affected by the existence of other extensive demand-side and price
regulations that affect health care markets in Germany and might eventually
reduce the ability of parallel trade to exert effective competitive pressure on
25 Please notice that the sum of the levels and differences of demand-side surplus across
drugs types are not equal to the total. This is due to the fact that the demand-side surplus
is calculated as a non-linear function of the mean utilites according to equation (9).
26 We also compared the mean co-payment with and without parallel trade. Since we neither
observe reference prices or contracted rebates for the two ATC4 groups with generic compe-
tition nor the exemption for specific individuals, this average co-payment potentially entails
some measurement error. For the entire sample, the mean co-payments are on average around
2% lower in our simulated data (e5.46) than in our observed data (e5.56). This reflects the
same logit as discussed above and it is driven by the fact that the price of parallel imports is
higher than the price of generics. While the co-payments for generics are very similar in the
two scenarios, the co-payments for original products are almost 50 EUR cents per package
lower due to parallel trade.
27 Notice, however, that parallel trade most likely increase the profits of these multi-national
firms due to the increased sales of their products to parallel importers in other countries.
17You can also read