The World Trade Organization at 25 - Assessing the Economic Value of the Rules Based Global Trading System - Bertelsmann Stiftung
←
→
Page content transcription
If your browser does not render page correctly, please read the page content below

The World Trade Organization
 at 25
Assessing the Economic Value of the Rules Based Global
 Trading System
The World Trade Organization at 25
 Assessing the Economic Value of the Rules Based
 Global Trading System

 Authors:

 Prof. Gabriel Felbermayr, PhD

 Prof. Dr. Mario Larch

 Prof. Yoto V. Yotov, PhD

 Prof. Dr. Erdal Yalcin

Contact

Dr Christian Bluth
Project Manager
Global Economic Dynamics
Bertelsmann Stiftung
Phone +495241 81-81329
Mobile +49173 73 42 656
Fax +495241 81-681329
christian.bluth@bertelsmann-stiftung.de
www.bertelsmann-stiftung.de

Cover: Christian Bluth
2019

The WTO at 25
Assessing the Economic Value of the Rules Based Global Trading System

A Study on Behalf of the Bertelsmann Stiftung

Final Report – November 2019

Authors:

Prof. Gabriel Felbermayr, Phd.
Prof. Dr. Mario Larch
Prof. Yoto V. Yotov, Phd.
Prof. Dr. Erdal Yalcin
Content
Table of Figures ....................................................................................................................................... II
List of Tables ............................................................................................................................................ II
Main Findings of the Study..................................................................................................................... III
1. Introduction ..................................................................................................................................... 1
2. The emergence of the GATT and WTO. A short overview. ............................................................. 4
3. The evolution of trade across the world between 1950 and 2016. ................................................ 8
 3.1 Global Trade Patterns in Light of GATT/WTO ......................................................................... 8
 3.2 Observed trade patterns in light of GATT- and WTO-membership ...................................... 11
 3.3 Tariffs in Light of the GATT and WTO .................................................................................... 15
4. A causal Analysis of Whether and How much GATT- and WTO-Membership Promote Bilateral
Trade...................................................................................................................................................... 18
 4.1 Estimating the Impact of GATT/WTO .......................................................................................... 18
 4.2 Partial Equilibrium Estimates of the impact of GATT/WTO ........................................................ 20
5. Specific Trade and Welfare Effects for GATT/WTO-Members ...................................................... 28
6. Challenges ahead........................................................................................................................... 36
7. Conclusion ..................................................................................................................................... 40
Literature ............................................................................................................................................... 41
Appendix................................................................................................................................................ 44

 I
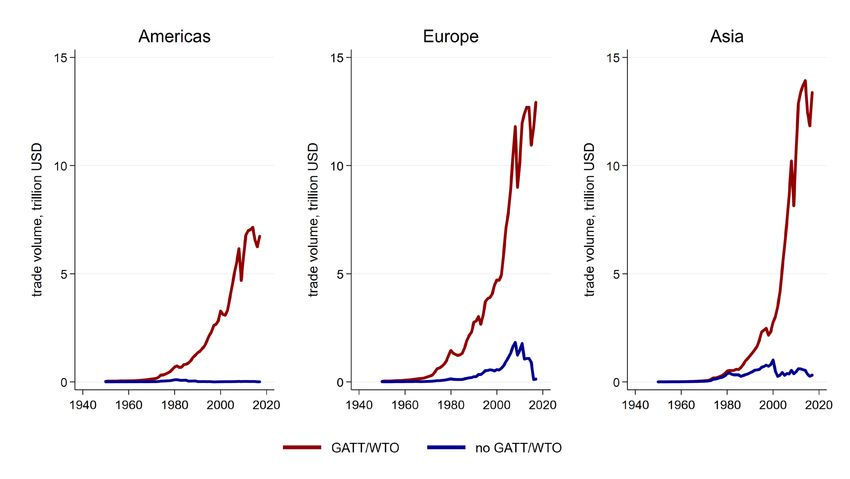
Table of Figures
Figure 1: The evolution of average tariffs in the last century ................................................................. 5
Figure 2: Development of GATT/WTO membership and trade volume ................................................. 5
Figure 3: World Trade Openness over Time 1950-2014 ......................................................................... 6
Figure 4: Average growth rates of world trade volume, in % ................................................................. 7
Figure 5: Accession dates of GATT/WTO members ................................................................................ 7
Figure 6: Trade volume over time by region and GATT/WTO membership ........................................... 8
Figure 7: Trade share by GATT/WTO membership and regions ............................................................. 9
Figure 8: Trade volume by country and membership for selected years ............................................. 10
Figure 9: Share of GATT/WTO members vs. non-members in world trade volume over time............. 11
Figure 10: Average annual change in trade before and after GATT/WTO accession, by region........... 12
Figure 11: Average annual change in trade before and after GATT/WTO accession, by income-level 13
Figure 12: Average annual change in trade before and after GATT/WTO accession, by country ........ 14
Figure 13: Average tariffs of GATT/WTO-members over time, MFN=most favoured nation tariff rate,
bound=bound tariff rate........................................................................................................................ 15
Figure 14: Mean most favoured nation tariff rates by country for selected years ............................... 16
Figure 15: Country-specific Structural Gravity Estimates of the Effects of WTO. ................................. 23
Figure 16: Country-specific Structural Gravity Estimates of the Effects of WTO. No outliers .............. 24
Figure 17: Country-specific Structural Gravity Estimates of the Effects of WTO .................................. 26
Figure 18: On the importance intra-national trade flows and controlling for globalization................. 28
Figure 19: Plot of welfare changes against change in trade costs for main results .............................. 35

List of Tables
Table 1: Structural Gravity Estimates of the Effects of WTO ................................................................ 21
Table 2: Welfare and Trade Effects ...................................................................................................... 30

 II
Main Findings of the Study
The creation and expansion of the multilateral trading system has come along with strong growth in
trade. After the creation of the General Agreement on Tariffs and Trade (GATT) in 1948, the volume of
global trade grew on average by around 8 percent per year. After the crisis of 1974, trade growth slowed
down. When the WTO entered into function, growth accelerated again to about 6 percent per year from
1994 to 2008. Between 1995 and 2008, the volume of world trade increased by 125 percent.

These growth rates are impressive. But so is the growth history of the world economy after World War
II. However, trade growth outpaced the expansion of GDP. World trade openness (measured as the ratio
of world exports over world GDP in current prices) went up from around 5 percent in 1950 to 14 percent
in 1994, the year before the creation of the World Trade Organisation (WTO). In the succeeding years,
it went up another 8 percentage points to 22 percent in 2008. Since then, the ratio has moved sideways.

Average tariffs in GATT/WTO-member states were significantly reduced over the past decades. Most
favoured nation tariffs (MFN tariffs) were reduced on average by about nine percentage points from
1988 to 2016 starting at a level of 17 percent being lowered to about 8 percent in 2016. Similarly, bound
tariff rates were reduced by about 8 percentage points from 40 to 32 percent. These figures indicate a
successful reduction of customs duties within the rules based trading system in the post World War II
decades.

A comparison of how trade volumes in countries emerged before and after accession to the GATT or
WTO clearly shows, that for a large majority of the considered countries trade increased significantly
and continuously after membership in the GATT and WTO.

Base on a structural gravity model and by accounting for internal- as well as international trade flows,
the study quantifies partial, country-specific GATT/WTO effects for the exports of each GATT/WTO
member country to its fellow GATT/WTO members to be heterogeneous but positive for the majority
of the considered countries. The identified positive trade effects are in contrast to many previous
findings and are crucially driven by the inclusion of internal trade flows, as they allow capturing diversion
from domestic sales.

Based on the empirically identified estimates (considered period: 1980 -2016), a counterfactual analysis
(based on 2016) finds the following welfare and trade effects of the GATT and WTO membership:
member countries gained in terms of welfare on average 4.37 percent, with a huge variation from -1.78
percent to 27 percent. Welfare falls on average by -0.96 percent for non-GATT/WTO members.

On average, GATT/WTO members total nominal exports increase about 14 percent, while total nominal
exports decrease on average by 5.5 percent for non-members.

 III
IV
1. Introduction
Before World War II was over, politicians of the allied nations came together in the US town of Bretton
Woods, New Hampshire, to carve out a new world economic order. The conference was successful in
creating international institutions for monetary policy and finance, the International Monetary Fund and
the World Bank. In December 1945, the US invited its war-time allies to start negotiations on the
creation of a similar international institution to govern international trade.

The logic for binding international rules and for a body of governance was compelling. During the Great
Depression, after the US had enacted the so called Smooth-Haley tariffs, the world was drawn into the
“Kindleberger Spiral”: an accelerating escalation of tariffs and counter-tariffs and a dramatic collapse of
world trade from 5.3 bn USD in January 1929 to 1.8 bn USD in January 1933. 1 Average tariffs moved to
about 50 percent (Bagwell and Staiger, 2002). Economic historians generally believe that the trade war
has not caused the Great Depression but had made it deeper and longer (Irvine, 2011). Moreover, it
clearly fostered wide-spread political mistrust and a more general breakdown of international
cooperation, ultimately leading to the catastrophe of World War II.

Under the helm of the United Nations and under the intellectual leadership of John Maynard Keynes,
work on a charter started and advanced. In March 1948, the Havana Charter was signed by 56 countries.
It set out basic rules for international trade and contained provisions against anti-competitive business
practices. It designed two new institutions: the International Trade Organization (ITO) and the
International Clearing Union (ICU). The latter had the purpose to minimize international trade
imbalances by requiring both surplus and deficit countries to “net zero”. This was to be accomplished
by a system of penalties and an overdraft facility. At the same time, twenty-three countries, including
the US, had negotiated a General Agreement on Tariffs and Trade (GATT), and in 1947, eight of those
countries (the US, UK, Canada, Australia, France and the BENELUX-countries) sighed the “Protocol of
Provisional Application of the GATT”.

However, the Havana Charter never entered into force: somewhat paradoxically, it was the US, the
initiator of the negotiations, who, in 1950, announced that it would not ratify the text. At the time, the
argument was that the ITO would limit national economic sovereignty too much. Quite interestingly,
the discussion in the late 1940s bears resemblance to debates today, which also stress legal overreach
by international institutions and stress economic sovereignty of nations. A second effort, from1954 to
1955, to establish an Organization for Trade Cooperation, again hit opposition by the US.

In the meantime, GATT had already held three successful rounds of tariff reductions. Being the only
available framework the GATT gradually became a de facto international institution despite its
provisions character. It turned into the focal point of international governmental cooperation on trade
matters. In seven rounds of tariff reductions, and applied to an ever increasing number of members,
the GATT became an effective and successful engine for trade liberalization in the “free world”, the non-
communist allies of the US. When the old systems competition ended with the demise of the Soviet
Union, the eighth round, the Uruguay Round, gave birth to the World Trade Organization (WTO).

The WTO, which entered into existence on January 1 of 1995, adopted the GATT and was charged with
administering and extending the rules-based international trading system. Its objectives are to foster
transparency and predictability, to keep political opportunism at bay, and to enforce the rules.

The WTO fulfills its role with a very small budget and staff: it employs about 650 experts and runs on a
budget of about 200 Million Swiss Francs – tiny fractions of the operating budgets of the IMF or the

1
 Kindleberger (1973).
 1
World Bank. It is a member-driven organization in that new initiatives have to be initiated by members,
not the directorate general, and it relies on members to supply it with trade policy information and data.
It is a central forum for the negotiation of trade policy, for implementation and surveillance, for the
development of capabilities (trade capacity) in poor countries, and – very importantly – for the
settlement of trade disputes. It is this last role of the WTO that lifts it above the GATT and which endows
it with a modicum of independence; a fact that has attracted criticism, in particular but not only by the
US.

GATT/WTO membership should affect trade in various ways. Most obviously, when a negotiation round
is successfully concluded or when a new country enters the WTO, tariffs are reduced. This should
increase trade. With trade elasticities estimated to lie between 3 and 5 at the aggregate level, a one
percentage point decrease in tariffs drives up trade by 3 to 5 percent. More importantly, when a country
becomes a member of the multilateral system, it binds its tariffs, that is, it cannot increase them at will
above the bound level. This reduces uncertainty and has been shown to matter more for trade than
tariffs themselves (Dutt et al., 2011). Through its dispute settlement function, the WTO further reduces
trade policy uncertainty which should also stimulate trade flows.

GATT/WTO membership also reduces non-tariff trade barriers (NBS) by disciplining their use, ruling out
the most egregious cases and increasing transparency. Over the various rounds, the system reduced
quantitative restrictions and replaced them by tariffs, less detrimental tools of trade policy. Moreover,
the WTO works with poorer countries to enable them to meet standards and abide by necessary
international processes.

By the above mentioned initiatives, GATT/WTO helps bringing down trade costs. However, its
prohibition of export subsidies effectively increases the costs of foreign market participation to
exporters, thereby adding to the earlier mentioned positive effects a possibly trade-reducing effect. On
average, one should not expect this effect to dominate, but it can play a role in highly subsidized sectors
or countries.

As we will illustrate in this study, during the years of the GATT, the number of signatory countries
multiplied from a mere 23 to 128. Members cut their tariffs on industrial products during the first rounds
(1948-62) by an average 36 percent, an average 37 percent in the Kennedy Round (1964-67), an average
33 percent in the Tokyo Round (1973-79), and an average 38 percent in the Uruguay Round (1986-94).
According to data from Federico and Teno (2016), the trade openness of the world (measured as the
ratio of world exports over world GDP in current prices) increased from a mere 5 percent to 14 percent
in 1994, the year before the creation of the WTO. From then, it went up another 8 percentage points
to 22 percent in 2008. Since then, the ratio has moved sideways.

Looking at trade volumes (in constant prices), from 1980 to 1994, according to WTO data, world trade
went up by 81 percent. With the creation of the WTO, the rules-based system was extended to include
services, intellectual property, and dispute settlement. World trade growth accelerated: from 1994 to
2008, the volume of world trade increased by 125 percent.

This is a great success story. However, it begs two important questions. First: To what extent is the
expansion of world trade causally due to the creation, gradual expansion and deepening of the
GATT/WTO-system? The problem, of course, is that, following the Bretton Woods Conference, the world
has seen a large number of other developments that were hugely beneficial for trade – the peaceful
global environment led by the US, enormous unilateral improvements in economic governance and in
all sorts of infrastructure, and important technological improvements such as the containerization of
world trade and the collapse of international communication costs through the arrival of the internet.

 2
This study employs state-of-the-art econometrics on a very broad and long panel of trade data to filter
out the causal effect of the GATT/WTO. The methodology has to overcome several issues. Amongst
other things, it must make sure to account for as many determinants of trade other than GATT/WTO
membership as possible. Moreover, it is important to use all possible margins of comparison including
between intra- versus international trade flows. The former are not directly impacted by the multilateral
system while the latter are. Additionally, taking into account intra-national trade flows allows capturing
diversion from domestic sales to international trade. Moreover, the econometric analysis must deal with
the fact that countries joining the global system are not randomly selected, and it must be amenable to
an analysis that allows calculating the effects of GATT/WTO membership on GDP. Exploiting variation in
the data across 37 years and 218 countries, the econometric model finds sizeable positive trade effects:
on average, GATT/WTO membership leads to a direct (partial equilibrium) increase in exports by 25
percent.

These direct effects need to be supplemented by indirect (general equilibrium) effects. This overturns
some of the negative partial/direct effects found in the econometric analysis. Overall, GATT/WTO
membership increases real GDP (welfare) by about 4.37 percent. There is some evidence that, when
new countries join, countries remaining outside the system lose slightly due to trade diversion.
However, they also benefit from price effects: a more efficient global trade system tends to benefit all
countries through lower import prices.

The second question is: if the GATT/WTO-system has causally led to increased trade, how exactly has
this beneficial outcome materialize? This is not a trivial question, because the international system has
no real means to enforce its rules but relies on continued self-interest of members. Indeed, it is very
important to understand the roots of the success of the world trade order from 1948 to, say, 2008, to
understand the challenges the system is facing today. Classical trade theory stresses the importance of
external effects: when a country unilaterally gives up its tariffs, it is harmed by a deterioration of its
terms-of-trade: the relative price of exports to imports goes up as relative demand for the imported
good surges. Countries are, therefore, hesitant to give up tariffs unless other countries reciprocate,
which approximately restores terms-of-trade.

However, this requires trust, which is hard to sustain. The problem is that countries have unilateral
incentives to deviate from free trade: by doing so, they can improve their terms-of-trade as relative
demand for imports and, hence, their relative price goes down. Trade partners anticipate this and are
therefore reluctant to expose themselves. This is a classical prisoners’ dilemma, well-known from game
theory, and well-studied in a large literature.

Repeated interaction under a commonly respected protocol can, however, break the deadlock and bring
about a stable cooperative equilibrium. Bagwell and Staiger (2002, 2016) have shown that the
GATT/WTO system with its core principles of reciprocity and non-discrimination (national treatment,
most-favored nation rule) is well-endowed to achieve this objective. 2

Under these principles, simple tit-for-tat can induce cooperation: when a country deviates from the
cooperative equilibrium, the other WTO members are allowed to withdraw concessions (i.e., retaliate)
in a proportionate, well-understand way. The credible threat of such action can be enough to keep

2
 Ossa (2011) extends this view and introduces countries’ incentives to induce firm relocation from trade
partners by imposing tariffs. This mechanism is very similar to the Bagwell-Staiger one. Other authors have
stressed the importance of domestic commitment problems and how external (trade) agreements can solve
them (Maggi and Rodriguez-Clare, 1997).

 3
countries cooperating. Ossa (2011) extends this argument to a situation where countries compete for
firms.

Currently, the world trade order is under stress. There are number of important points of criticism. The
two major ones relate to content and form: (i) Since its creation in 1995, the WTO has not been able to
fundamentally modernize its set of rules despite massive changes in the structure of the world economy,
in particular the rise of countries (such as China) who many view as non-market economies. Moreover,
it has not been able to push through another round of trade liberalization to deal with issues such as
data or “unfair” trading practices. (ii) Possibly because of (i), some WTO member countries have
increasingly relied on its judicial role to address "creative ambiguity" in legal documents for which the
Appellate Body has been criticized and accused of overstepping its mandate. For this reason, the US’
has resisted confirming the nomination of judges to the appellate body, paralyzing the arbitration role
of the WTO.

Because of (i), essentially all countries have increasingly resorted to preferential trade agreements,
which, in principle at least, violate the core tenet of the multilateral order: non-discrimination, as
enshrined in Articles I and III of the GATT. By awarding preferences to some partners while denying
them to others, bilateral trade agreements undermine the WTO: a larger share of world trade does not
rely anymore on multilateral rules, weakening support for the institution. It is well possible that large
regional deals may actually invigorate the multilateral system by providing a testing ground for new
rules, but this is not automatic. Moreover, bilateralism endangers another implicit principle of the
multilateral system: the containment of brute power to the advantage of negotiated outcomes.

The study is structured as follows: Before moving to a descriptive analysis, chapter 2 casts a short history
of the multilateral system. Chapter 3 presents a first glance at the data, showing cursory evidence of
the GATT/WTO in boosting trade. The core of the study, Chapter 4 presents the results of the
econometric analysis. Chapter 5 moves to a general equilibrium perspective, simulating trade and real
GDP effects based on the estimates from Chapter 4. Chapter 6 discusses some of the key challenges the
multilateral system is currently facing. Chapter 7 concludes.

2. The emergence of the GATT and WTO. A short overview.
The General Agreement on Trade and Tariffs (GATT) entered into force in 1948 with eighteen member
states. The agreement was setup alongside the so-called Bretton Woods institutions, the World Bank
and the International Monetary Fund. Decades prior to Bretton Woods were characterized by economic
conflicts and trade wars ending in a global war. Restrictions on international trade and beggar-thy-
neighbour policies had deepened the reach of the Great Depression in the 1930s, imposing huge
economic and social costs on societies. Figure 1 illustrates the evolution of average tariffs over a long
period covering the years before and after the GATT initiation for France, the United Kingdom, and the
US. Average tariffs were steadily declining before the Second World War, however, just within a couple
of years politicians were able to raise trade barriers to levels experienced almost hundred years earlier.

A main objective of the GATT was to avert this sort of destructive impediments to international trade
that led to a global war in the years before the initiation of the trade accord.

 4
Figure 1: The evolution of average tariffs in the last century

Source: Fouquin et Hugot (2016)

Since then the number of members has greatly expanded. When the GATT was institutionalized in the
World Trade Organization (WTO) in 1995, the number had risen to 127 member states. Additionally,
while in the early years the GATT represented primarily a club of mostly industrialized countries, over
the years members gradually started to reflect the different regions and income levels across the world
more broadly. Today, 164 countries are members of the WTO. At the same time as the number of
members rises continuously, the nominal trade volume of GATT/WTO members skyrockets while the
total trade volume accounted for by non-GATT/WTO members increases only moderately (Figure 2).

Figure 2: Development of GATT/WTO membership and trade volume

Source: WTO, DOTS, WDI
 5
Since its inception, the GATT expanded not only in its geographic scope but also deepened in its
coverage of world trade as well as agreement coverage. In several negotiation rounds, members agreed
not only to reduce tariffs and quotas. They also considerably liberalized world trade by agreeing on the
reduction of non-tariff barriers to trade in recent decades.

As illustrated in Figure 3, the trade openness of the world (measured as the ratio of world exports over
world GDP in current prices) increased from a mere 5 percent to 14 percent in 1994, the year before
the creation of the WTO. In the succeeding years, this measure went up by another 8 percentage points
to 22 percent in 2008. Since then, the ratio has moved sideways.

Figure 3: World Trade Openness over Time 1950-2014

 25%

 20%

 15%

 10%

 5%

 0%
 1950
 1953
 1956
 1959
 1962
 1965
 1968
 1971
 1974
 1977
 1980
 1983
 1986
 1989
 1992
 1995
 1998
 2001
 2004
 2007
 2010
 2013

Source: Federico and Tena (2016).
Note: World Trade Openness is defined as the ratio of world exports and world GDP, both measured in current prices.

Figure 4 shows how trade volumes (in constant prices) developed on average over different periods.
From 1980 to 1994, according to WTO data, world trade went up by 81 percent 3. With the creation of
the WTO, the rules-based system was extended to include services, intellectual property, and dispute
settlement. In this period, world trade growth accelerated: from 1994 to 2008, the volume of world
trade increased by 125 percent. 4

3
 Calculated as 1.043114 -1=0.805.
4
 Calculated as 1.059914-1=1.25.
 6
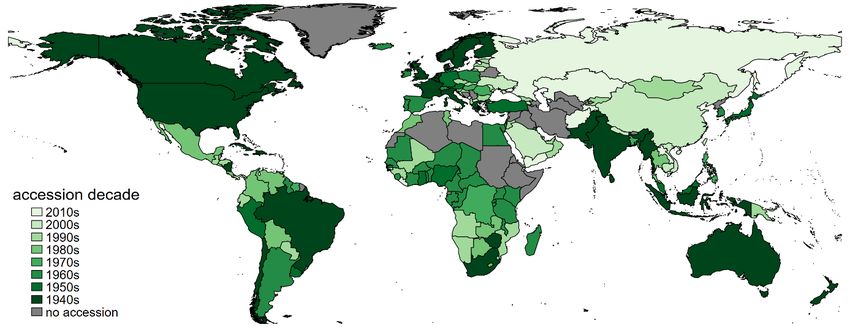
Figure 4: Average growth rates of world trade volume, in %

 8.08

 5.99

 4.31
 3.96

 2.4

 1950-73 1973-1980 1980-1994 1994-2008 2008-2018

Source: Federico and Tena (2016) and WTO data, own illustration and calculations.
Note: The diagram shows annualized growth rates of deflated global merchandize trade.

Finally, Figure 5 presents an overview of who entered the GATT/WTO in which decade. Clearly, the GATT
and later the WTO have expanded much over time. When the GATT was signed in 1948, countries from
mostly North America and Europe as well as Australia, Japan, Brazil, India, South Africa and some others
were the founding members. Over time, more and more countries joined from Asia (e.g. Indonesia),
Africa (e.g. Liberia), and South America (e.g. Peru). In recent decades, China and Russia as well as some
Middle Eastern countries (e.g. Jordan) joined the project. To date, few countries remain non-members.
They are mostly located in the Middle East and in North and East Africa.

Figure 5: Accession dates of GATT/WTO members

Source: WTO.

 7
3. The evolution of trade across the world between 1950 and 2016. 5

3.1 Global Trade Patterns in Light of GATT/WTO

Figure 6 compares the emergence of trade for different GATT- and WTO-members with non-member
states within the Americas, Europe and Asia (a list of countries for each region can be found in the
Appendix). Across all considered regions, clearly, the amount of trade impressively increased over the
years among GATT- and WTO-members. A first strong acceleration of trade is observed in the 1970s
pushing import and export volumes above 1 trillion US-Dollars. The increasing cross border commerce
was slightly slower in Asia during those years in comparison with Europe and the Americas. However, in
the following years, particularly after 2001, with China’s membership in the WTO, trade in the region
reached a level of over 10 trillion USD in only one decade. Equally, European WTO members experience
a second strong increase in cross border trade, also reaching a total trade volume significantly above 10
trillion USD after 2001. Similarly, GATT/WTO-members of the Americas experienced an increase in
international trade following the year 2000; however, the volume of trade in that region crossed a level
of 5 trillion USD that is significantly below the European and Asian trade volumes.

 Figure 6: Trade volume over time by region and GATT/WTO membership

 Source: DOTS, WTO.

Figure 7 quantifies for five different regions the share of total trade (imports and exports with the world)
that can be traced back to each region’s GATT/WTO-member countries for the years 1950 and 2017.
Accordingly, in 1950 for example, around 30 percent of Africa’s trade with the world resulted from
GATT/WTO-members while 70 percent of the continent’s trade with the world stemmed from non-
GATT/WTO members. Along with the increasing number of countries, joining the GATT and later the
WTO, in 2017 more than 80 percent of Africa’s trade with the world can be traced back to the
continent’s GATT/WTO member states. Similar developments are observed for Asia, Latin America and
Europe.

5
 We are grateful to Moritz Goldbeck for excellent research assistance.
 8
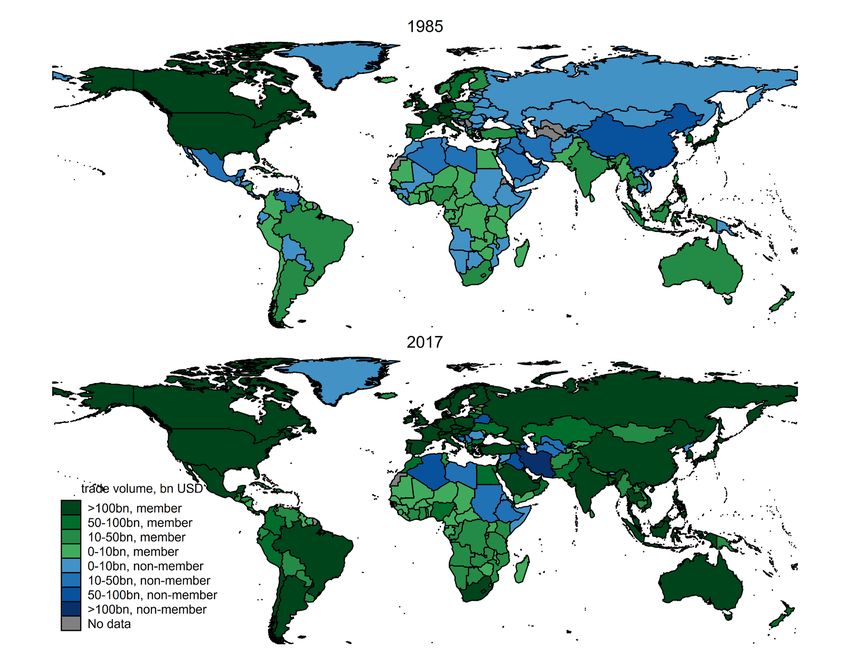
Figure 7: Trade share by GATT/WTO membership and regions

 Source: DOTS, WTO.
 Note: A list of countries for each presented region is available in the Appendix.

However, in the former three regions, in 2017 nearly all trade with the world is attributable to WTO
member states. In case of North America, represented by Canada and the USA, the region’s total trade
with the world always stemmed from GATT/WTO-member state because Canada and the USA are
founding members of GATT.

While Figure 6 visualizes the different dynamics of how the volume of trade among GATT/WTO-member
states evolved across different regions, Figure 7 illustrates the growing share of trade across different
regions that has increasingly been shaped by GATT- and WTO-members.

Figure 8 goes one step further and shows world maps for the years 1985 and 2017, respectively,
depicting the trade volume of countries in these years as well as their membership status in the GATT
and WTO. The two maps illustrate how the global rules-based trading system emerged over the years
starting with a small number of member states in the 1950, pushed forward by the US as the most active
trading nation in those post world war years. Already, in 1985 just a few years before the iron curtain’s
fall Europe and a large share of the African nations have become members of the GATT. Equally, most
of the Southeast-Asian countries have become members of the rules-based world trade order. As the
map of 1985 illustrates, among the GATT-members, EU countries, particularly, France, Germany, United
Kingdom, and Italy, belonged in that year to the most active trading countries besides the US and
Canada. Among the non-GATT-members, China and some oil and gas exporting countries like Saudi
Arabia, or Libya showed some higher trade activities than other non-member-states.

 9
Figure 8: Trade volume by country and membership for selected years

Source: DOTS, WTO.

The pattern of trade across GATT/WTO-members and non-members changes again significantly in 2017.
In this most recent year for which data are available, a large share of the countries in the world are part
of the WTO. Moreover, it is no longer only a small number of countries that show a high level of trade.
In the contrary, for many WTO-members trade reaches a level above 100 billion US-Dollars per year.
Two groups of countries stand out in Figure 8. There are still a small number of resource exporting
nations such as Algeria, Iran or Libya that are not members of the WTO. Moreover, most of the central
African countries show a relatively small annual trade volume in contrast to more advanced economies
in the remaining regions of the world.

Figure 9 extends the comparison of cross-border trade between GATT/WTO-members and non-member
states, by depicting the evolution of total trade within these two groups. In 1948, when the GATT was
initiated, member states already made up around 70 percent of world trade. This share in global trade
steadily increased over the following years along the rise in GATT- and WTO-member states. Today,
almost 95 percent of merchandise trade is taking place under the umbrella of the WTO rules.

 10
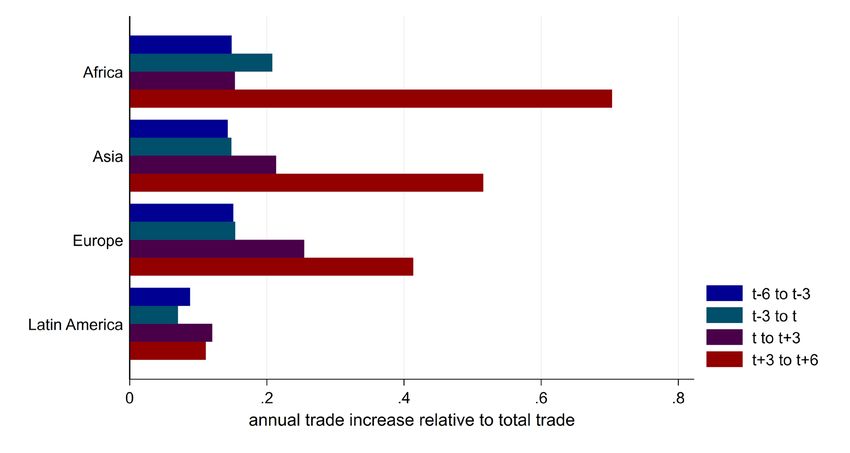
Figure 9: Share of GATT/WTO members vs. non-members in world trade volume over time

Source: DOTS, WTO.

3.2 Observed trade patterns in light of GATT- and WTO-membership

The previous graphs illustrate a steady increase in cross-border trade along the growing number of
GATT- and WTO-members in the world. However, the figures do not indicate in how far a country has
benefited from a GATT- or WTO-membership by increasing its cross-border commerce in merchandise
trade. This section presents additional descriptive statistics to address the question of whether
membership in the GATT or the WTO resulted in larger cross-border trade.

To analyse the development of trade patterns when a country joins the GATT/WTO we compare the
average growth in trade before and after accession to the global trading system. Because countries tend
to increase trade already before a final ratification of international trade accords (compare Egger et. al
2011) we quantify how trade develops six years before and after a country joint the GATT and WTO.
Moreover, we split the pre- and post-accession years into two periods (3-year windows). This allows us
to visualize potential dynamics in both the pre- and post-accession period. Moreover, with the chosen
6-year windows before and after a GATT/WTO membership we cover a sufficiently long time window to
account for potential anticipation effects that my result in higher trade flows before accession.

The chosen procedure comes with some statistical costs. For several large economies, it is not possible
to quantify this GATT/WTO trade-effect due to their early membership in the agreements and the
missing availability of trade data for early years.

Figure 10 presents the results of such a simple statistical comparison for several world regions. The first
blue bar (t-6 to t-3) measures the average growth in total trade across all countries for a specific region
over three years relative to the region’s total trade. In case of Europe e.g., in the two pre-accession
periods (t-6 to t-3) and (t-3 to t-0) European countries experienced an average annual increase in trade
by 17 percent. In contrast to the two pre-accession period, European countries experience on average
 11
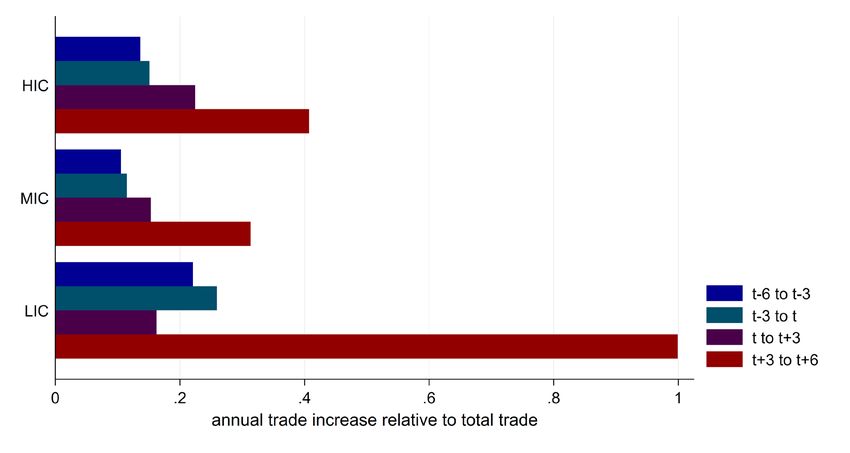
significantly higher annual increases in international trade after becoming a GATT- or WTO-member. In
the first three years after accession, member states experienced on average a rise in trade by 23
percent. This growth rate turns out to be significantly larger in the second post-accession period,
reaching an average annual rate of 40 percent over the three considered years. Overall, compared to
the pre-accession period (6 to 0 years before membership), all considered countries experience on
average a significantly higher annual increases in international trade after the accession period. Except
for Latin America, in all other regions average growth in trade increases significantly stronger in the
second post-accession period covering the years 3 to 6 after GATT- or WTO-accession.

Figure 10: Average annual change in trade before and after GATT/WTO accession, by region

Source: DOTS, WTO.
Note: A list of countries for each presented region is available in the Appendix.

Figure 11 illustrates the same quantitative analysis as in Figure 10, but this time for countries grouped
by income levels. Based on the World Bank Group income classification we account for high-income
(HIC), middle-income (MIC) and low-income (LIC) countries. As in the previous regional analysis,
countries experience on average a significant increase in international trade after becoming a GATT- or
WTO-member. This pattern appears across all three income groups, although with some differences. In
case of high- and middle-income countries, international trade steadily increases after GATT- and WTO-
accession. In case of low-income countries, average annual growth in trade turns out to be smaller in
the first post-accession period (t to t+3) than in the pre-accession periods. However, annual trade
increases on average very strongly in the second period reaching levels of up to 100 percent. These high
average growth rates in trade can be explained by countries such as Burundi exhibiting basically no trade
before becoming a GATT-member.

 12
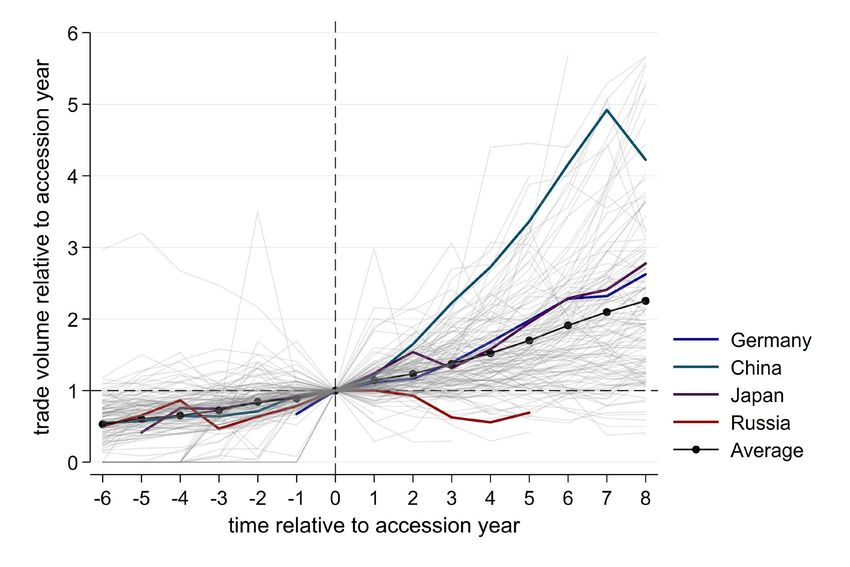
Figure 11: Average annual change in trade before and after GATT/WTO accession, by income-level

Source: DOTS, WTO.
Note: A list of countries for each presented group is available in the Appendix.

Finally, in Figure 12 we present the evolution of trade in each GATT- and WTO-country for 8 years prior
to and 8 years post GATT- and WTO-membership, where the data allows such an analysis. The figure
quantifies how trade in each listed year has changed in the pre- and post-accession period relative to
the country specific accession year. Therefore, in the accession year (t=0), the observed change in each
country is equal to zero indicated by an index value 1. Larger index values indicate a relative higher trade
in the specific year relative to a country’s accession year amounting to the according index value, while
smaller numbers appear if trade in a specific year turns out to be smaller than in the accession year.

Figure 12 visualizes that for the majority of all GATT and WTO member states total trade with the world
has increase. The average change of total trade relative to each countries accession year trade volume
is positive and increases continuously over the years after GATT- and WTO-membership (black dotted
line). At the same time, we highlight some countries with above and below average index values. In case
of China, for example, total trade with the world relative to the accession year increased significantly
faster than in most other member states. Just within three years after its WTO-membership, China
experienced a doubling of total trade. Japan and Germany also experienced a relative strong increase
in total trade during the post accession period, although not to the same extent as China. On the other
hand, the case of Russia illustrates that GATT- or WTO-members can experience a drop in total trade.
Five years after WTO membership Russia was still trading less with the world compared to accession
year. 6

Table A1 in the Appendix lists each GATT/WTO country’s specific total trade over the pre- and post-
accession years.

6
 It is worth mentioning that Russia became a WTO member in 2012, just two years before the annexation of
Crimea and the succeeding economic sanctions.
 13
Figure 12: Average annual change in trade before and after GATT/WTO accession, by country

Source: DOTS, WTO.

It is important to emphasize here, that these figures indicate a trade boosting effect once a country
becomes a member in the GATT or WTO. However, the descriptive effects cannot be interpreted as a
causal relationship because many further aspects such as domestic industrial developments or
population growth could drive these patterns. For this reason, we challenge these trade-enhancing
effects of a GATT- and WTO-membership by extended the analysis with more advanced empirical
methods in chapter 4.

 14
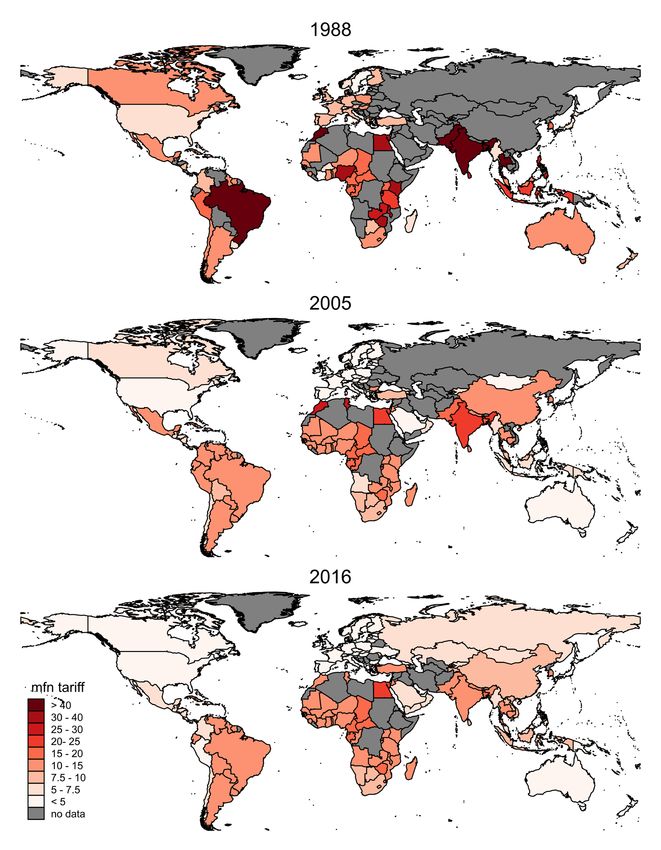
3.3 Tariffs in Light of the GATT and WTO

An important aim of the GATT/WTO has been to allow traded goods to face less trade barriers when
crossing borders. Historically, customs duties represented the main source of trade impeding policy
instruments, also referred to as tariffs. Unfortunately, a comprehensive analysis of how tariffs evolved
over the past decades is only possible for the years starting in 1988, if one intends to account for the
whole word.

Within the GATT and the WTO two types of tariffs are of main interest, most favoured nation tariffs
(MFN tariffs) and bound tariffs: MFN tariffs are customs duties that countries promise to impose on
imports from other WTO-member states, unless the country is part of a preferential trade agreement
(e.g. such as a free trade agreement or a customs union). Hence, in practice, MFN rates represent the
highest and most restrictive level of tariff that WTO-members charge on one another. In contrast to
MFN tariffs, bound tariffs are commitments made by individual WTO-member governments. A bound
tariff represents the maximum MFN tariff level for a given commodity line. When countries join the
WTO or when WTO members negotiate tariff levels with each other during new trade rounds, they make
agreements about bound tariff rates, rather than actually applied MFN tariff rates.

As can be seen in Figure 13, average tariffs in GATT/WTO-member states were reduced significantly
over the past decades. MFN tariffs were reduced on average by about nine percentage points from 1988
to 2016 starting at a level of 17 percent being lowered to about 8 percent in 2016. Similarly, bound tariff
rates were reduced by about 8 percentage points from 40 to 32 percent. These aggregated tariff
measures also illustrate that alongside a continuous decline in applied MFN tariffs, member states in
the WTO have maintained on average still relatively high bound tariffs, albeit on a lower level than in
the past, which gives the countries a policy space to increase MFN tariffs in the future.

Figure 13: Average tariffs of GATT/WTO-members over time, MFN=most favoured nation tariff rate, bound=bound tariff rate

 Source: IMF IDB, WTO.

 15
Figure 14 maps the average MFN tariff rates for each country in selected years. Several important
developments can be derived from these figures. First, although tariffs have been on the decline over
the years, average MFN tariffs turn out to be highly heterogeneous across countries.

Figure 14: Mean most favoured nation tariff rates by country for selected years

Source: IMF IDB.

While most of the high-income countries as e.g. the USA or the EU exhibit average MFN tariffs below 5
percent, at the same time emerging economies such as Brazil or China still show average applied tariffs
reaching 15 percent.
 16
At the same time, tariffs across the fast growing emerging economies e.g. like China, India and Brazil
decreased their MFN tariffs significantly over the years. However, the extent of tariff reduction turns
out to be slower in some regions, as e.g. in case of South America or India.

Less developed countries, particularly member states in Africa turn out to have the highest average
tariffs among WTO members. Moreover, in the past decade African countries did not reduce average
MFN tariffs by a significant amount.

Finally, there are some country, e.g. Turkey, which have utilized the tariff policy space resulting from
the difference between bound and applied tariffs, to increase MFN tariffs. However, the number of
countries increasing average MFN tariff rates within the multilateral trading system remains very small.

Overall, the descriptive analyses in this chapter illustrates that along the growing number of GATT- and
WTO-member states, over the years global trade protection in the form of tariffs has been on the
decline. At the same time, the evolution of trade across the member countries has been steadily
increasing across the world, even though with a strong heterogeneity across countries.

These findings point on a positive and trade supporting effect of the multilateral rules-based trading
system that has been continuously established in the post-World-War II period. At the same time, there
is a growing academic literature in international economics discussing the trade supporting effect of the
GATT and WTO. A review of the contradicting literature reveals that there has been an intense debate
on this issue over more than a decade. A recent overview of the relevant publication can be found in
Esteve‑Perez et al. (2019). A sizeable number of researchers conclude that unlike regional trade
agreements or currency unions, membership in the GATT or the WTO has not resulted in positive trade
effects. At the same time, other empirical analyses conclude that a GATT or WTO accession leads to a
rise in exports for most of the member states.
In turns out that the chosen empirical methodology is crucial for whether GATT and WTO membership
is identified as export supporting.

In the next chapter, we extend our analysis by applying advanced empirical methods to analyse in how
fare the GATT- and WTO- membership have supported global trade. The chosen empirical methodology
accounts for the most recent insights in light of the previously mentioned controversial findings in the
relevant literature. Moreover, we continue the analysis by welfare and trade effects resulting from an
increasingly liberalized world trade.

 17
4. A causal Analysis of Whether and How much GATT- and WTO-
 Membership Promote Bilateral Trade

4.1 Estimating the Impact of GATT/WTO

The gravity model of trade has always been the workhorse to estimate the impact of various trade
policies and other determinants of trade flows, including the impact of GATT/WTO. While there are
several important empirical studies that have analyzed the effects of GATT and WTO in recent years
(e.g. Rose, 2004; Helpman et al., 2004; Chang and Lee, 2011; Dutt et al., 2013) using the gravity model,
to the best of our knowledge Larch et al. (2019) is the only study that offers a causal analysis by
incorporating and extending latest insights in the empirical structural gravity literature, e.g., the use of
intra-national trade flows among other improvements which we summarize below. Therefore, to obtain
the main estimates in this section we follow the methods of Larch et al. (2019) and we employ their
manufacturing dataset. We utilize the original underlying sample of Larch et al. (2019), which covers
218 countries over the period 1980-2016. The focus on total manufacturing and the time limits of the
data were determined by the availability of trade and production data, including data on internal trade
flows, which will prove important for proper quantification of the effects of GATT/WTO. We offer a
description of the data in Appendix A.4., and we refer the reader to Larch et al. (2019) for further details.

Stimulated by the debate in the related literature on whether and how much GATT/WTO promote
bilateral trade and because of the inability of existing studies to identify the direct country-specific
effects of GATT/WTO membership, we adapt and expand the methods and analysis from Larch et al.
(2019) and we implement the latest developments in the empirical structural gravity literature to
evaluate the impact of GATT and WTO membership on international trade. 7 The main novelty of our
analysis is that we obtain country-specific estimates of the impact of GATT/WTO and we translate these
estimates into general equilibrium welfare effects.

Following the related literature, and to perform consistent estimation and general equilibrium analysis,
we employ the structural gravity model, as summarized in Appendix A.3. To obtain our main estimates
of the GATT/WTO effects, we translate the structural gravity equation into the following econometric
specification, which we estimate following the best estimations practices and recommendations
proposed by Yotov et al. (2016):

 , = exp� , + , + + × + × + × � + , (4)

The variable , denotes nominal trade flows, which include international and intra-national trade, at
non-consecutive year t. Consistent with theory, intra-national trade flows are domestic sales that are
needed to close the market-clearance conditions for each country. Domestic sales in the aggregate
manufacturing data used here are constructed as apparent consumption, i.e., as the difference between
total production on a gross basis and aggregate exports. In addition to being theory-consistent, the use
of internal trade flows has important implications for the estimation of the impact of various trade
policies and determinants of trade flows. For example, Yotov (2012) demonstrates the importance of
internal trade flows to resolve the distance puzzle in trade. Dai et al. (2014) rely on internal trade flows
to identify the trade diversion effects of FTAs. Bergstrand et al. (2015) use internal trade flows to

7
 See for good overviews of structural gravity models Anderson (2011) and Yotov et al. (2016). The structural gravity model is
consistent with a wide range of different theoretical trade model. See for a discussion Costinot and Rodríguez-Clare (2014).
 18
demonstrate that structural gravity equations can capture the impact of globalization. Heid et al. (2018)
and Beverelli et al. (2019) show that the theory-consistent internal trade flows allow for the
identification of the effects of non-discriminatory trade policies and country-specific policies,
respectively. Finally, and more relevant to the current analysis, Baier et al. (2019) and Larch et al. (2019)
find that the introduction of internal trade flows has very important implications for quantifying the
impact of the effects of FTAs and WTO, respectively. In each case, these studies find that the estimates
of the policies in question are significantly larger when internal trade flows are included in the
estimation sample. The intuition for this result is that the inclusion of internal trade flows allows to
explicitly control for the fact that FTAs and WTO have lead to significant diversion from internal trade.
We demonstrate below that this is indeed the case also in our detailed specification with country-
specific GATT/WTO effects.

The term , denotes the set of time-varying source-country dummies, which control for the outward
multilateral resistances, countries' output shares and, potentially any other observable and
unobservable exporter-specific factors that may influence bilateral trade.

The term , encompasses the set of time-varying destination-country dummy variables that account
for the inward multilateral resistances, total expenditure, and any other observable and unobservable
importer-specific characteristics that may influence trade.

The term denotes the set of country-pair fixed effects, which serve two main purposes. First, the
pair fixed effects are the most flexible and comprehensive measure of time-invariant bilateral trade
costs because they will absorb all time-invariant gravity covariates along with any other time-invariant
bilateral determinants of trade costs that are not observable by the researcher and/or the policy maker,
c.f., Egger and Nigai (2015) and Agnosteva et al., (2016). Second, the pair fixed effects will absorb most
of the linkages between the endogenous trade policy variables and the remainder error term , in
order to control for potential endogeneity of the former, c.f., Baier and Bergstrand (2007). In principle,
the error term in gravity equations may carry some systematic information about trade costs. However,
due to the rich fixed effects structure in equation (4), researchers should be more confident to treat
and interpret , as a true measurement error.

The error term , in equation (4) is introduced as additive or multiplicative does not matter for the
PPML estimator (Santos Silva and Tenreyro, 2006).

The term × captures the standard gravity variables, such as bilateral distance, sharing a
common border (contiguity), sharing a common language, and sharing a colonial history, as well as any
time-varying bilateral determinants of trade flows, such as RTAs. As we include not only international
but also intra-national trade flows, we also control for crossing the national borders by × , which
are also allowed to be time-varying. The inclusion of time-varying international border variables is
important for the identification of the GATT/WTO because the estimates on these dummies will capture
common globalization effects. Bergstrand et al. (2015) demonstrate the that proper control for
globalization effects in structural gravity models leads to smaller estimates of the effects of FTAs. Below,
we will demonstrate that this is also the case with the country-specific estimates of the impact of GATT
and WTO that we will obtain. Importantly, to the extent that GATT and WTO have had multilateral trade
liberalization effects, the implication is that our border/globalization estimates will capture some of the
possible trade liberalization effects of GATT and WTO. Decoupling these effects from the impact of
globalization is beyond the scope of this study. However, the implication of our country-specific
GATT/WTO estimates is that they are conservative, i.e., possibly biased downward.

 19
The most important vector of variable is × . One of the key differences of our
quantification of the impact of GATT/WTO membership is to allow for possible trade diversion effects
of GATT/WTO members from domestic sales. This adjustment is consistent with gravity theory, as
described above, and with the objectives of GATT and WTO. Further, we also estimate country-specific
GATT/WTO effects within the same estimation framework. To the best of our knowledge, such country-
specific quantification does not exist so far in the related literature. As our identification strategy
requires information of domestic sales, we need such data for all countries across the world. This sort
of data are available for a sufficiently large set of countries starting in 1980. Therefore, our empirical
analysis of GATT and WTO effects will cover a period between 1980 and 2016, and it will focus on
manufacturing.

4.2 Partial Equilibrium Estimates of the impact of GATT/WTO

Table 1 presents a series of structural gravity estimates. In order to emphasize the importance of proper
account for different estimation challenges, we take a sequential approach to obtaining and presenting
our results. Four common features across all columns in Table 1 include: (i) The dependent variable is
always nominal bilateral trade in levels; (ii) The estimator is always PPML, c.f., Santos-Silva and Tenreyro
(2006, 2011); (iii) All estimates are obtained with panel data; (iv) In each specification we control for the
unobservable structural multilateral resistance terms, as well as for all other observable and
unobservable characteristics that may affect trade on the importer or on the exporter side, with
exporter-time and importer-time fixed effects; (v) Finally, all estimates but those in the first column are
obtained with pair fixed effects, which, as noted earlier, will control for all unobservable time-invariant
trade costs and will mitigate endogeneity concerns with respect to out RTAs and GATT/WTO estimates.
Thus, the main differences between the five columns in Table 1 are across two dimensions: (i) Whether
or not intra-national trade flows are added to the estimating sample; and (ii) Whether we control for
common globalization trends (i.e., whether we use time-varying border variables). Our results indicate
that both of these estimation practices play an important role for proper quantification of the effects of
GATT/WTO.

Column (1) of Table 1 estimates the gravity model with the set of standard gravity variables and
international trade flows only (i.e., without intra-national trade flows), as has been done in many existing
papers. Without going into details, we note that the estimates of the impact of the standard gravity
variables are readily comparable to those from the literature, c.f. Head and Mayer (2014). This
establishes the representativeness of our sample.

The estimates in column (2) of Table 1 introduce pair fixed effects. As noted earlier, the motivation for
the inclusion of pair fixed effects in gravity estimations is twofold. First, they will absorb and will fully
control for the impact of all observable and unobservable determinants of bilateral trade, c.f., Egger and
Nigai (2015) and Agnosteva et al. (2019). For this reason, we can no longer include in column (2) any of
the time-invariant standard gravity covariates, i.e., LN_DIST, CNTG, LANG, and CLNY. In order to allow
for asymmetries in the underlying time-invariant trade costs, we employ directional pair fixed effects.
Second, on a related note and as demonstrated by Baier and Bergstrand (2007), the use of the pair fixed
effects will help mitigate endogeneity concerns related to the trade policy variables in our specification,
specifically the RTAs, which are included in column (1), and especially important for our purposes, the
GATT/WTO variables, which we introduce next. The main result from column (2), as compared to

 20
You can also read