Theoretical and experimental revision of surface acoustic waves on the (100) plane of silicon - Nature
←
→
Page content transcription
If your browser does not render page correctly, please read the page content below
www.nature.com/scientificreports
OPEN Theoretical and experimental
revision of surface acoustic waves
on the (100) plane of silicon
Alexander Tarasenko1,2, Radim Čtvrtlík2,3* & Radim Kudělka2
The phase velocity dispersion of the surface acoustic waves on a basal plane of Si(100) has been
calculated in the whole range of the azimuthal angle of propagation. We present a detailed description
of the calculations. These calculations are compared with the experimental data obtained by a laser
acoustic method. Our data convincingly demonstrate the existence of a gap in the spectrum of the
phase velocities. The gap means that in a definite range of the phase velocities the SAWs are absent in
the whole interval of the azimuthal angles. There is an excellent coincidence between the numerical
and experimental data.
There are two types of bulk acoustic waves that can propagate in a homogeneous isotropic elastic solid substrate:
the longitudinal bulk wave (LBW) with polarization parallel to the propagation wave vector k and transverse
(shear) waves with polarization perpendicular to k . The polarization of the shear waves is either perpendicular
or parallel to the surface.
A well-known phenomenon of elastic energy propagation along a free surface of a solid substrate of infinite
depth is known as the Rayleigh waves1. They propagate with a constant velocity vR close to the shear wave veloc-
ity of the substrate vt . The energy carried by the Rayleigh wave is concentrated in a one-wavelength-thick wave
guide just below the free surface, hence the other popular name—surface acoustic waves (SAWs).
The Rayleigh waves are a mixture of the longitudinal bulk wave (LBW) and the transverse shear bulk wave
with the vertical polarization (SVBW), which propagates along the free boundary of solid. They are elliptically
polarized in the sagittal plane defined by the propagation vector k and normal to the free surface n . Their phase
velocity and group velocity in case of anisotropic media are dependent on the crystallographic orientation. The
properties of SAWs are modified on the surface of an anisotropic medium and, in turn, are more difficult for
the explicit analytical description. During the past decades the SAWs have been the subject of many studies. We
refer the Readers to the excellent books and reviews for the detailed theory of the S AWs2–6.
SAWs have attracted considerable experimental interest, because of their employment in many practical
applications. Analysis of these waves serves as a useful tool in the nondestructive characterization of materials,
especially for the determination of elastic properties of thin films deposited on substrate. SAWs have particular
importance in acoustics, seismology, geophysics, telecommunication, material sciences, photonics to name just
a few. The SAWs velocities are smaller roughly by five orders of magnitude in comparison to the velocities of the
electromagnetic waves in solids, which means 5 orders smaller wavelengths that opens new possibilities in the
miniaturization of various d evices7.
The amplitude of the Rayleigh waves decays exponentially in direction perpendicular to the surface. The pen-
etration depth is of the order of a wavelength and decreases with the increasing of the frequency, which makes the
SAWs sensitive to the surface defects, voids, cracks as well as coatings, films, and nano/micro particles adhered to
the surface. These surface imperfections cause dispersion of SAWs, i.e. dependence of the phase velocity on the
wave frequency. The SAWs are used for the investigations of the solid surfaces, thin films, layers and c oatings8–14.
Due to the applicational significance of the Rayleigh wave velocity, much effort has been devoted to finding
the analytical expressions, which are of simple forms and accurate enough for the practical purposes. There was
a need of the reasonably simple even approximate analytical expressions for this quantity. A number of papers
devoted to the derivation of the explicit expressions (approximate and exact) for the SAWs velocity had been
1
FZU-Institute of Physics of the Czech Academy of Sciences, Na Slovance 2, 182 21 Prague 8, Czech
Republic. 2Regional Centre of Advanced Technologies and Materials, Joint Laboratory of Optics of Palacky
University, Institute of Physics of Academy of Sciences of the Czech Republic, Faculty of Science, Palacky
University, 17. listopadu 12, 77146 Olomouc, Czech Republic. 3Institute of Physics of the Czech Academy of
Sciences, Joint Laboratory of Optics of Palacky University and Institute of Physics AS CR, 17. listopadu 50a,
77207 Olomouc, Czech Republic. *email: radim.ctvrtlik@upol.cz
Scientific Reports | (2021) 11:2845 | https://doi.org/10.1038/s41598-021-82211-6 1
Vol.:(0123456789)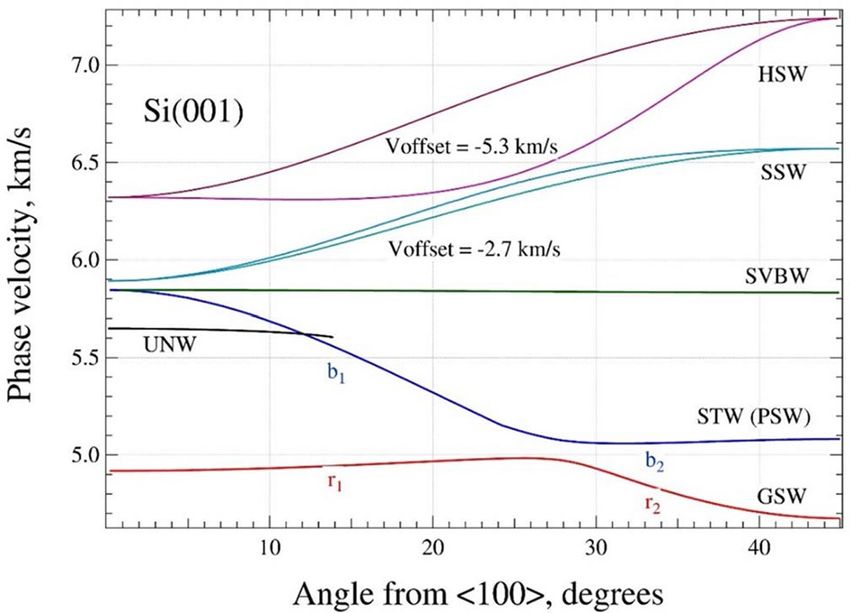
www.nature.com/scientificreports/
published and a lot of expressions had been proposed long before the exact solutions. One should mention the
aterial15:
first approximate expression for the isotropic m
0.87 + 1.12ν
vR = vt , ν ∈ [0 − 0.5] (1)
1+ν
√
where vt = E/2ρ(1 + ν) ; ρ is the material density; E denotes the Young’s modulus and ν is the Poisson’s ratio.
Many approximate expressions using sometimes ingenious tricks and approaches have been d eveloped16–28.
The first exact expression for the root of the Rayleigh equation using Cardano’s method was presented in the
work by R ahman29. Nkemzi, using the theory of Cauchy integrals, provided an alternate exact expression for the
root valid in the whole range of ν30,31. However, Malischewsky shown that this solution is incorrect and proposed
his own expression using Cardano’s s olution32,33 (see also Refs.34–36).
Despite the fundamental importance, practical relevance and great effort devoted to exploration of elastic
surface waves, there is still a need for a complete and general solution for the angular dependence of surface
Rayleigh waves for (100) plane of cubic crystals. In this paper we cover the concise introduction to the theory
of the SAWs on (100) surfaces of cubic crystals and present all final expressions necessary for calculations of the
azimuthal dependencies in the explicit form; the step by step procedure is presented in Supplementary Data. The
calculations carried out for the silicon (100) plane were verified by comparison with experimental data obtained
by the laser acoustic method.
Experimental setup
The experimental values of SAWs’ phase velocity have been obtained using the Laser acoustic analyzer (Fraun-
hofer Institute, Dresden, Germany)8,9. The instrument is equipped with a N2 pulse laser (wavelength 337 nm)
irradiating a sample surface by pulses with duration of 3 ns and energy of 200 µJ. The light is focused to a line of
about 4 mm length by a cylindrical lens. This leads to a local thermal expansion and generation of broadband
SAWs. The waves are transformed to an electrical signal by a piezoelectric detector using a PVDF foil pressed
by a steel wedge to the sample surface (detector receives SAWs within a bandwidth of 200 MHz). The signal is
amplified and proceeded to an oscilloscope (sampling rate of 2 GSa/s, bandwidth of 500 MHz) coupled with
the PC analyzing the signal. The sample and wedge transducer are fixed to a translation stage driven by the PC
controlled DC motor. The stage is moved in the x1 direction to vary the distance between the focused line and the
transducer. The analysis of the signals detected at different distances permits to calculate the SAWs phase velocity.
Experiments were performed on a one-side polished Si(100) wafer with 4 inches in diameter and thickness
of 500 µm. The wafer was 100 Ω·cm phosphorus doped N-type single crystal (University Wafer Inc., US). The
phase velocities were measured with a step of 5° in the range [0°–45°], a step of 1° was used for the transition
zone around 30°, while 5 measurements were performed for each angle.
The values of phase velocity υ(θ ) were determined from the dispersion curves υ(θ , ω) by extrapolation to zero
frequency. The value υ(θ, 0) represents the SAWs velocity on the defect-free solid surface. The low frequency
SAWs penetrating deep into the crystal effectively eliminate the influence of surface layers and defects37. On the
clean surfaces the dispersion curves should be straight lines parallel to the frequency axis. In our experiments
the dispersion curves υ(ω) have very small tilt, indicating the presence of a thin native oxide layer. The estimated
thickness of the S iO2 layer is about 2–5 nm as evaluated by the same LAW instrument.
The repeatability test on the Si(100) wafer in the [110] direction measured over the distance x = 20 mm
showed a very low variation of the dispersion curves. Typically, the relative velocity uncertainty was about 0.02%,
which corresponds to the absolute uncertainty δvR < 1.1 m/s.
Results and discussion
The anisotropy modifies the structure of the SAW spectrum. There is a number of new “additional” waves, termed
as “quasi”, “pseudo” or “leaky” waves and there are some controversies regarding the use of different notations
for the same waves. These problems of terminology have been discussed in the review38.
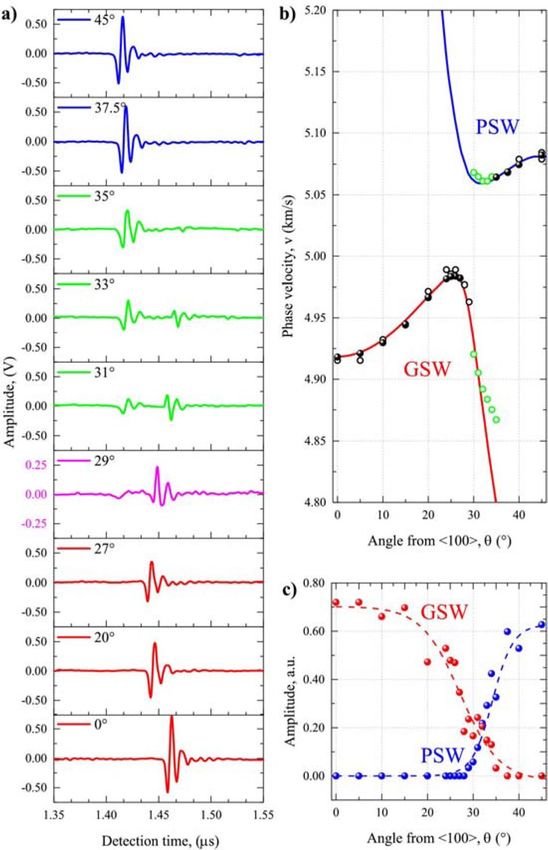
SAWs on Si(100). Obviously, the spectra of the azimuthal dependencies υ(θ ) depend significantly on the
anisotropy ratio
2c44
A= , (2)
c11 − c12
where c11, c12 and c44 are the components of the stiffness tensor. In the isotropic cubic materials A = 1. For Si
A = 1.563. This factor determines the azimuthal dispersions of the SAWs. One should expect that the spectra
of SAWs calculated for cubic crystals with close values of anisotropy ratio should be qualitatively the same.
The azimuthal dispersions have been analyzed in many papers. We mention only some investigations of these
dependencies on (100) planes of cubic crystals: S i39–43, Cu44–46, GaAs47, 3C-SiC/c-AlN48, InSb49,50, Ni2,51.
Using the approach, presented in the Supplementary Data we calculated these dependencies for the Si(100)
plane plotted in Fig. 1. The most interesting are the red and blue lines. These waves appeared in all papers men-
tioned above, but under the different names and with different understanding as well as interpretation with
respect to their layout.
The red line is known as the Rayleigh wave39,42 or the generalized surface wave (GSW)46,48. It should be noted
that the GSWs typically exhibit three displacement components: the longitudinal ul ( r , x3 , t) (along the wave vec-
tor k ), transversal ut ( r , x3 , t) (perpendicular to k and n ) and normal u3 ( r , x3 , t) (along n ). The specific features
of GSW are the following:
Scientific Reports | (2021) 11:2845 | https://doi.org/10.1038/s41598-021-82211-6 2
Vol:.(1234567890)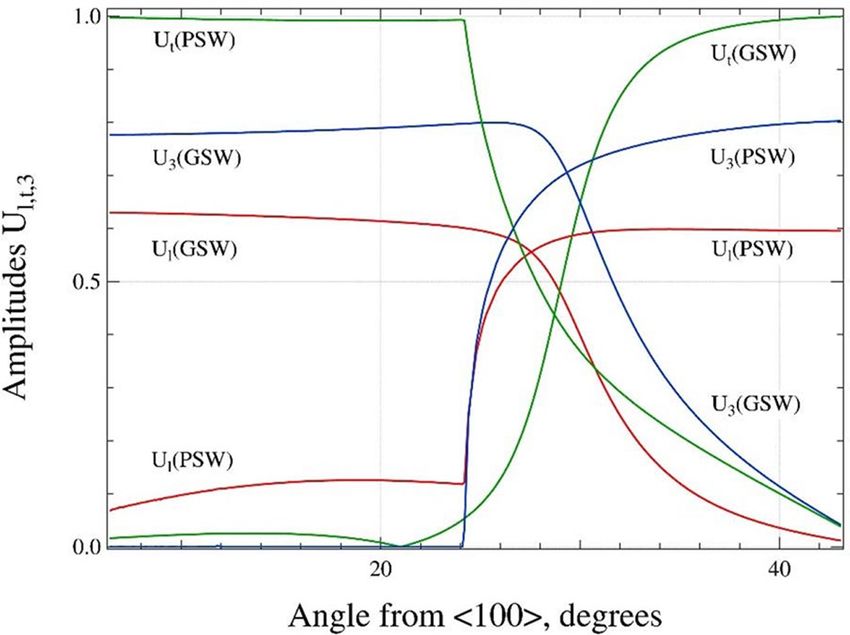
www.nature.com/scientificreports/
Figure 1. Acoustic wave phase velocities ν vs θ . (graph created using a software IGOR version 6.34A, https://
www.wavemetrics.com/products/igorpro).
• the minimal values of the boundary-condition determinant δ are very small, ∀δ ∈ [10−16–10−14] in the whole
range θ , i.e. these values are only the errors of the computations; the wave is a genuine root of the determinant
Det = 0, contrary to the other SAWs which have the characteristic values δ ~ 10–4–10–7;
• the behavior of the displacement components is rather unusual as compared with the other modes.
The blue line is labeled as the slowest (transverse) bulk wave (STW). It is the most controversial mode of the
whole spectrum. For the sake of a narrative simplicity, lets divide blue and red curves into parts labeled b1, b2 and
r1, r2, respectively. The controversy of the angular dispersion of these waves comes from the very often presented
composition of STW as a smooth sequence b1 and r2 parts, while b 2 part is considered as a disconnected isolated
branch or pseudo surface wave (PSW)39,42,46. The GSW is treated as the sequence r1 and r2. Pratt and Lim using a
double wedge method (one perspex wedge was fixed and used for the generation of the acoustic signals, while the
other one was movable and used for the signal detection) did not reveal a gap in the spectrum42. Later, Stoddart
et al. using the Brillouin scattering spectroscopy also reported experimental data suggesting the absence of the
gap and merging of GSW and PSW b ranches40.
Our results can be treated in a different way. The part b2 is not considered as a disconnected branch. It is
smoothly connected with the b1 part forming the STW (PSW) mode. The GSW is the continuous sequence r1 and
r2. We did not find any solutions in the gap [4.98–5.06] km/s in the whole range of the angles [0°–45°]. Similarly,
two distinct well-resolved dispersion dependencies were also obtained for the GSW and PSW modes on GaAs
and InSb(001) s urfaces47,49. It was demonstrated that for the sufficiently high resolution of the Brillouin scattering
method it is possible to distinguish experimentally the GSW and PSW modes on GaAs(001). Also, the ultrasonic
reflection technique reveals the gap between the GSW and PSW dependencies on Cu(001)46.
These modes have distinctly different azimuthal dispersions as compared to the other SAWs. We propose
the following possible genesis of these modes based on the analysis of the azimuthal dependencies of their dis-
placement components plotted in Fig. 2. For better representation we calculated the normalized displacements
(amplitudes) as
ul,t,3
Ul,t,3 =
, x3 = 0. (3)
ul2 + ut2 + u32
The dependencies are rather specific. The comparison of the compositions Ul : Ut : U3 of the GSW and PSW
modes at the θ = 0° and θ = 45°
GSW ≈ 0.6 : 0.01 : 0.8 θ = 0◦
PSW ≈ 0.6 : 0.04 : 0.8 θ = 45◦
GSW ≈ 0.02 : 1 : 0.05 θ = 45◦
PSW ≈ 0.05 : 1 : 0 θ = 0◦
is surprising and reveals an interesting, obvious symmetry at the ends of the angle range. The behavior of the
dependencies is untypical. The GSW amplitudes Ul and U3 drop down fast for θ > 27°. The PSW normal amplitude
U3 is completely absent in the interval [0°–24°]. The Ul , amplitude is also rather small. The both amplitudes jump
in a step-like way at θ = 24° and the Ut amplitude drops down in the same step-like way.
Scientific Reports | (2021) 11:2845 | https://doi.org/10.1038/s41598-021-82211-6 3
Vol.:(0123456789)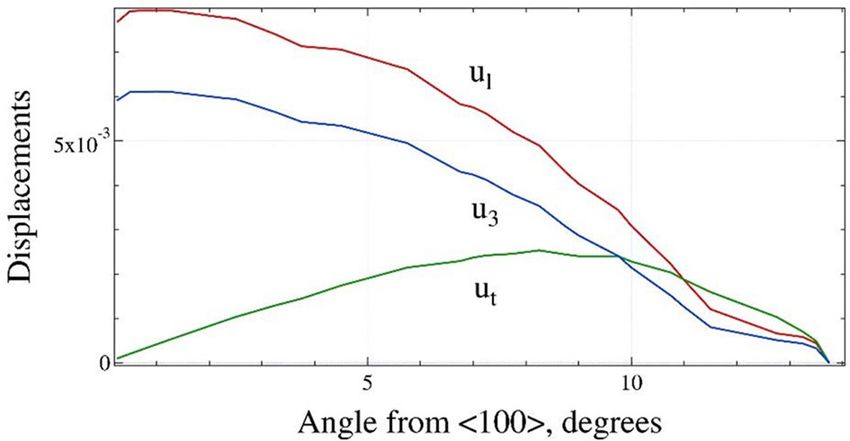
www.nature.com/scientificreports/
Figure 2. The comparison of the azimuthal dependencies of the normalized longitudinal Ul (red), transversal
Ut (green) and normal U3 (blue) amplitudes for the GSW and PSW modes, calculated at x3 = 0. (graph created
using a software IGOR version 6.34A, https://www.wavemetrics.com/products/igorpro).
Figure 3. The azimuthal dependencies of the displacements ul,t,3 for the UNW mode calculated at x3 = 0
(longitudinal—red, transversal—green and normal—blue). (graph created using a software IGOR version 6.34A,
https://www.wavemetrics.com/products/igorpro).
It should be some important reason which causes such an untypical behavior. The possible source of this
discrepancy is the coupling between the GSW and STW modes. Without the coupling the modes should have
simple monotone azimuthal dispersions: the GSW would be represented by the r1-b2 sequence and STW behaves
as a b1-r2 sequence, but the “original” modes cross each other at θ ≈ 27°. Having the same velocity, they should
interact. The mutual “resonance” interaction results in the instability of the spectrum, prevents the crossing of
the modes and produces the reconstruction of the wave modes. In order to accommodate the forbidden cross-
ing, the waves exchange their parts, reconstruct their sequences and form a gap of the forbidden velocities. The
result of this reconstruction are new dependencies; r1-r2 sequence for GSW and b1-b2 sequence for STW(PSW).
It is clearly seen that b2 is the Rayleigh-like wave and r2 obviously behaves like the STW-type wave.
The unknown mode (UNW, black line) exists in a narrow range 0◦ ≤ θ ≤ 14◦ and has a weak azimuthal dis-
persion as shown in Fig. 1. For the [100] direction, i.e. θ = 0°, the longitudinal and normal displacements ul,3 have
maximal values, while the transversal displacement ut has a negligible amplitude. Figure 3 shows that with the
increase of θ the ul,3 displacements monotonously decrease. The transversal displacement reaches its maximum
for θ = 8° and further decreases to zero. The compositions Ul : Ut : U3 ≈ 0.3 : 0.9 : 0.2 at θ = 5°changes linearly
to 0.6 : 0.6 : 0.47 at θ = 14°. It should be noted that similar directionally selective/constrained wave considered as
shear bulk wave polarized in the sagital plane was also reported by Caliendo48 for SiC single crystal.
The almost straight horizontal line (green) represents the shear vertical bulk acoustic wave SVBW polarized
in the plane perpendicular to the Si(100) surface regardless of propagation d irection48. This mode coincides with
the STW for [100] direction, which is one of acoustic axes of a silicon single crystal52. The azimuthal dispersion
is almost absent, but the composition changes noticeably: Ul grows from 0.6 to 0.9, Ut drops from 0.7 to zero,
and only U3 ≈ 0.4 has an almost constant value.
The cyan and turquoise lines represent the supersonic waves (SSW, bulk longitudinal wave), or quasi-LBW2,48.
The “quasi” means that the wave is not exclusively polarized in either parallel or normal to arbitrary propaga-
tion direction38. The curves are plotted with the vertical offset − 2.7 km/s. These modes have the phase velocity
higher than that of the slowest transverse bulk wave. The composition of the waves is almost the same, and
almost independent on the θ : Ul : Ut : U3 ≈ 0.9 : 0.4 : 0.1. Both waves appear only in the crystals with the strong
Scientific Reports | (2021) 11:2845 | https://doi.org/10.1038/s41598-021-82211-6 4
Vol:.(1234567890)www.nature.com/scientificreports/
Figure 4. (a) The signal waveforms obtained for some representative values of the azimuthal angles θ; (b)
The comparison of the experimental data with the calculated dependencies: solid circles represent data from
dispersion curves, open circles represent data from time of detection, green circles highlight the simultaneous
detection of GSW and PSW; (c) The angular variation of the signal intensities: GSW—red and PSW—blue
circles. (graph created using a software OriginPro 8.1 SR3 v8.1.34.90, https://www.originlab.com/).
enough anisotropy of the stiffness tensor. The modes do not satisfy the original condition that the displacement
components vanish at the infinite depth. The solution is not a true surface wave. The displacements do not decay
with depth to zero, nonetheless, these waves can be quite easily detected. The mode is confidently identified by
the search algorithm. SSWs have been observed experimentally using the surface Brillouin s cattering44.
The highest solutions detected by the search algorithm are two branches of the hypersonic surface waves
(HSW, violet and purple lines) with velocities laying in the range [11.6–12.6] km/s. The HSW modes are plotted
in Fig. 1 with the vertical offset -5.3 km/s. Both waves have the same composition U l : Ut : U3 ≈ 0.8 : 0.01 : 0.6
almost independent on the azimuthal angle.
Experimental data. The experimental values of phase velocities measured via the laser-acoustic method
are plotted in Fig. 4b. Due to the symmetry of the (100) plane of the cubic crystals, one needs to measure the
SAW angular dispersion only in the 45° interval between the [100] and [110] directions. The propagation vector
lies in the (100) plane in the direction specified by abscissa.
The values of phase velocity are depicted as solid circles in Fig. 4b. There is a very good coincidence between
the experimental and numerical data, where the experimental values overlap with the theoretical ones. The
experimental data follow the GSW branch up to 27°, while they overlap with the PSW branch beyond 35°. In the
transition zone around 30° the dispersion curves could not be experimentally measured. On the contrary, the
results obtained by Pratt and L im42 and later Stoddart et al.40 using the Brillouin scattering spectroscopy reported
smooth transition between GSW and PSW taking place within this transition z one40.
To understand the inability to reconstruct the dispersion curve v = v(ω) in the transition region, let us
consider the principle of laser-acoustic method, where the dispersion curves v = v(ω) are calculated from the
Fourier-transformed signals detected at two distances x1 and x2 (the distance between the laser incidence point
and x1 is equal 7.2 mm, while the distance x2 − x1 = 20 mm). The typical signal waveforms detected at x1 for
different wave propagation directions are summarized in Fig. 4a. Except for the angles within [28°–34°] interval,
the strong single impulse is observed, which permits the reliable determination of phase velocity from dispersion
Scientific Reports | (2021) 11:2845 | https://doi.org/10.1038/s41598-021-82211-6 5
Vol.:(0123456789)www.nature.com/scientificreports/
curves v = v(ω). However, for angles in the transition region, either a second impulse appears representing a
second mode of waves or the signal waveform exhibits complicated character. In both cases the signals’ amplitude
and the signal/noise ratio are reduced, especially in the latter case. This phenomenon can be ascribed to the nature
of GSW and PSW modes. The dispersion curve cannot be obtained by the standard software.
However, instead of calculating the phase velocity from dispersion curve, it is possible to obtain its value
directly from the detection time of the signal at position x1 (see open symbols in Fig. 4b). It can be seen that
up to the angle of 27° a strong typical waveform can be recognized, while a strong GSW and PSW interaction
is evidenced at 29°. On the other hand, two waveforms propagating with different velocities can be recognized
already for 30° and can be detected up to 35° (green curves in Fig. 4a) that, in turn, allows determination of two
wave velocities (green open circles in Fig. 4b). It can be clearly seen that the measured velocities closely follow
the calculated azimuthal dispersion curves. In fact, this is for the first time the LAW method has been success-
fully employed for simultaneous detection of GSW and PSW.
The origin of the transition region [27°–35°] can be explained based on the variation of the waves with the
propagation direction, see Fig. 2. The originally vertical (only for the [100] direction) and later quasi-vertical
polarization of GSW starts to twist over to horizontal with the increase of the angle towards [110] due to the
coupling with STW43,52. The GSW completely degenerates into the STW for the [110] direction. Besides, the
penetration depth of GSW increases significantly that in turn leads to the substantial decrease of its normal
displacement below the detection threshold for the used LAW setup. This also lowers the detection ability of this
wave mode, because only waves with significant polarization component into the sagittal plane can be detected
using the LAW experimental setup. Simultaneously, a new high-speed wave mode appears around 30°. This PSW
is in fact a leaky-type wave that exists as a superposition of two evanescent partial waves and a small bulk wave
component (quasi-shear wave with horizontal polarization). The leaky character represents the loss of energy of
PSW away from the surface into the solid while emitting STW as it p ropagates43,53. However, the radiation losses
are small and these leaky waves can be easily detected. It should be noted that for the [110] direction the PSW
is formed only by two evanescent partial waves as the bulk wave component d isappears44,54 and turns into the
pure Rayleigh wave also classified as the symmetrical supersonic surface w ave38 and references therein. In fact
this transition takes place due to the same reason for which the Rayleigh branch disappeared for this direction17.
The dependencies of maximum amplitude of the laser-acoustic impulses on their propagation direction are
plotted in Fig. 4c. Based on the absolute value of wave velocity, it is possible to ascribe the individual values either
to GSW or PSW. The amplitude of GSW signal decays beyond 15° and vanishes beyond 35°. On the contrary,
the amplitude of PSW signal grows within the transition region and reaches its maximum at 45° ([110] direc-
tion). The way how the detected laser-acoustic impulses change their propagation velocity, amplitude and shape
with the propagation angle implies a smooth transition between two modes, similarly to the Brillouin scattering
based methods for the (001) plane of cubic crystals40,47. The observed amplitude variations closely reflect the
turnover of the polarization of GSW from vertical to transversal direction for GSW (decrease of amplitude)
and vanishing contribution of bulk wave component for PSW in the [110] direction (increase of amplitude).
Comparison of experimental signal amplitudes detected via a piezo-foil in Fig. 4c and calculated amplitudes
presented in Fig. 2 shows a very good qualitative coincidence. This also clearly explains, why GSW and PSW
where not detected in the transition region, where their amplitudes were small in order to be experimentally
detected using the LAW setup.
Summary
In this work, we presented a short introduction to the theory of SAWs and all expressions necessary for calcula-
tions of the dispersion curves for the SAWs propagating on (100) planes of cubic crystals. We calculated the set
of SAWs for the Si(100) plane and obtained some new SAWs. We proposed new interpretation of the genesis of
the GSW and STW modes. We demonstrated that the dependencies δ vs θ may be a useful tool for the analysis of
the spectrum of SAWs. We presented very accurate experimental data which exactly coincide with the calculated
dependencies. The data clearly prove the existence of the gap in the whole range [0°–45°]. There are no SAWs
having phase velocities in the interval [4.98–5.06] km/s for any angle θ.
Data availability
The data that support the findings of this study are available from the corresponding author upon reasonable
request.
Received: 25 September 2020; Accepted: 5 January 2021
References
1. Rayleigh, L. On waves propagated along the plane surface of an elastic solid. Proc. Lond. Math. Soc. 17, 4–11. https://doi.
org/10.1112/plms/s1-17.1.4 (1885).
2. Farnell, G. W. In Physical Acoustics Vol. 6 (eds Mason, W. P. & Thurston, R. N.) 109–166 (Academic Press, Cambridge, 1970).
3. Farnell, G. W. & Adler, E. L. In Physical Acoustics Vol. 9 (eds Mason, W. P. & Thurston, R. N.) 35–127 (Academic Press, Cambridge,
1972).
4. Hugins, D. A. In Physical Acoustics Vol. XVIII (eds Mason, W. P. & Thurston, R. N.) 35 (Academic Press, Cambridge, 1985).
5. Auld, B. A. Acoustic Fields and Waves in Solids 2. 2. (Wiley, Hoboken, 1973).
6. Pollard, H. F. Sound Waves in Solids. (Pion, 1977).
7. Delsing, P. et al. The 2019 surface acoustic waves roadmap. J. Phys. D Appl. Phys. 52, 353001. https://doi.org/10.1088/1361-6463/
ab1b04 (2019).
8. Schneider, D., Schwarz, T. & Schultrich, B. Determination of elastic modulus and thickness of surface layers by ultrasonic surface
waves. Thin Solid Films 219, 92–102. https://doi.org/10.1016/0040-6090(92)90728-T (1992).
Scientific Reports | (2021) 11:2845 | https://doi.org/10.1038/s41598-021-82211-6 6
Vol:.(1234567890)www.nature.com/scientificreports/
9. Schneider, D., Hofmann, R., Schwarz, T., Grosser, T. & Hensel, E. Evaluating surface hardened steels by laser-acoustics. Surf. Coat.
Technol. 206, 2079–2088. https://doi.org/10.1016/j.surfcoat.2011.09.017 (2012).
10. Tarasenko, A., Jastrabík, L. & Tarasenko, N. A. Effect of roughness on the elastic surface wave propagation. Eur. Phys. J. Appl. Phys.
24, 3–12. https://doi.org/10.1051/epjap:2003059 (2003).
11. Tarasenko, N., Jastrabik, L. & Tarasenko, A. Surface acoustic waves in ferroelectrics. Ferroelectrics 298, 325–333. https://doi.
org/10.1080/00150190490423822 (2004).
12. Tarasenko, N., Bohac, P., Jastrabik, L., Chvostova, D. & Tarasenko, A. Effect of roughness on the phase velocity of Rayleigh waves
in GaAs crystals. Thin Solid Films 491, 184–189. https://doi.org/10.1016/j.tsf.2005.05.049 (2005).
13. Tarasenko, A., Bohac, P., Fedorovich, R., Jastrabík, L. & Picek, R. Effect of Au drops on the phase velocity dispersion of Rayleigh
waves in Si crystals. J. Appl. Phys. https://doi.org/10.1063/1.2781526 (2007).
14. Tarasenko, A., Boháč, P. & Jastrabik, L. Surface acoustic waves in the layered systems. In Proceedings of 32nd European Conference
on Acoustic Emission Testing, Vol. 2, 485 (2016).
15. Bergmann, L. & Hatfield, H. Ultrasonics and their Scientific and Technical Applications (Wiley, Hoboken, 1938).
16. Viktorov, I. A. Rayleigh and Lamb Waves: Physical Theory and Applications. (Plenum Press, 1967).
17. Briggs, G. A. D. Acoustic Microscopy (Clarendon Press, Oxford, 1992).
18. Barnett, D. M., Lothe, J., Nishioka, K. & Asaro, R. J. Elastic surface waves in anisotropic crystals: A simplified method for calculat-
ing Rayleigh velocities using dislocation theory. J. Phys. F Met. Phys. 3, 1083–1096. https://doi.org/10.1088/0305-4608/3/6/001
(1973).
19. Vinh, P. & Malischewsky, P. An approach for obtaining approximate formulas for the Rayleigh wave velocity. Wave Motion 44,
549–562. https://doi.org/10.1016/j.wavemoti.2007.02.001 (2007).
20. Vinh, P. C. & Malischewsky, P. G. An improved approximation of Bergmann’s form for the Rayleigh wave velocity. Ultrasonics 47,
49–54. https://doi.org/10.1016/j.ultras.2007.07.002 (2007).
21. Li, X.-F. On approximate analytic expressions for the velocity of Rayleigh waves. Wave Motion 44, 120–127. https://doi.
org/10.1016/j.wavemoti.2006.07.003 (2006).
22. Sudheer, G., Hemanth Lakshmi, M. & Rao, Y. V. A note on formulas for the Rayleigh wave speed in elastic solids. Ultrasonics 73,
82–87. https://doi.org/10.1016/j.ultras.2016.08.021 (2017).
23. Malischewsky, P. Comparison of approximated solutions for the phase velocity of Rayleigh waves (Comment on ‘Characterization
of surface damage via surface acoustic waves’). Nanotechnology 16, 995–996. https://doi.org/10.1088/0957-4484/16/6/N01 (2005).
24. Spathis, A. T. Use of Padé approximants to estimate the Rayleigh wave speed. Math. J. https://doi.org/10.3888/tmj.17-1 (2015).
25. Royer, D. A study of the secular equation for Rayleigh waves using the root locus method. Ultrasonics 39, 223–225. https://doi.
org/10.1016/S0041-624X(00)00063-9 (2001).
26. Nakamura, G. & Tanuma, K. A formula for the fundamental solution of anisotropic elasticity. Q. J. Mech. Appl. Math. 50, 179–194.
https://doi.org/10.1093/qjmam/50.2.179 (1997).
27. Destrade, M. Rayleigh waves in symmetry planes of crystals: Explicit secular equations and some explicit wave speeds. Mech.
Mater. 35, 931–939. https://doi.org/10.1016/S0167-6636(02)00294-6 (2003).
28. Rahman, M. & Michelitsch, T. A note on the formula for the Rayleigh wave speed. Wave Motion 43, 272–276. https://doi.
org/10.1016/j.wavemoti.2005.10.002 (2006).
29. Rahman, M. & Barber, J. R. Exact expressions for the roots of the secular equation for Rayleigh waves. J. Appl. Mech. 62, 250–252.
https://doi.org/10.1115/1.2895917 (1995).
30. Nkemzi, D. A new formula for the velocity of Rayleigh waves. Wave Motion 26, 199–205. https://doi.org/10.1016/S0165
-2125(97)00004-8 (1997).
31. Nkemzi, D. W. A simple and explicit algebraic expression for the Rayleigh wave velocity. Mech. Res. Commun. 35, 201–205. https
://doi.org/10.1016/j.mechrescom.2007.10.005 (2008).
32. Malischewsky, P. G. Comment to “A new formula for the velocity of Rayleigh waves” by D. Nkemzi [Wave Motion 26 (1997)
199–205]. Wave Motion 31, 93–96. https://doi.org/10.1016/S0165-2125(99)00025-6 (2000).
33. Malischewsky, P. A note on Rayleigh-wave velocities as a function of the material parameters. Geofísica Internacional 43,
507–509 (2004).
34. Vinh, P. C. & Ogden, R. W. On formulas for the Rayleigh wave speed. Wave Motion 39, 191–197. https://doi.org/10.1016/j.wavem
oti.2003.08.004 (2004).
35. Vinh, P. C. & Ogden, R. Formulas for the Rayleigh wave speed in orthotropic elastic solids. Arch. Mech. 56, 247–265 (2004).
36. Vinh, P. C. & Ogden, R. W. On the Rayleigh wave speed in orthotropic elastic solids. Meccanica 40, 147–161. https://doi.
org/10.1007/s11012-005-1603-6 (2005).
37. Paehler, D., Schneider, D. & Herben, M. Nondestructive characterization of sub-surface damage in rotational ground silicon wafers
by laser acoustics. Microelectron. Eng. 84, 340–354. https://doi.org/10.1016/j.mee.2006.11.001 (2007).
38. Favretto-Cristini, N., Komatitsch, D., Carcione, J. M. & Cavallini, F. Elastic surface waves in crystals. Part 1: Review of the physics.
Ultrasonics 51, 653–660. https://doi.org/10.1016/j.ultras.2011.02.007 (2011).
39. Lim, T. C. & Farnell, G. W. Search for forbidden directions of elastic surface-wave propagation in anisotropic crystals. J. Appl. Phys.
39, 4319. https://doi.org/10.1063/1.1656967 (1968).
40. Stoddart, P. R., Comins, J. D. & Every, A. G. Brillouin-scattering measurements of surface-acoustic-wave velocities in silicon at
high temperatures. Phys. Rev. B 51, 17574–17578. https://doi.org/10.1103/PhysRevB.51.17574 (1995).
41. Kuok, M. H., Ng, S. C., Rang, Z. L. & Liu, T. Brillouin scattering from pseudosurface acoustic waves in (111) silicon. Solid State
Commun. 110, 185–189. https://doi.org/10.1016/S0038-1098(99)00075-7 (1999).
42. Pratt, R. G. & Lim, T. C. Acoustic surface waves on silicon. Appl. Phys. Lett. 15, 403–405. https: //doi.org/10.1063/1.165287 8 (1969).
43. Hess, P., Lomonosov, A. M. & Mayer, A. P. Laser-based linear and nonlinear guided elastic waves at surfaces (2D) and wedges (1D).
Ultrasonics 54, 39–55. https://doi.org/10.1016/j.ultras.2013.05.013 (2014).
44. Every, A. Supersonic surface acoustic waves on the 001 and 110 surfaces of cubic crystals. J. Acoust. Soc. Am. 138, 2937–2944. https
://doi.org/10.1121/1.4934557 (2015).
45. Lim, T. C. & Farnell, G. W. Character of pseudo surface waves on anisotropic crystals. J. Acoust. Soc. Am. 45, 845–851. https://doi.
org/10.1121/1.1911556 (1969).
46. Rollins, R. F., Lim, T. C. & Farnell, G. W. Ultrasonic reflectivity and surface wave phenomena on surfaces of copper single crys-
tals. Appl. Phys. Lett. 12, 236. https://doi.org/10.1063/1.1651971 (1968).
47. Kuok, M., Ng, S. & Zhang, V. L. Angular dispersion of surface acoustic waves on (001), (110), and (111) GaAs. J. Appl. Phys. 89,
7899–7902. https://doi.org/10.1063/1.1371943 (2001).
48. Caliendo, C. Theoretical analysis of SAW propagation in 3C-SiC/c-AlN. Crystals 6, 25. https: //doi.org/10.3390/cryst6 03002 5 (2016).
49. Kuok, M., Ng, S. & Zhang, V. L. A Brillouin study of the angular dispersion of generalized surface and pseudosurface acoustic
waves on the (001) surface of InSb. Appl. Phys. Lett. 77, 1298–1300. https://doi.org/10.1063/1.1290270 (2000).
50. Kuok, M., Ng, S., Zhang, V. L. & Chua, S. Generalized surface, pseudosurface, and high-frequency pseudosurface acoustic waves
on (001), (110), and (111) InSb. Phys. Rev. B. https://doi.org/10.1103/PhysRevB.62.16665 (2000).
51. Mendik, M., Sathish, S., Kulik, A., Gremaud, G. & Wachter, P. Surface acoustic wave studies on single crystal nickel using Brillouin
scattering and scanning acoustic microscope. J. Appl. Phys. 71, 2830–2834. https://doi.org/10.1063/1.351013 (1992).
Scientific Reports | (2021) 11:2845 | https://doi.org/10.1038/s41598-021-82211-6 7
Vol.:(0123456789)www.nature.com/scientificreports/
52. Every, A. G. et al. Bulk and surface acoustic wave phenomena in crystals: Observation and interpretation. Wave Motion 50,
1197–1217. https://doi.org/10.1016/j.wavemoti.2013.02.007 (2013).
53. Hong, Y., Sharples, S. D., Clark, M. & Somekh, M. G. Rapid and accurate analysis of surface and pseudo-surface waves using
adaptive laser ultrasound techniques. Ultrasonics 42, 515–518. https://doi.org/10.1016/j.ultras.2004.01.046 (2004).
54. Maznev, A. A. & Every, A. G. Secluded supersonic surface waves in germanium. Phys. Lett. A 197, 423–427. https://doi.
org/10.1016/0375-9601(94)00985-X (1995).
Acknowledgements
The research was partially funded by the Czech Ministry of Education, Youth and Sports and the European Struc-
tural and Investment Funds under Project No. SOLID21-CZ.02.1.01/0.0/0.0/16_019/0000760. The authors also
gratefully acknowledge the support by the project TH03020245 of the Technology Agency of the Czech Republic
and the Operational Program Research, Development and Education, projects No. CZ.02.1.01/0.0/0.0/17_049
/0008422 and No. CZ.02.1.01/0.0/0.0/16_019/0000754 of the Ministry of Education, Youth and Sports of the
Czech Republic. RC and RK also thank the project No. CZ.1.05/2.1.00/19.0377 for support of the infrastructure
of their workplace and the project IGA_PrF_2020_007 of Palacky University.
Authors contributions
A.T.: conceptualization, methodology, formal analysis, theoretical calculations, writing—original draft, writ-
ing—review & editing, visualization. R.C.: conceptualization, writing—original draft, writing—review & editing.
Data analysis, visualization, funding acquisition. R.K.: investigation, data analysis, writing—review & editing.
All authors contributed to the article and approved the submitted version.
Competing interests
The authors declare no competing interests.
Additional information
Supplementary Information The online version contains supplementary material available at https://doi.
org/10.1038/s41598-021-82211-6.
Correspondence and requests for materials should be addressed to R.Č.
Reprints and permissions information is available at www.nature.com/reprints.
Publisher’s note Springer Nature remains neutral with regard to jurisdictional claims in published maps and
institutional affiliations.
Open Access This article is licensed under a Creative Commons Attribution 4.0 International
License, which permits use, sharing, adaptation, distribution and reproduction in any medium or
format, as long as you give appropriate credit to the original author(s) and the source, provide a link to the
Creative Commons licence, and indicate if changes were made. The images or other third party material in this
article are included in the article’s Creative Commons licence, unless indicated otherwise in a credit line to the
material. If material is not included in the article’s Creative Commons licence and your intended use is not
permitted by statutory regulation or exceeds the permitted use, you will need to obtain permission directly from
the copyright holder. To view a copy of this licence, visit http://creativecommons.org/licenses/by/4.0/.
© The Author(s) 2021
Scientific Reports | (2021) 11:2845 | https://doi.org/10.1038/s41598-021-82211-6 8
Vol:.(1234567890)You can also read