Third Quarter 2018 Investor Presentation, November 8, 2018 - Investor Relations

Page created by Daniel Davidson
 
CONTINUE READING
Third Quarter 2018 Investor Presentation, November 8, 2018 - Investor Relations
Third Quarter 2018 Investor Presentation, November 8, 2018
Third Quarter 2018 Investor Presentation, November 8, 2018 - Investor Relations
Statement of Caution Under the Private Securities Litigation Reform Act of 1995

This document contains “forward-looking statements” within the meaning of the Private Securities Litigation Reform Act of 1995. These statements relate
to expectations concerning matters that (a) are not historical facts, (b) predict or forecast future events or results, or (c) embody assumptions that may
prove to have been inaccurate, including statements relating to the advertising strategies, needs and expectations of brands and agencies, industry and
market trends, expectations regarding investment strategies, and the financial targets such as revenue, Adjusted EBITDA and Adjusted EBITDA margins
of The Trade Desk, Inc. (the Company). When words such as “believe,” “expect,” “anticipate,” “will”, “outlook” or similar expressions are used, the
Company is making forward-looking statements. Although the Company believes that the expectations reflected in such forward-looking statements are
reasonable, it cannot give readers any assurance that such expectations will prove correct. These forward-looking statements involve risks, uncertainties
and assumptions, including those related to the Company’s limited operating history, which makes it difficult to evaluate the Company’s business and
prospects, the market for programmatic advertising developing slower or differently than the Company’s expectations, the demands and expectations of
clients and the ability to attract and retain clients. The actual results may differ materially from those anticipated in the forward-looking statements as a
result of numerous factors, many of which are beyond the control of the Company. These are disclosed in the Company’s reports filed from time to time
with the Securities and Exchange Commission, including its most recent Form 10-K and any subsequent filings on Forms 10-Q or 8-K, available at
www.sec.gov. Readers are urged not to place undue reliance on these forward-looking statements, which speak only as of the date of this press release.
The Company does not intend to update any forward-looking statement contained in this press release to reflect events or circumstances arising after the
date hereof.

Included within this presentation are non-GAAP financial measures that supplement the Condensed Consolidated Statements of Operations of the
Company prepared under generally accepted accounting principles (GAAP). Reconciliations of GAAP to non-GAAP amounts for the periods presented
herein are provided in schedules accompanying this presentation and should be considered together with the Condensed Consolidated Statements of
Operations. These non-GAAP measures are not meant as a substitute for GAAP, but are included solely for informational and comparative purposes. The
Company's management believes that this information can assist investors in evaluating the Company's operational trends, financial performance, and
cash generating capacity. Management believes these non-GAAP measures allow investors to evaluate the Company’s financial performance using some
of the same measures as management. However, the non-GAAP financial measures should not be regarded as a replacement for or superior to
corresponding, similarly captioned, GAAP measures and may be different from non-GAAP financial measures used by other companies.

Information contained in this presentation concerning the industry and the markets in which the Company operates, including the Company’s general
expectations and market position, market opportunity and market size, is based on reports from various third-party sources, assumptions that the
Company has made based on information in such reports and the Company’s knowledge of the market for its platform. Although the Company believes
such third-party sources to be reliable, the Company has not independently verified the information and cannot guarantee its accuracy and
completeness.
Third Quarter 2018 Investor Presentation, November 8, 2018 - Investor Relations
What we do
     We provide a platform
         for ad buyers.
      Most buyers are ad
       agencies or other
    technology companies.

3
Third Quarter 2018 Investor Presentation, November 8, 2018 - Investor Relations
May 2011                                        $.08 Day*.
                            2012                                         First $1MM Month*.
                            2014                                         First $1MM Day*.
                            2015                                         First $2MM and $3MM Day*.
                            2016                                         First $100MM Month*
                            2017                                         First $5MM Day and $200MM Month*
                          We’ve been profitable since 2013.
     2015: $114MM in Revenue, $16MM in Adj. Net Income and $39MM in Adj EBITDA.
     2016: $203MM in Revenue, $35MM in Adj. Net Income and $65MM in Adj EBITDA
    2017: $308MM in Revenue, $70MM in Adj. Net Income and $24.4MM in Adj. EBITDA

     * Total spend on platform
4    Adjusted Net Income and EBITDA typically excludes items such as depreciation and amortization expense, interest expense, income taxes, stock-based compensation, preferred stock
     warrant liabilities and follow-on offering costs. Reconciliation for Adjusted Net Income and Adjusted EBITDA can be found in the Company’s SEC Filings at www.thetradedesk.com.
Third Quarter 2018 Investor Presentation, November 8, 2018 - Investor Relations
Column1
                                                                                                                        by the numbers
             Revenue (1)                                                                    $464 E
                                                                                                                                     Gross Spend (2)
             ($ in millions)                                                                                                         ($ in millions)
                                                                              50%E

                                                                                                                                                                                                                    $1,556
                                                                                                                                                                                                       52%
                                                            52%
                                                                          $308

                                                                                                                                                                                              $1,027
                                                                                                                                                                                  86%
                                            78%         $203

                                                                                                                                                           161%          $552
                          156%         $114

                      $45                                                                                                                           $211

                    FY2014           FY2015            FY2016            FY2017          FY2018E                                                  FY2014                FY2015                FY2016                FY2017

     2009 $308 MM                                                            $1.556 BB                                          $70 MM                                 $95.5 MM                                       713
          founded                  2017 Revenue (2)                         2017 Gross Spend (2)                               2017 Adjusted                               2017 Adjusted                          Global
                                                                                                                                Net Income (2)                               EBITDA (2)                         employees (2)
5   (1)   FY2018E guidance of $464 million provided November 8, 2018, at The Trade Desk’s conference call for the period ended Sept. 30, 2018. The Trade Desk makes no commitment to update or refresh guidance after that date.
    (2)   Gross Spend, Revenue, Adjusted Net Income and Adjusted EBITDA from Company 10-K and Press Release issued on February 22, 2018. Reconciliations of GAAP to non-GAAP amounts for the periods presented herein are provided in schedules
          accompanying this presentation.
Third Quarter 2018 Investor Presentation, November 8, 2018 - Investor Relations
The most
      effective
    advertising is
      targeted.

6
Third Quarter 2018 Investor Presentation, November 8, 2018 - Investor Relations
937                      desktop ads
                                                  461                      mobile
                                                  180                      facebook ads
                                                   33                      video/TV ads
                                                    7                      ads audio
                                                    4                      search clicks
                                                    0                      print ads
    * Slides 7 and 8 present a hypothetical illustrative example of what an average consumer might experience during an
       average day and are based upon information from The Trade Desk, public sources, and management estimates.
7
Third Quarter 2018 Investor Presentation, November 8, 2018 - Investor Relations
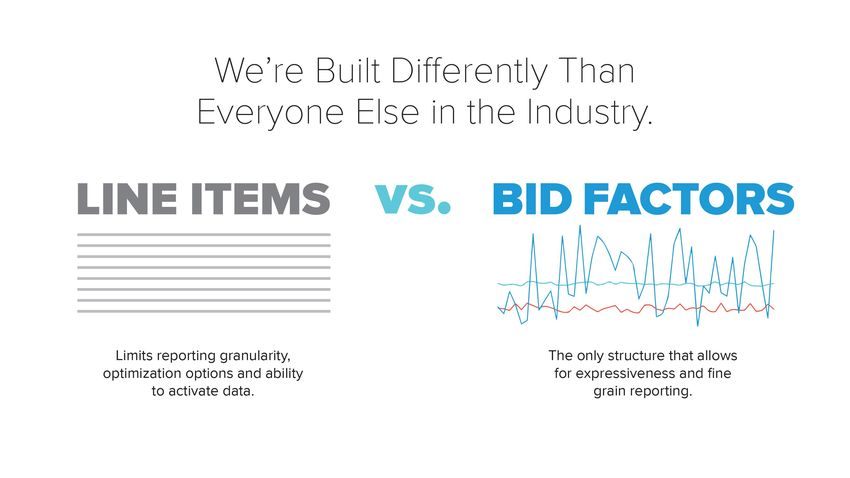
Example: How spend is divided.
                                                                   Digital Video/TV 5%
                                                          Audio
                                                           1%

                                                                                         Desktop
                                                                                          20%

                                                                                                                          Desktop
          Nearly all of the
       purchase data used                                                                            Mobile
                                                                                                                          Mobile
                                                                                                      10%
      was on products she                                                                                                 Search

          already bought.                                                                                                 Audio
                                                                   Search
                                                                    64%
                                                                                                                          Digital Video/TV

    * Slides 7 and 8 present a hypothetical illustrative example of what an average consumer might experience during an
8      average day and are based upon information from The Trade Desk, public sources, and management estimates.
Third Quarter 2018 Investor Presentation, November 8, 2018 - Investor Relations
There is a fundamental shift
     happening in advertising.
     And it’s bigger than just a move to digital.

9
Third Quarter 2018 Investor Presentation, November 8, 2018 - Investor Relations
The market.

10
Price discovery
     enables healthy
         markets.
11
We are targeting a massive market

                           ~$704B Total Global Ad Spending

                    ~$250B                                   We believe advertising will
                       Linear Television
                                                             be transacted digitally.

                                                             “
                ~$50B
               Display
                                                                 The future of all media is digital
                                                                 and programmatic… eventually all
                                                                 media will be digital and it will be
                                                                 transacted by machines.
12   Source: IDC, Estimated 2018 Global Ad Spending          - CEO of a Global Media Investment Management Group
The pie is getting bigger while waste is being pushed out.

                                           $1.00
                                Advertisers / Agencies

                        Self Serve Demand Side Platform (DSP)
                      Managed Service DSPs and Ad Networks

                                 Networks Exchange
                      Display   Mobile      Social       TV+
                                         Ad Server

                                    Data Platform

                         Supply Side Platform & Yield MGMT

                         Publishers / Sellers / Content Owners

                                     $0.40/$0.50
13
What we do
       Provide a self-service
     platform to agencies who
       deliberately pick from
     over 500 billion digital ad
        opportunities a day.

     95%+ of our spend comes through
                   MSAs
14
We provide agencies a
          SOFTWARE
          PLATFORM.
             We create room for
        their proprietary advantage.
     We are an enabler, not a disruptor.

15
We align agencies and their brands.

     SELL-SIDE     MARKETPLACE     BUY-SIDE

16
We are omnichannel.
     CTV, mobile, video, audio,
       display, social, native.

17
We buy advertising and data.

            We power some of the
         largest brands in the world…

         …through their agencies and
         digital solutions companies.

18
The Trade Desk is global.
            BELLEVUE
   SAN
FRANCISCO
                                                    LONDON
            SAN
            JOSE

                                                   MADRID    HAMBURG
                                  CHICAGO
             VENTURA                                                                    SEOUL

                                                        PARIS
                        BOULDER             NEW
                                            YORK                       SINGAPORE
                LOS
              ANGELES                                                                           TOKYO
                                                                                   SHANGHAI
      ALISO
      VIEJO
                                                                              HONG
                                                                              KONG

                                                                                    JAKARTA

                                                                                                    SYDNEY
We buy the whole internet.

     Even media that isn’t digital will be transacted digitally, using the internet.

20
We need to
      Agencies (and their   access their data
        brands) need a        to help them.
     technology partner
                                  We are the
      to trust with their      alternative to the
             data.            conflicted platform
                                   providers.

21
We buy data to make better decisions.
     We focus on being the best partner for our data providers.

22
Our technology.

23
We built a data          Our decisioning
                                technology
       management
       platform first.           3rd PARTY
     (data warehouse)              DATA
                                  LiveRamp,
                                                      TTD Data
                               BlueKai, IXI, etc.

        The buyer with the
      most data can make the            1ST PARTY DATA
                                         Site-based, CRM,
       most intelligent bid.                 Tier 1/2/3

                                               DMP

24
Expressiveness is central to our
        technological advantage.

25
26
Goal: The most transparent and most detailed reporting.
                        Simplified User Interface
                        “expressiveness” at work

27
                        Transparent Reporting
TTD + Agency reduced client’s booking costs by half.

                                          3.5

                                          3.0

     1.75x bid for stores                 2.5
        within 5 miles
      1x bid for stores                   2.0
     outside 5-15 miles
                                           1.5
        0x (no bid)
      outside 15 miles
                                           1.0

                                          0.5

                                          0.0
                                                 Start   30m   2h     24h     2d     4d     7d   14d   30d

                                                                    Time since last site visit

                      Expressiveness = 15,360 Bid Permutations
28
Our platform approach wins more of the budget.

         An example
         media plan.                                Agency

                   40%          20%             10%                 10%               10%             10%
                               Agency      Marketing and      Managed Service   Advertising         Data and
                                           Promotion          Programmatic      Software Solution   Technology
                            Trading Desk   Solution Company   Partner Company   Company             Company

                                                          Powered by
29
     Illustrative Example
Large brands have just started in programmatic.
                      Large advertiser total media spend (2017)                   Large advertiser programmatic media spend (2015-2017)

     $9.0
             $9B                                                               $140M
                           $8.0
     $8.0    $8B                                                                                                         $120M
                                                                               $120M
     $7.0    $7B

                                                                               $100M
     $6.0    $6B

     $5.0    $5B                                                               $80M
                                                                                                          $70M

     $4.0
             $4B
                                                                               $60M
             $3B
     $3.0
                                                                               $40M
             $2B                                                  $2.0                    $30M
     $2.0

             $1B                                                               $20M
     $1.0

             $0B
      $-                                                                         $M
                 Total Media Spend                          Digital spend                 2015            2016           2017

30    Source: The Trade Desk estimates for a large multi-national advertiser
The future
                                                                              of TV is
                                                                             ad funded.
                                                                           The cost of no ads is too
                                                                          great for most consumers.

31
     (Cable costs are according to the Leichtman Research Group, Inc.).
The view into our future.

                    1.     Connected TV
                    2.     Global expansion
                    3.     Expand the use of our APIs with more
                           technology-centric companies.
                    4.     Launched new User-Experience, Planning
                           tools and AI in 2018.

                         Continue to provide a platform where buyers
                         can objectively and precisely buy ads.

32
How Do We Manage
     Our Business?
     •   Client Retention
     •   Spend Growth
     •   Diversification
     •   Efficiency
33
Loyal and stable client base

                                                                    Annual Cohort Growth
                                                                    (Annual Gross Spend)

                                                               ~50% gross spend expansion in
                                                                2017 from existing customers
                                                                  95%+ customer retention

34
     The Trade Desk reports Cohort Growth on an annual basis
Customers and industries are broadly diversified.
                      Customer Concentration                                                                                  Industry Concentration

                                                                                                                                            14%
                                                                                                                      18%                                Technology & Computing

                                                                                                                                                         Food & Drink

                                                                                                                                                         Health & Fitness
                  In 2017, our 3 largest customers                                                         5%                                      13%
                                                                                                                                                         Automotive
                  accounted for 22%, 11% and 10%,
                                                                                                          5%                                             Personal Finance
                 respectively, of our Gross Billings.
                                                                                                                                                         Business
                                                                                                            5%
                                                                                                                                                         Style & Fashion
                                                                                                                                                  13%
                                                                                                                 8%                                      Home & Garden

                                                                                                                                                         Travel
                                                                                                                             10%           10%                (1)
                                                                                                                                                         Other

(Based on Gross Spend and our classification of the purchasers of advertising through our customers).
   35 includes: Arts & Entertainment, Shopping, Family & Parenting, Education, Law, Gov’t & Politics, Hobbies & Interests, Pets, Sports,
1. Other
Careers, Real Estate, Science, Society, Religion & Spirituality, News and Other.
Strong financial model.

                •   Exceptional top line growth

                •   MSA-based model with ongoing,
                    established customer relationships

                •   Self-serve software model drives strong
                    operating leverage

                •   Proven profitability

36
Robust revenue growth…
                                                                                                         Revenue(1)
                    79% 5-year Estimated CAGR                                                            ($ in millions)
                                                                                                                                Column1

                                                                                                                                                                                                         $147.0 E

                                                        50%E       $464 E                                                                                                                           $118.8

                                                                                                                                                                                                $112.3
                                                                                                                                                                                       $102.6
                                           52%
                                                     $308                                                                                                                                   $85.7
                                                                                                                                                                                    $79.4
                              78%                                                                                                                                  $72.4        $72.8

                                       $203                                                                                                              $53.0           $53.0
                                                                                                                                                     $47.2
               156%                                                                                                          $42.7
                         $114                                                                                           $28.8    $30.4
                                                                                                                    $24.5
                                                                                                           $18.5$18.0
            $45                                                                                        $11.2
                                                                                           $6.5   $8.4

                                                                                            Q114 Q214 Q314 Q414 Q115 Q215 Q315 Q415 Q116 Q216 Q316 Q416 Q117 Q217 Q317 Q417 Q118 Q218 Q318 Q418E
           FY2014      FY2015        FY2016         FY2017       FY2018E

37   (1)    FY2018E guidance of $464 million and Q4FY2018E guidance of $147 million provided Nov. 8, 2018, at The Trade Desk’s conference call for the period ended Sept. 30,
            2018. The Trade Desk makes no commitment to update or refresh guidance after that date.
Robust operating model…
                                        120
            (% of Revenue)                                               Operating Income Margin and Expenses

                                        100
                                                                                                       Investments for               Investments for
                                                                                                        future growth                 future growth
                                                                          31pt Margin
                                         80                                Expansion

                                         60

                                         40

                                         20

                                           0
                                                               2014                            2015                       2016                             2017
                                                   Platform Operations   Sales and Marketing     Technology and Development   General and Administrative   Operating Margin

38   (1)   Company Sources. 10-K filed on February 22, 2018,
…delivering substantial profitability

                            Adj. EBITDA ($ in millions)                                                                                                   GAAP Net Income ($ in millions)
                                                                                         $36.9
                                                                            $39.5
                                                                                                                                                                                                                      $20.3
                                                                                                $36.6
                                                                                                                                                                                               $18.8              $19.3
                                                 $29.7                                                                                                                                                    $16.8
                                                          $25.3
                                                                      $24.4

                                        $16.6                                      $19.8                                                                                              $11.1
                      $18.7                                                                                                                                                                            $10.2
                                    $15.7                                                                                                                                                                      $9.1
                                                                                                                                                                        $7.6
                   $9.3                                                                                                                                     $5.7
                                                                                                                                                     $4.6                      $3.6           $4.9
            $7.4                                                                                                                              $3.9
                                                         $6.3
     $3.7                     $4.3
                                                                                                                                       $1.8

                                                                                                                                                                   -$1.0
     Q115 Q215 Q315 Q415 Q116 Q216 Q316 Q416 Q117 Q217 Q317 Q417 Q118 Q218 Q318                                                        Q115 Q215 Q315 Q415 Q116 Q216 Q316 Q416 Q117 Q217 Q317 Q417 Q118 Q218 Q318

        Source: Company Filings. Adjusted EBITDA excludes depreciation and amortization expense, interest expense, income taxes, stock-based compensation and
39      preferred stock warrant liabilities. Reconciliations of GAAP to non-GAAP amounts for the periods presented herein are provided in schedules accompanying this
        presentation.
Investment highlights.

     1.   95%+ of our spend coming through MSAs and is relatively predictable.
     2.   We’re self-service omnichannel (all decisioned digital).
     3.   Our revenue grew by 52% y/y in 2017, 78% in 2016 and 156% in 2015.
     4.   Our Q2 2018 and Q3 2018 y/y growth rates of 54% and 50% EQUALED the
          growth rate of the prior year
     5.   Our tech is measurably better at decisioning.
     6.   We have a massive TAM.
     7.   We align our interests with our customer (buy-side only, not network).
     8.   We’ve been profitable since 2013.

                         TTD is an investment in the whole internet.

40
Supplemental Non-GAAP Information
                                             Non-GAAP Financial Metrics
                                   (Amounts in thousands, except per share amounts)

         The following tables show the Company’s GAAP financial metrics reconciled to non-GAAP financial metrics
                                             included in this presentation.

                                                                    Three Months Ended          Nine Months Ended
                                                                       September 30,               September 30,
                                                                    2018          2017          2018          2017

            Net income                                          $   20,292    $   10,229    $   48,705    $   33,987
            Add back:
               Depreciation and amortization expense                 3,277         1,968         8,107         5,157
               Stock-based compensation expense                     11,417         5,893        27,958        12,406
               Interest expense (income), net                         (237 )         513          (113 )       1,290
               Secondary offering costs                                 —             —             —          1,523
               Provision for income taxes                            1,813         5,825         7,728         1,602
            Adjusted EBITDA                                     $   36,562 $      24,428    $   92,385 $      55,965

                                                                    Three Months Ended          Nine Months Ended
                                                                       September 30,              September 30,
                                                                    2018          2017          2018          2017
            GAAP net income                                     $   20,292    $   10,229    $   48,705    $   33,987
            Add back (deduct):
              Stock-based compensation expense                      11,417         5,893        27,958        12,406
              Secondary offering costs                                  —             —             —          1,523
              Adjustment for income taxes                           (1,528 )        (846 )      (3,918 )      (1,772 )
            Non-GAAP net income                                 $   30,181 $      15,276 $      72,745 $      46,144

            GAAP diluted EPS                                    $      0.44   $      0.23   $      1.07   $      0.77
            Non-GAAP diluted EPS                                $      0.65   $      0.35   $      1.60   $      1.05

            Weighted average shares outstanding—diluted             46,576        44,245        45,460        43,919
41
You can also read