This manuscript is a preprint and will be submitted to a peer-review journal soon. Subsequent versions of this manuscript may have slightly ...
←
→
Page content transcription
If your browser does not render page correctly, please read the page content below
----------------------------------------------------------------------------------------------------
 This manuscript is a preprint and will be submitted to a peer-review journal soon.
 Subsequent versions of this manuscript may have slightly different content after a
  peer review. If accepted, the final version of this manuscript will be available via
 the ‘Peer-reviewed Publication DOI’ link on the right-hand side of this webpage.
       Please feel free to contact any of the authors; we welcome any feedback.
----------------------------------------------------------------------------------------------------
Lockdown caused by COVID-19 pandemic reduces air pollution in cities
worldwide

Asheshwor Man Shrestha1, Uttam Babu Shrestha1,*, Roshan Sharma2, Suraj Bhattarai1, Hanh
Ngoc Thi Tran3, Maheswar Rupakheti4

1
    Global Institute for Interdisciplinary Studies, Kathmandu, Nepal
2
    Centre for Urban Research, RMIT University, Melbourne, VIC, Australia
3
    School of Marketing and Management, The University of Adelaide, Adelaide, SA, Australia
4
    Institute for Advanced Sustainability Studies, Potsdam, Germany

*Corresponding author: Uttam Babu Shrestha (Email: ubshrestha@yahoo.com)

Abstract
Drastic measures such as lockdown taken by countries worldwide to contain spread of COVID-
19 have influenced air pollution dynamics substantially, at a planetary scale. Several media
reported the lockdown induced air pollution reduction based on quickly assembled satellite
observations. However, a global-scale analysis of such reduction in air pollution backed by
quality data collected from ground stations across the world and the effects of lockdown to it are
missing. Here, we investigate changes in concentrations of six air pollutants: PM2.5, PM10, O3,
SO2, CO, and NO2 in 40 cities between February, March 2019 and 2020. The mean monthly
concentrations of PM2.5 and PM10 in February and March of 2020 were found consistently lower
than in 2019 in most of the cities. After lockdown, declines of anthropogenic pollutants such as
NO2, CO, PM2.5 and PM10 concentrations were seen in 19, 9, 8 and 7 cities respectively.
Improvement in air quality following lockdown was observed in the world's most polluted cities
including Bangalore, Beijing, Bangkok, Delhi, and Nanjing, as well as the world's major trade
centers including New York, London, Paris, Seoul, Sydney, and Tokyo. More visible reduction
of air pollution remains to be seen if the lockdown is prolonged. Nevertheless, such reductions
are expected to be temporary because the levels are likely to go up again once the situation gets
back to normal.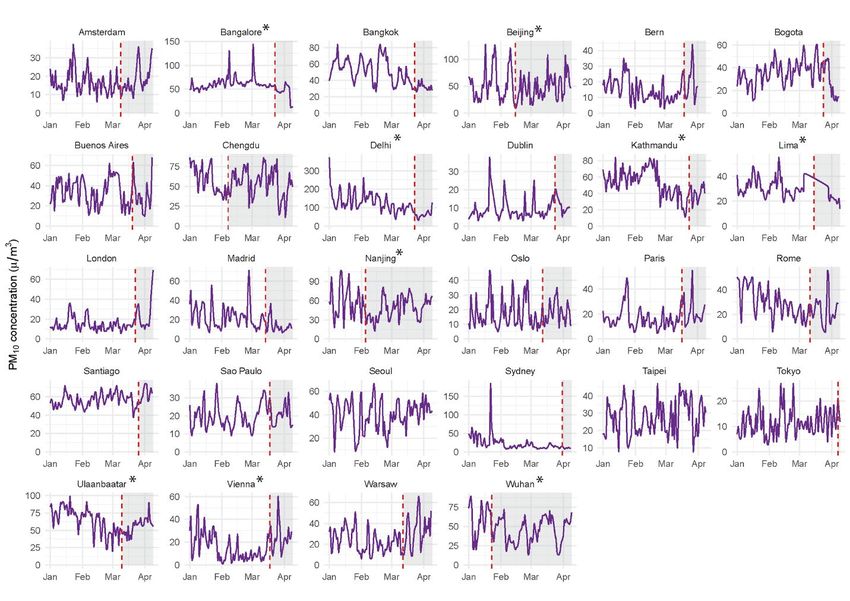
1. Introduction

The COVID-19 pandemic has impacted every aspect of human life and the global economy. As
of April 15, 2020, the coronavirus (COVID-19) has infected over 1.92 million people and caused
~127,000      deaths     in    185     countries     and     territories   across     the     world
(https://coronavirus.jhu.edu/map.html). The number of new cases and deaths is increasing at an
alarming rate with no signs of control yet, making the estimates of its economic and other
impacts uncertain. The global cost of the COVID-19 pandemic could range from $2.0 to 4.1
trillion, equivalent to a loss of between 2.3% and 4.8% of global gross domestic product (ADB
2020). It will make more than 25 million people unemployed by the end of 2020 depending on
how quickly the economy recovers in the second half of the year and how effectively policy
measures will boost labour demand (ILO 2020).

Depending on the level of COVID-19 impact in each country, as well as country-specific
situations and capacity, the world's governments are adopting different levels of interventions
including travel restrictions and lockdown to contain the spread of the highly contagious virus.
The lockdown restricting movement of people and shutting down business and industrial
establishments was first imposed on January 23, 2020 in the city of Wuhan in China where the
first case of this deadly virus was reported and later followed by other countries (Jing 2020).
From March 25, 2020, India, the second-most populous country in the world with 1.3 billion
people, went into lockdown (Chandrashekhar 2020). Although lockdown ended in Wuhan, China
on April 8 after 76 days (Kuo 2020), more than 3.9 billion people or a half of the world’s
population living in 90 different countries around the world are currently under containment as a
measure to maintain social distancing (Sandford 2020). The extent of lockdown varies across
countries and cities around the world. Nonetheless, the lockdown has halted quite significantly
all forms of transport (flights, trains, automobiles), factories, shops, markets, and other economic
and social activities.

Despite the severe impacts of lockdown on people’s social life, global mobility and economy,
there are reports that lockdown has temporarily improved environmental conditions. For
example, the lockdown improved the air quality of the 103 cities in India — the most polluted
country in the world which has 21 out of the 30 world’s most polluted cities (Singh and
Chakraborty 2020). Air pollution is the single largest environmental health risk in the world; ca.
seven million people die prematurely every year globally as a result of exposure to air pollution,
more than 91% of the world’s population lives in places where air quality exceeds the World
Health Organization’s guidelines (WHO 2020). PM2.5 is a common cause for adverse health
outcomes such as chronic obstructive pulmonary disease (COPD) and lower respiratory infection
(LRI) causing death of nearly three million people globally (GBD 2018). NO2 is the leading
source of childhood asthma in urban areas globally (Achakulwisut et al. 2019). Likewise, acute
to chronic exposures to SO2, CO, and O3 can harm the human respiratory system, causing
breathing problems including occasional death (Chen et al. 2007, Brown 2009). Air pollution
also causes adverse impacts on society, economy, and the environment including climate change.
It is in fact a major public health, environmental and developmental challenge of our time
(Haines et al. 2017). Therefore, understanding this temporary improvement in air quality at the
planetary scale provides a unique opportunity to study processes and implications of policy
changes to reduce air pollution in future.

There are media reports, primarily based on satellite images, about reduction of air pollution due
to the lockdown globally, and some recent scientific studies conducted in a small number of
countries (He et al. 2020) and cities (Cadotte 2020) indicated such reductions. While satellite
images are useful to monitor air pollution, cautions should be taken to prevent the erroneous
interpretation of satellite images (see https://atmosphere.copernicus.eu/flawed-estimates-effects-
lockdown-measures-air-quality-derived-satellite-observations). To the best of our knowledge,
there is no global-scale examination of the impact of COVID-19 induced lockdown on air
quality. Here, we provide the first global insight on air pollution by utilizing vast networks of
ground-based air quality monitoring stations from 40 major cities from 35 countries across the
six continents. The air quality data is collected from 301 ground-based stations for February and
March of 2019 and 2020 to compare both monthly and yearly changes post-COVID lockdown.
We also examine the effect of lockdown on the daily concentrations of air pollutants of the last
100 days from January 1 to April 9, 2020.
2. Materials and Methods
2.1. Selection of the world’s cities
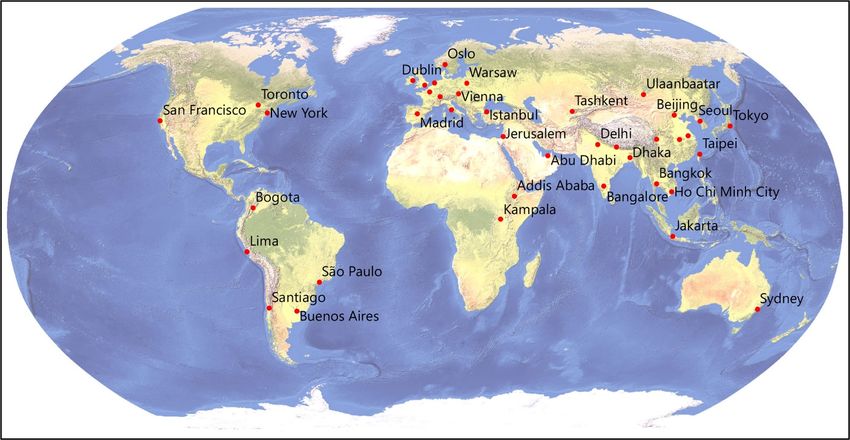
We selected 40 major cities around the world (Figure 1) based on (i) the historical level of air
pollution in the city (a mix of cities with dirty and clean air), (ii) reported COVID-19 cases in
that city (a mix of the high and low impacted city), (iii) geographical setting and developmental
stage (balance between high, middle, and low income countries of all continent), (iv) city
lockdown history (early and late beginnings of lockdowns), and (v) availability of air pollution
data. We used the World Air Quality Index portal (WAQI) (www.aqicn.org) to download daily
records from 301 air pollution monitoring stations spread across 40 selected cities of 35
countries. We deliberately exclude cities around the equator where air quality is often influenced
by the emissions from forest fires, and cities near the deserts that often get hit by sand and dust
storms. Therefore, most of the cities selected for this study are affected heavily by anthropogenic
emissions, and a reduction in air pollution is expected in those cities as a result of lockdown.
Figure 1.Selected cities used for analysis of changes in the concentrations of air pollutants.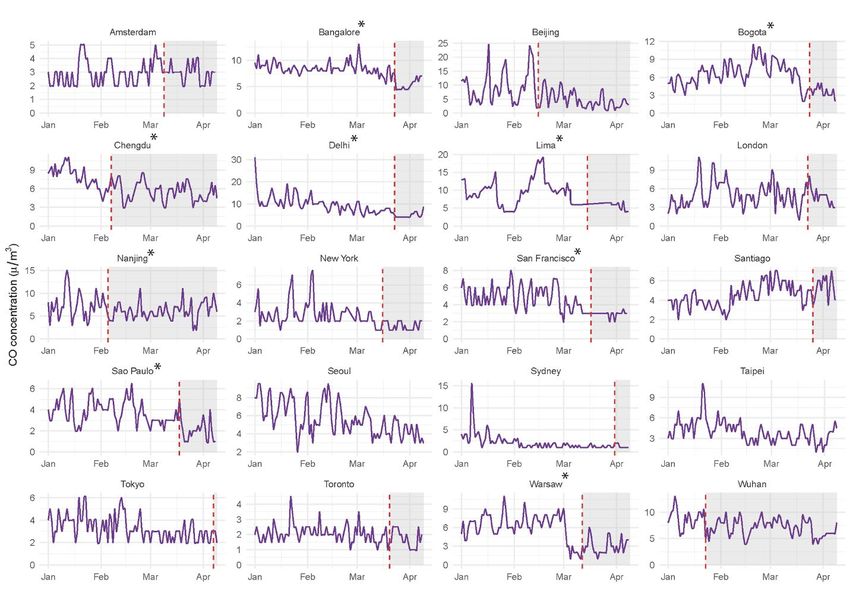
2.2. Selection of air pollutants

Normally, air quality is evaluated by measuring the atmospheric concentrations of six pollutants:
fine particulate matter (PM2.5, mass concentration of particles with diameters ≤2.5 um), coarse
particulate matter (PM10, mass concentration of particles with diameters ≤10 um), ground-level
ozone (O3), nitrogen dioxide (NO2), sulfur dioxide (SO2), and carbon monoxide (CO) (EPA
2014). All of them except O3 have primary sources, such combustion sources as the automobiles
and industries, while O3 is formed in the atmospheric from precursor gaseous species, emitted
mostly from primary sources, in presence of sunlight. Therefore, we selected PM2.5, PM10, NO2,
O3, SO2 and CO to investigate the changes in air quality among cities before and during
lockdowns.

       2.3. Data and analysis

We used publicly available air quality data provided by the World's Air Pollution: Real-time Air
Quality Index (WAQI project) which curates air quality data collected from >12,000 ground-
based air quality monitoring stations (primarily located at/near the US embassies and consulates)
situated in 1,000 major cities in more than 100 countries in six continents (https://aqicn.org/). It
must be noted that the data from WAQI are from the stations managed by government agency or
any institution of the respective country and may not be always fully validated. We used daily
concentrations of air pollutants collected from multiple WAQI stations where available for
further analysis (Table 1). We collected the lockdown dates for the selected cities from local and
global media reports (Table 1). By ‘lockdown’, we meant restrictions on vehicles, commercial
flights except for cargo and charter, and prohibitions of commercial activities, except for
essential services, resulting in a temporary shutdown of air pollution sources from these
activities. Although we cross-verified the accuracy of the starting dates of lockdown by looking
at multiple media reports, there may be some discrepancies due to any errors in media reporting
and differences in time zones. We assume air quality in February and March of 2019 was under
the business as usual conditions and hence considered normal and change in air quality in
February and March of 2020 is caused primarily due to the country-specific response to
containing the spread of COVID-19. Therefore, we compared the mean monthly concentration of
the six air pollutants of February and March of 2019 with February and March of 2020 using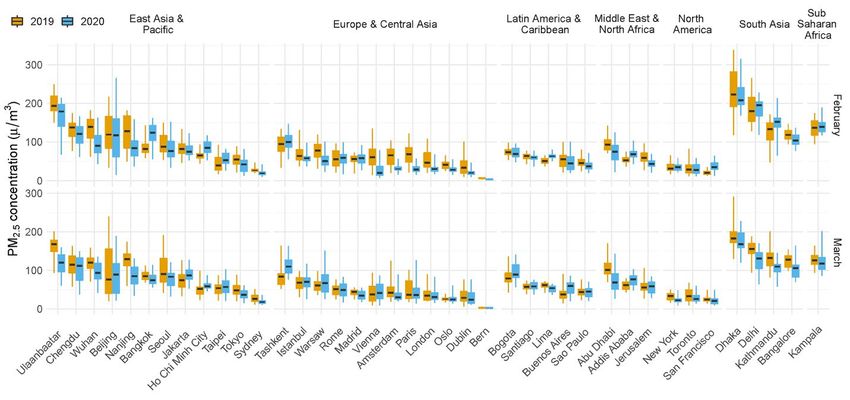
welch two sample t-test. As dates of lockdown vary, we also examined the daily changes in
concentrations of these air pollutants from January 1 to April 9 (100 days) to investigate the
effect of lockdown on their daily concentrations of air pollutants through linear regression using
lockdown as dummy variable.

   3. Results and discussions

A consistent reduction in PM2.5 concentration was observed among 17 cities in February 2020
compared to February 2019, and 14 cities (increase in Oslo, Vienna, Warsaw) in March 2020
than that of March 2019 (Figure 2). Maximum decline in mean monthly concentration of PM2.5
in February was observed in Vienna (-57.1%), Paris (-53.2%), Amsterdam (-47.5%), London (-
45.6%), and Dublin (-45.2%). It is worth mentioning here that in absolute term these cities
already have cleaner air, i.e., PM2.5 concentrations are very low compared to heavily polluted
cities. Likewise, in March, a maximum decline was seen in New York (-37.0%), Sydney (-
35.1%), Abu Dhabi (-32.4%), Nanjing (-31.3%), Ulaanbaatar (-25.6%). In the cities, where
anthropogenic activities are a major source of emissions of air pollutants sharp declines in the
PM2.5 levels were seen, notably in highly polluted cities like Bangalore, Bangkok, Beijing, Delhi,
Nanjing, Wuhan, Ulaanbaatar in Asia and also in developed cities like Madrid, New York, Paris,
Seoul, Sydney, Tokyo. In contrast, an increase in PM2.5 concentrations was observed in Addis
Ababa (lockdown on April 1 20202) and Ho Chi Minh City (lockdown on March 31, 2020). An
increase in February PM2.5 concentration and decrease in March in Bangkok and Kathmandu are
likely due to the lockdown that started in the last week of March. In regards to daily PM2.5
concentrations from January 1, 2020 to April 9, 2020, eight cities Amsterdam, Bangalore, Delhi,
Lima, Nanjing, New York, Ulaanbaatar, Wuhan showed significant decrease (linear regression, p
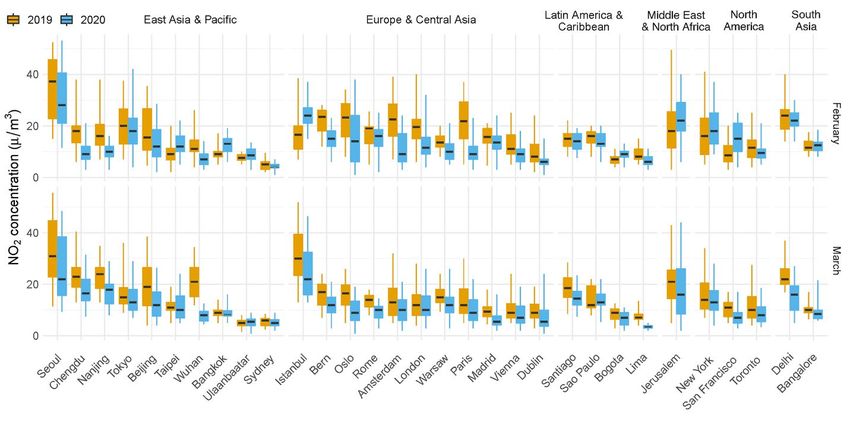
Figure 2. The box and whisker plots of daily average PM 2.5 concentrations during February-March 2020
and 2019. The top and bottom of each box represents 75th percentile and 25th percentile respectively and
the upper and lower whisker represents 90th percentile and 10th percentile respectively. The horizontal
bar in each box represents the median.
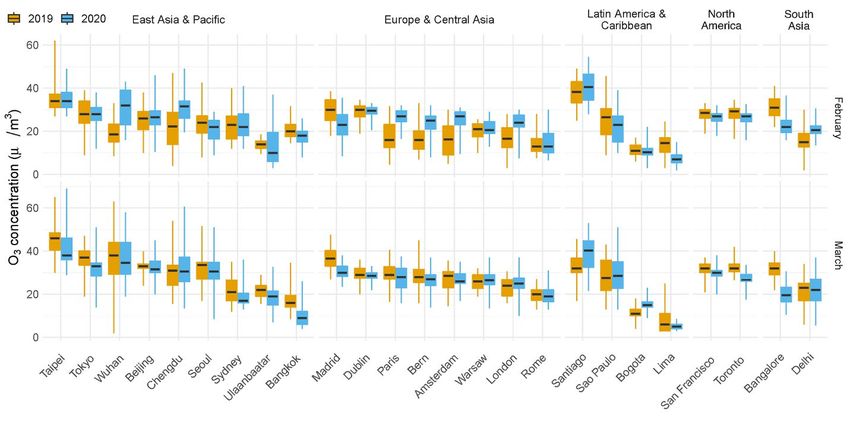
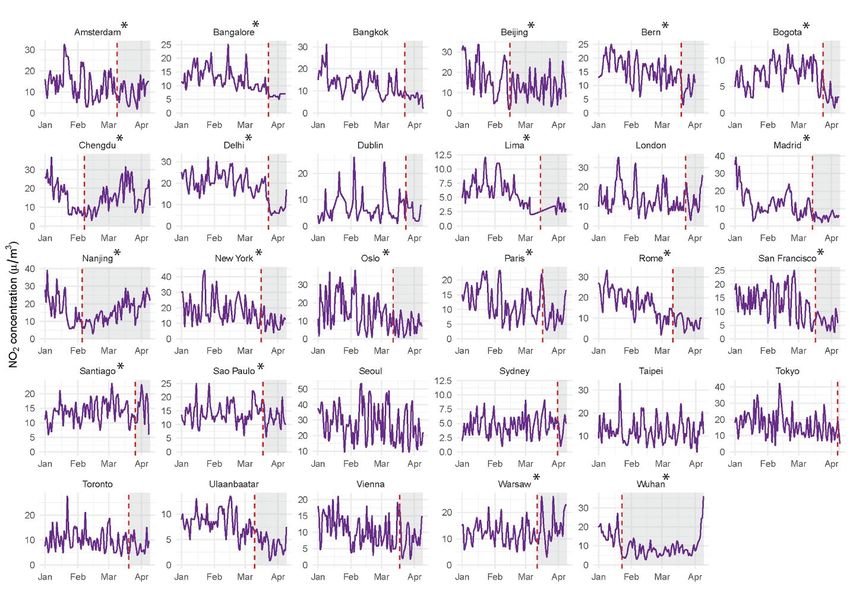
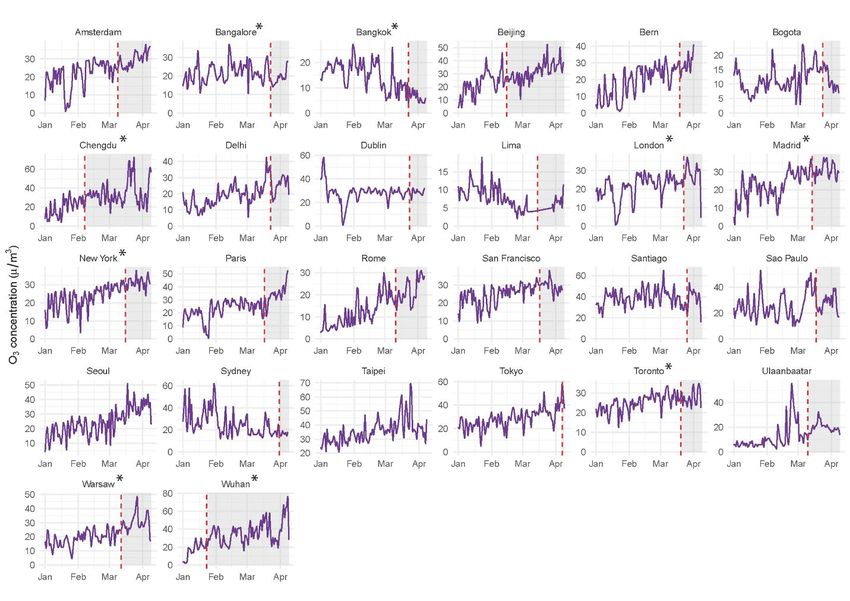
Figure 3. Time series of daily PM2.5 concentrations from January 1 to April 9, 2020 in 40 cities
across the globe. Vertical red dashed line shows the lockdown date and * denotes significant
linear trends.

Only 29 cities have complete PM10 concentrations data of which 16 cities showed a statistically
significant decline in PM10 in February 2020 compared to February 2019 and 11 cities showed
similar declines in March 2020 than in March 2019. Maximum decline in mean monthly
concentration of PM10 in February was observed in Vienna (-60.7%), Bern (-53.3%), Paris (-
52.7%), Warsaw (-45.9%) and Dublin (-44.3%). Maximum declines were seen in Ulaanbaatar (-
43.4%), Delhi (-32.5%), Nanjing (-31.8%), Wuhan (-26.8%), and Lima (-25.7%) in March. A
consistent decline in PM10 in both February and March of 2020 was observed in 7 cities:
Bangkok, Beijing, Lima, Nanjing, Tokyo, Ulaanbaatar and Wuhan (Figure 4). The time series of
daily PM10 concentrations of the last 100 days in 2020 showed that after the lockdown, a
statistically significant decrease in PM10 concentrations was observed in seven cities namely
Bangalore, Beijing, Delhi, Lima, Nanjing, Ulaanbaatar, and Wuhan while Kathmandu and
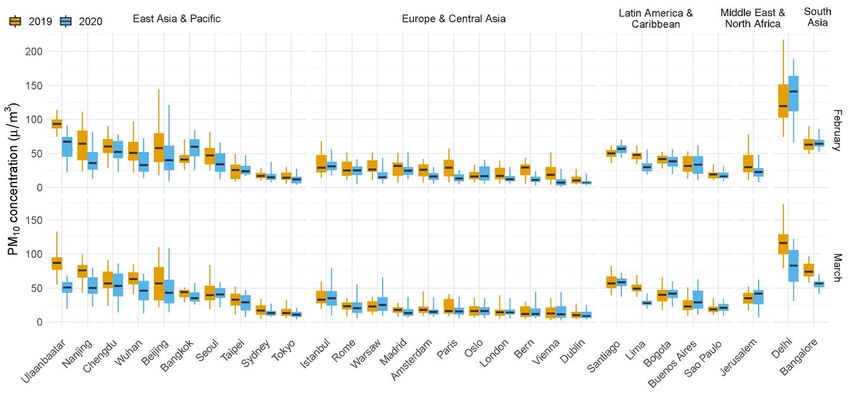
Vienna both saw increases (Figure 5). The local meteorology and seasonal forest fire might have
played a role in such increase, particularly stronger wind speeds lifting soil and road dust into air
in Kathmandu and stronger winds diluting PM10 concentration in February in Vienna.

Figure 4. The box and whisker plots of daily average PM10 concentrations during February-
March 2020 and 2019. The top and bottom of each box represents 75th percentile and 25th
percentile respectively and the upper and lower whisker represents 90th percentile and 10th
percentile respectively. The horizontal bar in each box represents the median.
Out of the 31 cities with complete data, decreased NO2 concentration in February and March
2020 was observed in 10 and 17 cities respectively (Figure 6). There are mixed trends (increases
in some cities while decreases in others) in NO2 for both months; an increase in four cities
Wuhan (+62.0% in February, +11.3% in March), Nanjing (+35.1% in February, +62.4% in
March), Chengdu (+30.9% in February, +73.9% in March), Warsaw (+4.0% in February, +8.2%
in March) while a decrease in five cities; Madrid (-33.3% in February, -47.5% in March, Paris (-

Figure 5. Time series of daily PM10 concentrations from January 1 to April 9, 2020 in 28 cities
across the globe. Vertical red dashed line shows the lockdown date and * denotes significant
linear trends.
Figure 6. The box and whisker plots of daily average NO2 concentrations during February-
March 2020 and 2019. The top and bottom of each box represents 75th percentile and 25th
percentile respectively and the upper and lower whisker represents 90th percentile and 10th
percentile respectively. The horizontal bar in each box represents the median.

33.1% in February, -5.6% in March), Oslo (-28.3% in February, -39.7% in March), Bern (-27.0%
in February, -19.1% in March), Vienna (-18.1% in February, -4.4% in March), Lima (-4.6% in
February, -26.7% in March). However, the significant decline (linear regression, p
Figure 7. Time series of daily NO2 concentrations from January 1 to April 9, 2020 in 29 cities
across the globe. Vertical red dashed line shows the lockdown date and * denotes significant
linear trends.

and Toronto (+17.8% in February, +3.6% in March) saw maximum increases. These mixed
trends were consistent even in daily O3 concentrations after lockdown; decrease in five cities
(Bangalore, Bangkok, Madrid, New York, Toronto) while increase in four (Chengdu, London,
Warsaw, Wuhan) cities (Figure 9). As O3 is a secondary air pollutant, the local availability of
precursor gases (nitrogen oxides and volatile organic compounds) and local meteorology
(sunlight and temperature) influences the production and destruction of O3 in air. These two
factors, particularly more incoming sunlight in March than February, are expected to vary widely
across the cities and continents, and hence the O3 concentrations too.
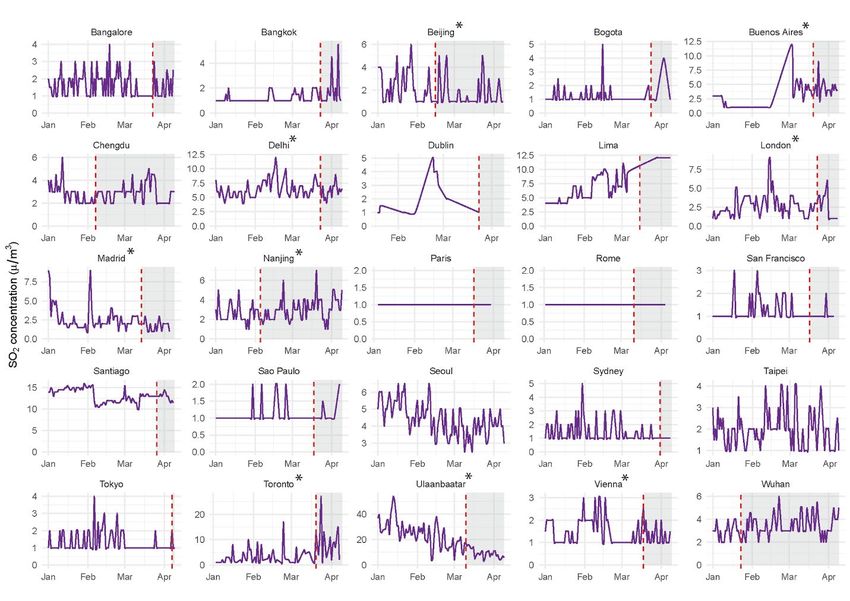
Figure 8. The box and whisker plots of daily average O3 concentrations during February-March
2020 and 2019. The top and bottom of each box represents 75th percentile and 25th percentile
respectively and the upper and lower whisker represents 90th percentile and 10th percentile
respectively. The horizontal bar in each box represents the median.
There is also a mixed trend in SO2 concentrations across cities; seven cities saw lower monthly
mean SO2 concentration in February 2020 compared to February 2019 and 12 cities have
declining SO2 in March 2020 compared to March 2019 (Figure 10). In contrast, four cities
(Bangalore, Istanbul, Santiago, Ulaanbaatar) in February 2020 and five cities (Istanbul, London,
Santiago, Ulaanbaatar, Toronto) in March 2020 had higher SO2 concentrations. Maximum
decline in SO2 was observed in Lima (-75.2%), followed by Nanjing (-38.9%) and Beijing (-
36.8%) in February 2020 and Bogota (-64.8%) observed a maximum decline followed by Lima
(-60.4%) and Nanjing (-53.3%) in March 2020. The daily SO2 concentration also showed mixed
trends; after the lockdown, statistically significant decrease in five cities (Beijing, Delhi, Madrid,
Nanjing, Vienna) and increase in 4 cities (Buenos Aires, London, Toronto, Ulaanbaatar) (Figure
11).

Mean monthly CO concentrations of February 2020 in Amsterdam (-35.1%), London (-48.3%),
Lima (-27.3%), Nanjing (23.8%), Seoul (-13.4%), Chengdu (-29.1%) were lower while higher in
Bangalore (+14.8%), Bogota (+15.8%), Istanbul (+171.0%), Jerusalem (+465.2%), San
Francisco (+22.6%), Taipei (24.3%), Warsaw (+28.1%) than that of February 2019 (Figure 12).
In March 2020, CO concentrations decreased in 14 cities (Bangalore, Beijing, Bogota, Chengdu,
Delhi, Lima, London, Nanjing, New York, San Francisco, Sao Paulo, Seoul, Toronto, Warsaw)
while consistently increased in Istanbul. Daily CO concentration has significantly declined in
seven cities namely (Bangalore, Bogota, Chengdu, Delhi, Lima, Nanjing, San Francisco, Sao
Paulo) after the lockdown (Figure 13).

Figure 9. Time series of daily O3 concentrations from January 1 to April 9, 2020 in 26 cities
across the globe. Vertical red dashed line shows the lockdown date and * denotes significant
linear trends.

Several other factors could have caused the mixed trends of pollutants such as O3 and SO2. First,
the variation in the source of pollutants; some of the major sources of SO2 are big coal-fired
power plants that might not have been shut down during lockdown and hence SO2 concentrations
in the city would not have gown down. The seasonal forest fires in South Asia and Southeast
Asia may have also influenced the air pollutant concentrations in those cities. Second, local
weather can significantly affect pollution levels–higher wind speeds tend to dilute air pollutants
and rainfall can wash out pollutants from air. In some cities like Delhi and Bangkok, road
vehicles are a major source of PM2.5. Additionally, the high pollution level in early March prior
to lockdown could have kept the monthly mean values of March this year in some cities
unchanged even after shutting down traffic, businesses, and industries. In these cities, sharp
decline in levels of pollutant due to lockdown is more noticeable. However, in some European
cities where the sources of pollution are more varied such as from residential and commercial
buildings, industrial activities, and road traffic, the changes are less apparent as such emissions
could have continued despite lockdown. Furthermore, even if a city has a high contribution of
the pollutant from the transport, but if the selected stations are away from roads—the impact of
lockdown would be less noticeable. Emissions from natural sources such as forest fires and dust
are expected to make a small change in concentrations observed in the cities unless the cities are
located in or near to dominant natural sources like deserts and coasts.

Figure 10. The box and whisker plots of daily average SO2 concentrations during February-
March 2020 and 2019. The top and bottom of each box represents 75th percentile and 25th
percentile respectively and the upper and lower whisker represents 90th percentile and 10th
percentile respectively. The horizontal bar in each box represents the median.
Figure 11. Time series of daily SO2 concentrations from January 1 to April 9, 2020 in 25 cities
across the globe. Vertical red dashed line shows the lockdown date and * denotes significant
linear trends.

We observed consistent decrease in particulate matters (PM2.5, PM10) and NO2 in cities like
Bangalore, Beijing, Bern, Delhi, Lima, London, Madrid, New York, Paris, Seoul, Sydney,
Tokyo, Ulaanbaatar, Vienna. Ozone (O3) increased primarily in developed cities like
Amsterdam, Bern, London, Madrid, New York, and Paris with few exceptions such as in Delhi,
Wuhan, and Ulaanbaatar. A visible reduction of air pollution remains to be seen in cities like
Addis Ababa and Ho Chi Minh City where the lockdowns were imposed in late March-early
April. Evidence based on ground level stations shows reductions in concentrations of four major
air pollutants PM2.5, PM10, NO2 and CO in majority of the world cities due to almost
simultaneous lockdowns. As the higher resolution data becomes available in the future, in-depth
analysis considering other factors such as influence of weather should be conducted to generate
more precise estimates of this impact. Moreover, further investigations are required to quantify
proportional contributions of emission reduction versus changes in meteorological conditions,
and other benefits; health benefits such as lives saved due to, benefits to crops, and climate
benefits (e.g., masking of global warming due to aerosols, change in aerosol-induced
atmospheric warming, surface dimming or brightening) due to changes in air quality before and
after lockdown.

Figure 12. The box and whisker plots of daily average CO concentrations during February-
March 2020 and 2019. The top and bottom of each box represents 75th percentile and 25th
percentile respectively and the upper and lower whisker represents 90th percentile and 10th
percentile respectively. The horizontal bar in each box represents the median.

A number of previous studies have suggested that a swift and widespread implementation of
science-based clean air solutions would result in multiple benefits such as improved public
health, increased crop productivity, mitigating near-term climate change, and reduced socio-
economic costs due to improved air quality (e.g., UNEP, 2019). However, a simultaneous global
scale, even a regional or a national scale, implementation of such air pollution control measures
is almost next to impossible due to widely varying policy priorities of the countries around the
world. Lockdowns introduced to contain the COVID-19 have led to a near-simultaneous
shutdown of many sources of air pollutants at a global scale and has set a natural condition to
examine the planetary scale reduction in air pollution albeit temporarily, and with massive
suffering and socio-economic costs.
This study provides the first insight on global scale pollution reduction caused by COVID-

Figure 13. Time series of daily CO concentrations from January 1 to April 9, 2020 in 20 cities
across the globe. Vertical red dashed line shows the lockdown date and * denotes significant
linear trends.

lockdown using comprehensive air pollution data collected from 301 stations located in 40 cities
in 6 continents. Though the reduction is expected to be short-lived, it provides us encouraging
evidence that a swift and widespread implementation of air pollution measures, as proposed by
several scientific studies, can result in immediate air quality benefits. Yet, there is nothing to
celebrate as the COVID-19 pandemic has taken an enormous toll on humanity and nobody
wanted air pollution reduction this way. However, it is worth to note that the similar enormous
damage has been caused by air pollution globally especially in the developing countries for at
least last two decades which demands actions to reduce air pollution.
The majority of the pre-existing health conditions such as respiratory and cardiovascular diseases
that increase the risk of death for COVID-19 are the same diseases that are affected by long-term
exposure to air pollution. In fact, air pollution aggravates the COVID-19 death rate (Wu et al.
2020). There are clear health benefits of air pollution reduction, including saving lives even
during pandemic like COVID-19. The importance of continuing to enforce existing air pollution
control regulations to protect human health both during and after the COVID-19 crisis cannot be
and should not be ignored. While the enormous outpouring of support and global solidarity was
seen that spurs numerous actions to mitigate, control, and eradicate COVID-19 pandemic, it is
equally essential to show a similar level of urgency, solidarity and actions to address the great
chronic environmental disasters of air pollution, a silent killer of approximately seven million
people worldwide every year.

References

   1. Achakulwisut, P., Brauer, M., Hystad, P., & Anenberg, S. C. (2019). Global, national,
       and urban burdens of paediatric asthma incidence attributable to ambient NO2 pollution:
       estimates from global datasets. The Lancet Planetary Health, 3(4), e166-e178.
       https://doi.org/10.1016/S2542-5196(19)30046-4
   2. ADB (2020). Developing Asia Growth to Fall in 2020 on COVID-19 Impact, News
       Release, Asian Development Bank (ADB), https://www.adb.org/news/developing-asia-
       growth-fall-2020-covid-19-impact (Date accessed: April 6, 2020)
   3. Brown, J. S. (2009). Acute effects of exposure to ozone in humans: how low can levels
       be and still produce effects?. American journal of respiratory and critical care medicine,
       180(3), 200-201. https://doi.org/10.1164/rccm.200906-0834ED
   4. Cadotte, M. (2020, March 30). Early evidence that COVID-19 government policies
       reduce urban air pollution. https://doi.org/10.31223/osf.io/nhgj3
   5. Chandrashekhar, V. (2020) 1.3 billion people. A 21-day lockdown. Can India curb the
       coronavirus? Science doi:10.1126/science.abc0030
   6. Chen, T. M., Kuschner, W. G., Gokhale, J., & Shofer, S. (2007). Outdoor air pollution:
       nitrogen dioxide, sulfur dioxide, and carbon monoxide health effects. The American
journal of the medical sciences, 333(4), 249-256. https://doi.org/10.1097/MAJ.0b013e31803b900f 7. Environmental Protection Agency (2014). Air Quality Index: A Guide to Air Quality and Your health. U.S. Environmental Protection Agency, Office of Air Quality Planning and Standards, https://www3.epa.gov/airnow/aqi_brochure_02_14.pdf 8. GBD 2017 Risk Factor Collaborators. (2018). Global, regional, and national comparative risk assessment of 84 behavioural, environmental and occupational, and metabolic risks or clusters of risks for 195 countries and territories, 1990–2017: a systematic analysis for the Global Burden of Disease Study 2017. Lancet (London, England), 392(10159), 1923. https://doi.org/10.1016/S0140-6736(18)32225-6 9. He, G., Pan, Y., & Tanaka, T. (2020). COVID-19, City Lockdown, and Air Pollution: Evidence from China. medRxiv. https://doi.org/10.1101/2020.03.29.20046649 10. Haines, A., Amann, M., Borgford-Parnell, N., Leonard, S., Kuylenstierna, J., & Shindell, D. (2017). Short-lived climate pollutant mitigation and the Sustainable Development Goals. Nature Climate Change, 7(12), 863-869. 11. ILO (2020). ILO Monitor 2nd edition: COVID-19 and the world of work, Updated estimates and analysis https://www.ilo.org/wcmsp5/groups/public/@dgreports/@dcomm/documents/briefingnot e/wcms_740877.pdf (Date accessed: April 9, 2020) 12. Jing, G.(2020). Diary of a life in locked-down Wuhan https://www.bbc.com/news/world- asia-china-51276656 (Date accessed: April 1, 2020) 13. Kuo L. (2020) Liberation' as Wuhan's coronavirus lockdown ends after 76 days https://www.theguardian.com/world/2020/apr/07/liberation-as-wuhans-coronavirus- lockdown-ends-after-76-days (Date accessed: April 9, 2020) 14. Sandford, A. (2020). Coronavirus: Half of humanity now on lockdown as 90 countries call for confinement https://www.euronews.com/2020/04/02/coronavirus-in-europe- spain-s-death-toll-hits-10-000-after-record-950-new-deaths-in-24-hou (Date accessed: April 9, 2020) 15. Singh, R. K. & Chakraborty, D. (2020). Singh World’s Dirtiest Air Gets Cleaner After India’s Lockdown https://www.bloomberg.com/news/articles/2020-04-07/world-s- dirtiest-air-gets-cleaner-after-india-s-lockdown (Date accessed: April 9, 2020)
16. UNEP (2019). Air pollution in Asia and the Pacific: Science-based solutions, 1-250,
   UNEP, Nairobi, Kenya.
17. WHO (2020) Air Pollution http://www9.who.int/airpollution/en/ (Date accessed: April 8,
   2020)
18. Wu, X., Nethery, R. C., Sabath, B. M., Braun, D., & Dominici, F. (2020). Exposure to air
   pollution    and    COVID-19      mortality    in   the    United    States.   medRxiv.
   https://doi.org/10.1101/2020.04.05.20054502
Table 1. Description of the selected cities and news links of the lockdown information
    City        Country         Region*        Income group*      Number       Lockdown    Lockdown                     News Source
                                                                     of          Start        End
                                                                  stations
Abu Dhabi      United Arab    Middle East &   High income             1        5/04/2020    On going   https://www.outlookindia.com/outlooktraveller/t
               Emirates       North Africa                                                             ravelnews/story/70181/uae-begins-24-hour-
                                                                                                       lockdown-for-two-weeks-from-april-5-to-contain-
                                                                                                       the-covid-19
Addis          Ethiopia       Sub-Saharan     Low income              1        1/04/2020    On going   https://www.aljazeera.com/news/2020/04/ethio
Ababa                         Africa                                                                   pia-declares-state-emergency-fight-covid-19-
                                                                                                       200408142519485.html

Amsterdam      Netherlands    Europe &        High income             5        9/03/2020    On going   https://metro.co.uk/2020/03/19/trip-
                              Central Asia                                                             amsterdam-showed-government-not-enough-
                                                                                                       protect-us-coronavirus-12419537/

Bangalore      India          South Asia      Lower middle            5        23/03/202    On going   https://en.wikipedia.org/wiki/2020_coronavirus_
                                              income                               0                   pandemic_in_India
Bangkok        Thailand       East Asia &     Upper middle            4        23/03/202    On going   https://www.ctvnews.ca/health/coronavirus/thail
                              Pacific         income                               0                   and-imposes-state-of-emergency-to-control-
                                                                                                       coronavirus-1.4865483

Beijing        China          East Asia &     Upper middle           26        15/02/202   24/03/202   https://www.forbes.com/sites/siminamistreanu/2
                              Pacific         income                               0           0       020/03/27/beijing-has-defeated-coronavirus-
                                                                                                       what-it-was-like-living-in-the-locked-down-city-
                                                                                                       for-two-months/#
Bern           Switzerland    Europe &        High income             1        19/03/202    On going   https://www.swissinfo.ch/eng/covid-19_bern-in-
                              Central Asia                                         0                   the-time-of-coronavirus/45625916
Bogota         Colombia       Latin           Upper middle           14        24/03/202    On going   https://www.aa.com.tr/en/americas/national-
                              America &       income                               0                   lockdown-starts-in-colombia-amid-
                              Caribbean                                                                protests/1779226
Buenos         Argentina      Latin           Upper middle            1        20/03/202    On going   https://www.latinfinance.com/daily-
Aires                         America &       income                               0                   briefs/2020/3/31/argentina-braces-for-gradual-
                              Caribbean                                                                economic-recovery-after-lockdown
Chengdu China East Asia & Upper middle 10 2/07/2020 On going http://society.people.com.cn/n1/2020/0207/c100
Pacific income 8-31576755.html
Delhi India South Asia Lower middle 14 23/03/202 On going https://en.wikipedia.org/wiki/2020_coronavirus_
income 0 pandemic_in_India
Dhaka Bangladesh South Asia Lower middle 1 26/03/202 On going https://www.aa.com.tr/en/asia-pacific/covid-19-
income 0 bangladesh-extends-shutdown-until-april-
11/1786610
Dublin Ireland Europe & High income 2 24/03/202 On going https://en.wikipedia.org/wiki/2020_coronavirus_
Central Asia 0 pandemic_in_the_Republic_of_Ireland#COVID-
related_offences
Ho Chi Minh Vietnam East Asia & Lower middle 1 31/03/202 On going https://www.voanews.com/science-
City Pacific income 0 health/coronavirus-outbreak/vietnam-latest-lock-
down-while-us-braces-huge-death-toll
Istanbul Turkey Europe & Upper middle 4 2/04/2020 On going https://en.qantara.de/content/turkey-mayor-
Central Asia income urges-lockdown-for-istanbul
Jakarta Indonesia East Asia & Lower middle 3 10/04/202 On going https://www.thestar.com.my/news/regional/202
Pacific income 0 0/04/08/jakarta-to-impose-partial-lockdown-on-
april-10
Jerusalem Israel Middle East & High income 3 7/04/2020 On going https://www.i24news.tv/en/news/israel/158619
North Africa 2909-israel-s-netanyahu-announces-new-anti-
coronavirus-restrictions
Kampala Uganda Sub-Saharan Low income 1 30/03/202 On going https://www.kfm.co.ug/entertainment/photos-
Africa 0 empty-streets-of-kampala-after-lockdown.html
Kathmandu Nepal South Asia Low income 4 24/03/202 On going https://nep123.com/covid-19-kathmandu-valley-
0 wears-a-disserted-look-with-lockdown-
enforcement/
Lima Peru Latin Upper middle 11 15/03/202 On going https://www.miningmagazine.com/covid-
America & income 0 19/news/1383191/covid-19-lock-down-affects-
Caribbean miners-in-peru
London United Europe & High income 20 23/03/202 On going https://www.nytimes.com/2020/03/24/world/eu
Kingdom Central Asia 0 rope/britain-coronavirus-lockdown.html
Madrid Spain Europe & High income 4 14/03/202 On going https://en.as.com/en/2020/03/26/other_sports/
Central Asia 0 1585233133_070352.htmlNanjing China East Asia & Upper middle 3 5/02/2020 On going https://en.wikipedia.org/wiki/2020_Hubei_lockdo
Pacific income wns
New York United North High income 12 16/03/202 On going https://news.sky.com/story/coronavirus-new-
States America 0 york-and-la-on-lockdown-as-world-reacts-to-
spread-of-covid-19-11958145
Oslo Norway Europe & High income 3 12/03/202 On going https://en.wikipedia.org/wiki/2020_coronavirus_
Central Asia 0 pandemic_in_Norway
Paris France Europe & High income 11 17/03/202 On going https://www.aa.com.tr/en/europe/parisians-
Central Asia 0 vacate-city-ahead-of-covid-19-lockdown/1769664
Rome Italy Europe & High income 10 11/03/202 On going https://www.repubblica.it/politica/2020/03/11/
Central Asia 0 news/coronavirus_conte_italia_governo_misure-
250988471/?ref=RHPPTP-BL-I250988111-C12-
P1-S1.12-T1
San United North High income 7 17/03/202 On going https://www.aa.com.tr/en/americas/us-san-
Francisco States America 0 francisco-under-3-week-coronavirus-lock-
down/1768830
Santiago Chile Latin High income 6 26/03/202 On going https://en.wikipedia.org/wiki/2020_coronavirus_
America & 0 pandemic_in_Chile#Government_response
Caribbean
Sao Paulo Brazil Latin Upper middle 14 18/03/202 On going https://www.aa.com.tr/en/americas/death-toll-in-
America & income 0 brazil-from-covid-19-rises-to-159/1785792
Caribbean
Seoul South Korea East Asia & High income 6 No On going
Pacific lockdown
Sydney Australia East Asia & High income 17 31/03/202 On going https://www.theguardian.com/australia-
Pacific 0 news/2020/apr/01/social-distancing-rules-
australia-lockdown-coronavirus-strict-new-laws-
legal-illegal-state-physical-restrictions-guidelines-
explained-nsw-victoria-qld-queensland-act-sa-wa-
two-person
Taipei Taiwan East Asia & High income 1 No On going
Pacific lockdown
Tashkent Uzbekistan Europe & Lower middle 1 24/03/202 On going http://www.china.org.cn/world/Off_the_Wire/202
Central Asia income 0 0-03/23/content_75850320.htmTokyo Japan East Asia & High income 20 7/04/2020 On going https://edition.cnn.com/2020/04/07/asia/japan-
Pacific coronavirus-state-of-emergency-intl-
hnk/index.html
Toronto Canada North High income 12 20/03/202 On going https://www.cbc.ca/news/canada/toronto/coron
America 0 avirus-covid-19-ontario-friday-online-learning-
1.5504109
Ulaanbaatar Mongolia East Asia & Lower middle 6 10/03/202 On going https://www.garda.com/crisis24/news-
Pacific income 0 alerts/321181/mongolia-government-places-
ulaanbaatar-and-other-cities-on-lockdown-due-to-
covid-19-march-10-update-7
Vienna Austria Europe & High income 12 18/03/202 On going https://metropole.at/coronavirus-in-austria/
Central Asia 0
Warsaw Poland Europe & High income 3 12/03/202 On going https://en.wikipedia.org/wiki/2020_coronavirus_
Central Asia 0 pandemic_in_Poland
Wuhan China East Asia & Upper middle 21 23/01/202 24/03/202 https://news.cgtn.com/news/2020-04-01/Study-
Pacific income 0 0 China-lockdown-may-have-blocked-700-000-
COVID-19-cases-PkzcYgVj32/index.html
Country specific classification of income group and region were adopted from the World Bank (https://blogs.worldbank.org/opendata/new-country-
classifications-income-level-2019-2020, accessed April 7, 2020).You can also read