Threat Analysis for Smart Homes - Article - MDPI
←
→
Page content transcription
If your browser does not render page correctly, please read the page content below
future internet

Article
Threat Analysis for Smart Homes †
Georgios Kavallieratos 1 , Nabin Chowdhury 1 , Sokratis Katsikas 1,2, *, Vasileios Gkioulos 1
and Stephen Wolthusen 1,3
 1    Department of Information Security and Communication Technology, Norwegian University of Science and
      Technology, 2815 Gjøvik, Norway; georgios.kavallieratos@ntnu.no (G.K.); nabinc@stud.ntnu.no (N.C.);
      vasileios.gkioulos@ntnu.no (V.G.); stephen.wolthusen@ntnu.no or stephen.wolthusen@rhul.ac.uk (S.W.)
 2    Open University of Cyprus, 33 Giannou Kranidioti, Latsia 2220, Cyprus
 3    Information Security Group, Royal Holloway University of London, Egham TW20 0EX, UK
 *    Correspondence: sokratis.katsikas@ntnu.no or sokratis.katsikas@ouc.ac.cy
 †    This paper is an extended version of our paper published in The Proceedings of the 1st International
      Workshop on Security and Reliability of IoT Systems (SecRIoT 2019), entitled “Threat analysis in dynamic
      environments: The case of the smart home” c 2019 IEEE.

 Received: 29 August 2019; Accepted:19 September 2019; Published: 25 September 2019

 Abstract: The development and deployment of highly dynamic, cyber+connected operational
 environments, such as smart homes, smart cities, and smart transportation systems, is increasing.
 The security analysis of such dynamic environments necessitates the use of dynamic risk assessment
 methodologies and the modeling of dynamically changing states. In this paper, we focus on
 the smart home environment, where the deployment of IoT devices increase the attack surface.
 We examine existing dynamic risk assessment methodologies, and by leveraging a smart home
 reference architecture we identify the security risks of a smart home’s physical and communication
 viewpoints, taking into consideration also dynamic operational aspects. Further, we develop a smart
 home network topology generator and a graph-based attack model to study dependencies among
 dynamically changing states and the propagation of a malware infection.

 Keywords: dynamic risk assessment; Internet of Things; Threat analysis; Smart Home; malware

1. Introduction
     Dynamic environments are characterized by changes in their architecture, data flows, and operational
processes. Such changes can appear periodically, continuously, or be event triggered. The Internet of
Things (IoT) is a typical example of such an environment, with instantiations across various ecosystems
such as smart homes, eHealth, vehicular networks, cloud computing and mobile communications.
This dynamicity, along with the increased interconnectivity and enhanced operational features increase
the attack surface of such ecosystems [1].
     Smart homes is a typical instantiation of a dynamic ecosystem where the ICT penetration is
significant since several types of connected devices and locally or remotely deployed services leverage
ICT. Many works in the literature have introduced definitions for the “smart home” [2–4]. Smart homes
can be defined by taking a social perspective or a technical viewpoint. The former describes the
influence of the smart home to human and social needs, whilst the latter describes the systems,
processes, services, and smart devices which are connected so as to facilitate control over the home’s
ecosystem. A smart home is able to support diversified components and entities, such as utility
suppliers, infrastructure providers and third party software or hardware vendors [5]. Due to this
diversity, the attack surface of the smart home is increasing rapidly, since more security vulnerabilities
are introduced, paving the way to an unreliable and insecure ecosystem. To this end, the European

Future Internet 2019, 11, 207; doi:10.3390/fi11100207                      www.mdpi.com/journal/futureinternet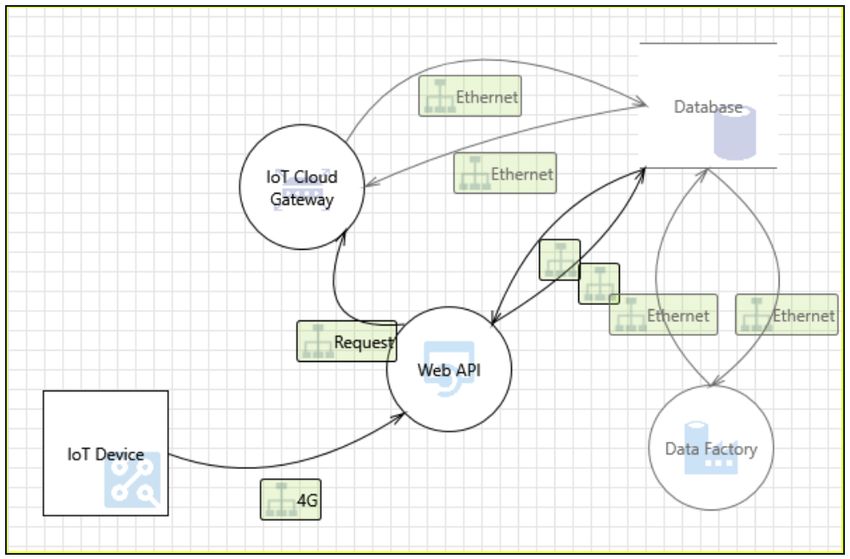
Future Internet 2019, 11, 207                                                                     2 of 19

Union Agency for Cybersecurity (ENISA) [6] identified potential threats and proposed good practices
for their mitigation.
     Existing risk assessment methods are mostly suitable for static environments and systems.
Dynamic environments such as those described above, require risk assessment methods able to
cope with frequent changes in the environment. The scope of this work is to carry out a threat analysis
for the smart home ecosystem, as the first step towards a comprehensive dynamic risk assessment
method, by leveraging an existing smart home reference architecture.
     Furthermore, by considering the technical viewpoint that defines the smart home environment,
we design a smart home network topology generator, based on the existing reference architecture.
Subsequently, to provide knowledge about the effects of the dynamic dependencies of the network
on the propagation of a malware infection, we use the outputs provided by the topology generator
to create a graph-based attack model. Our attack model is based on the initial hypothesis that at any
given time t each node can be observed at a discrete state and. subsequently, after homogeneous
intervals of time ∆t, it can either transit to another state or remain at the current state. The model
assumes types of malware that use either random or localized scanning techniques. A malware that
employs random scanning selects target IP addresses at random [7]. Localized scanning malware
preferentially scans for hosts in the “local” address space, instead of selecting targets randomly [7].
     The contributions of this paper can be summarized as follows: (i) a review of dynamic risk
assessment methodologies appropriate for identifying and assessing risks within the smart home
ecosystem; (ii) a threat analysis on an existing smart home reference architecture focusing on the data
flows and cloud services; (iii) an algorithm for modeling and visualizing the dynamic changes in
a smart home topology; and (iv) a study of the propagation of a malware infection in such networks,
with the use of connected graphs.
     The remainder of this paper is structured as follows: Section 2 reviews related work. In Section 3,
we describe the reference architecture of the smart home. In Section 4, we briefly discuss the STRIDE
(Spoofing, Tampering, Repudiation, Information Disclosure, Denial of Service, and Elevation of
Privileges) method and Microsoft’s threat analysis tool, and we apply them in smart home scenarios
of various complexity, to identify threats and to establish the attack surface variability in dynamic
environments. In Section 5, we present the methodology used for developing a network topology
generator, and, in Section 6, we present the attack model. In Section 7, we validate the outputs of the
models previously designed by creating a network simulator. Finally, in Section 8, we summarize our
conclusions and we propose directions for future work.
     This paper is an extended version of the paper entitled “Threat analysis in dynamic environments:
The case of the smart home” by Georgios Kavallieratos, Vasileios Gkioulos and Sokratis Katsikas that
was published in the Proceedings of the 1st International Workshop on Security and Reliability of IoT
Systems (SecRIoT 2019), held in conjunction with the 15th International Conference on Distributed
Computing in Sensor Systems (DCOSS), Santorini Island, Greece, 2019, pp. 234–240 c 2019 IEEE [8].
Portions of the work in [8] are reused in the present paper. In particular, Sections 1–4 and 8 follow
closely [8], with some changes of an editorial nature. The additional contribution of this work over [8]
is described in Sections 5–7.

2. Related Work
     Several risk assessment methodologies for dynamic environments have appeared in the literature.
Merrick et al. [9] proposed a risk modeling method for maritime transport. The authors considered
simulations, expert judgment and available data, and proposed a method which handles multiple
scenarios reflecting past, present and future operating procedures of the vessel’s ICT systems.
Poolsappasit et al. [10] developed a framework for dynamic risk management that uses Bayesian
attack graphs to address security issues in a network system. Puppala et al. [11] proposed a dynamic
risk assessment system using an improved attack graph to assess dynamic risks in cloud computing,
and proposed appropriate mitigation techniques. The authors used the Common Vulnerability Scoring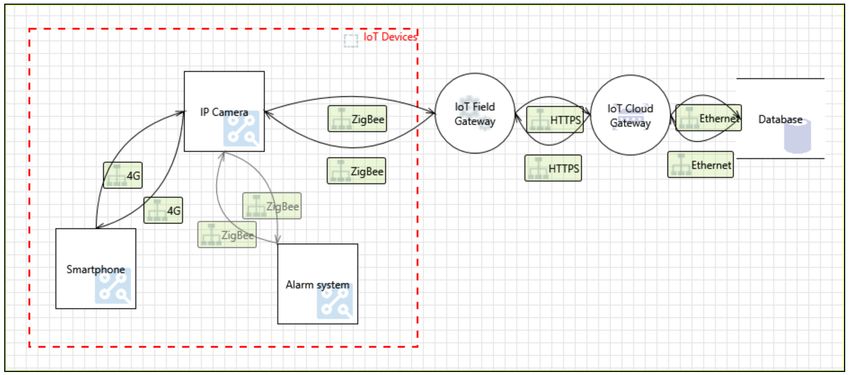
Future Internet 2019, 11, 207                                                                        3 of 19

system to initiate each node’s score in the attack graph. The Dynamical Risk Assessment Method for IoT
inspired by AIS (DRAMIA) dynamic risk assessment method for the IoT was proposed by Kiu et al. [12].
DRAMIA consists of attack detection agents and sub-systems of dynamic risk assessment, which adopt
immune system principles in order to dynamically change the attack detectors and estimate the
risk according to the detection results of all attack detection agents. Naumov et al. [13] introduced
a dynamic framework to assess cyber risks in continuously changing environments. However, this work
is in a preliminary stage. The National technical authority for information assurance in the UK proposed
a technical risk assessment and risk treatment standard [14] that is able to assess risks in dynamic
systems or services where components are being regularly upgraded or replaced. A risk assessment
engine for assessing cyber risks in real-time was also proposed by the WISER-Wide-Impact cyber
Security framework project [15]. Specifically, machine-reliable risk assessment algorithms have been
developed in order to facilitate the risk identification in dynamic environments. These algorithms
take as inputs the business configuration, the vulnerability assessment, the network constraints and
the application layer of the environment, to estimate the cyber risk. The aforementioned risk engines
could in principle be used to assess risks in the smart home ecosystem.
      Dynamic risk assessment tailored specifically to smart home environments has been addressed
within the EU project GHOST-Safe—Guarding Home IoT Environments with Personalized Real-time
Risk Control [16]. The project has proposed a dynamic risk assessment model for real-time security
and risk assessment on the ongoing activities over the network of a smart home, which may be
implemented by means of a real time risk engine. Consequently, the risk assessment’s results remain
valid since the engine is able to dynamically identify changes in the environment and to re-assess the
risk taking into consideration these changes [17].
      The security of the smart home ecosystem has been studied in several works that seek to identify
potential vulnerabilities, threats and risks in this dynamic environment. Schiefer [18] demonstrated
the challenges that risk analysis poses in a smart home installation, due to the heterogeneous nature
of the IoT devices. Jacobsson et al. [19] applied an information security risk assessment approach
in the development phase of smart home automation systems. The authors identified nine low and
four high level risks, and concluded that humans represent the highest risk exposure in smart home
automation systems. Further, a risk framework for the smart home was proposed by Denning et al. [5].
This framework focuses on the feasibility of an attack on the system, the attractiveness of the system as
a compromised platform, and the damage caused by performing a successful attack. Its drawback is
that it examines particular devices of the smart home and does not consider the data flows or the cloud
services that are also crucial parts of the smart home’s ecosystem. The security of the information flow
in the Home Area Network (HAN) of a smart grid was examined by Tong et al. [20]. They identified
the security levels of HAN devices and data packets, and proposed a security model which aims to
protect such data flows over the HAN network. Ali et al. [4] proposed the use of the Operationally
Critical Threat, Asset, and Vulnerability Evaluation (OCTAVE) Alegro risk assessment method to
identify potential risks in the smart home environment. They focused on the cyber and the physical
layer of the smart home’s architecture, and they identified ten critical cyber and physical assets.
Although they carried out a comprehensive risk assessment, they did not take into consideration the
complexity of the smart services and devices. Additionally, Beckers et al. [21] proposed a structured
threat analysis method for smart home scenarios by leveraging Microsoft’s Security Development
Lifecycle (SDL). In particular, they used a model-based method for the SDL’s threat analysis and they
presented an attack path Data Flow Diagram (DFD) pattern in order to explain potential intrusions in
the smart home environment.
      A great deal of research has been conducted to analyze and validate network topology generators
currently available. Haddadi et al. [22] discussed techniques for inference, modeling, and generation of the
Internet topology at both the router and administrative levels. They concluded that providing a realistic
mapping of the Internet network is challenging, highlighting the importance of defining the physical
interconnection of the nodes for routing and resilience purposes. Tangmunarunkit et al. [23] compared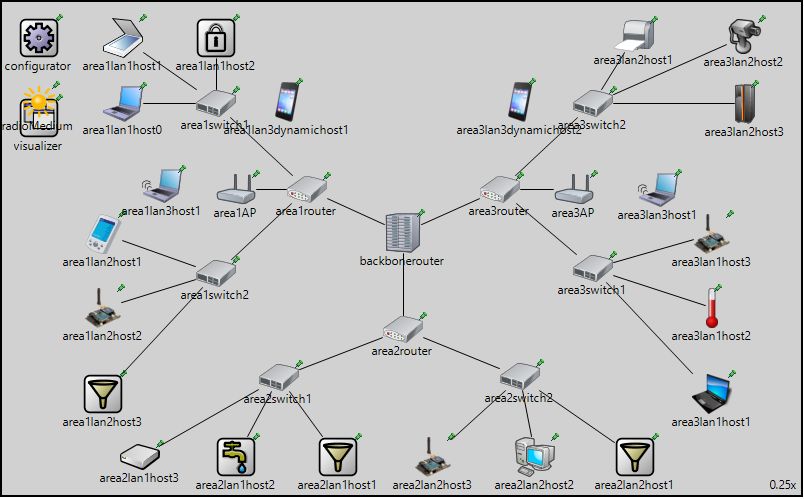
Future Internet 2019, 11, 207                                                                       4 of 19

structural topology generators to degree-based generators. They concluded that degree-based
algorithms produce more accurate results that match the metrics used with higher fidelity than
structural models. Nevertheless, they noted that choosing smaller topologies on which to run network
simulations would likely provide a drastically different result. Tangmunarunkit et al. [23] noted that
a power-law distribution is almost meaningless if the number of nodes is small because, with only
a few nodes, it is unlikely that the degree distribution will be able to create the implicit hierarchy
necessary for modeling networks.
     Attack modeling techniques and analysis have also been the focus of a large number of research
works on cyber threat analysis [24]. Cheng and Ji [7] compared the performance of different malware
propagation models through a spatial-temporal random process based on local interactions of nodes in
networks. They concluded that a Markov model that incorporates both detailed topology information
and simple spatial dependence achieves better overall results than the other models analyzed.
One limitation of the model proposed by Cheng and Ji is that it does not specifically consider the
states at which the nodes could be observed. Wang et al. [25] proposed a discrete-state Markov model
that assumes a network node to be observable in one of the five following states: vulnerable, infected,
quarantined, healthy and disseminator.

3. Smart Home Reference Architecture
     The emerging ICT technologies in the smart home environment aim to facilitate everyday tasks
such as the remote control of the home’s functions and the management of energy consumption.
A reference architecture can be used as a template in order to develop a specific architectural
topology of such an environment, since it provides a common ground around which more detailed
architectures can be developed [26]. Such a model is able to better represent aspects such as
human users, device implementations and server structures towards a more detailed view of the
examined environment [27]. Several reference architectures have been proposed for the smart home
ecosystem [28–30]. Ghirardello et al. [31] proposed a smart home reference architecture by analyzing
three viewpoints of the ecosystem: (i) functional; (ii) physical; and (iii) communication. Particularly,
the functional viewpoint consists of the necessary functions that must be supported for the normal
operation of the smart home. The physical viewpoint describes all the physical components which
are required for executing the smart home’s functions. The communication viewpoint contains the
protocols which are necessary for the transmission of control and information flows among the
components. We chose to base our approach to threat analysis on this reference architecture, because it
offers the appropriate level of detail for this purpose. In particular, it provides good balance between
the abstraction layers and the information needed for conducting a risk assessment. In addition,
a key characteristic of this reference architecture is the classification of Smart Home’s viewpoints,
which facilitates the identification of information, physical and communication assets. In this work,
we leverage this reference model to carry out a threat analysis, as the first step towards a comprehensive
risk assessment for smart homes.

4. Threat Analysis

4.1. Method
     Threat analysis is a statement of threats that are related to vulnerabilities of assets and
threat agents [32]. As such, threat analysis is part of the risk assessment process [33]. In dynamic
environments, it is important to use a threat analysis method which allows the consideration of
potential changes in the targeted environment. Two distinct threat analysis approaches can be identified
in the literature, namely the attacker’s perspective and the defender’s perspective. The former is
more complex, whilst the latter examines the targeted systems thoroughly, taking into consideration
also defensive techniques. The methodology to be used is important for the identification of all
vulnerabilities, threats and attacks within the smart home architecture. Focusing on methods which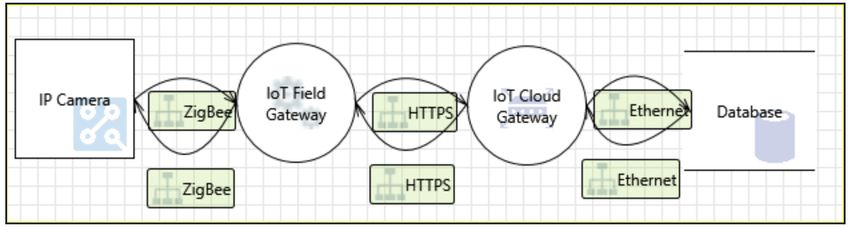
Future Internet 2019, 11, 207 5 of 19
are able to identify threats automatically by means of the use of a supporting tool, we opted to employ
the STRIDE (Spoofing, Tampering, Repudiation, Information Disclosure, Denial of Service and Elevation of
Privilege) method which is supported by Microsoft’s threat modeling tool. The method was developed
by Kohnfelder and Garg and has been used by both academia and industry; it allows the extraction of
rigorous results for the risks that the target systems face [34] and can be applied as early as the design
phase. The STRIDE threats were described by Shostack [35]. Further details on the use of the method
can be found in [36].
Microsoft’s threat modeling tool allows the identification of potential threats which target data
flows and back-end services of the reference model of Ghirardello et al. [31]. This tool allows the
identification of security problems in processes, data stores and data flows, as the analysis is conducted
using DFDs. Hence, DFDs for the smart home ecosystem, each corresponding to a different topology,
need to be created. The identification of threats is achieved by using the STRIDE threat taxonomy.
The analysis proceeds as follows:
Step 1—Describe Scenario: The scenario description must include all relevant elements within the
scope of the examined environment. In this paper, the focus is on the smart home ecosystem and in
particular on the data flows and the back-end services.
Step 2—Identify Assets: The assets of the target system must be identified. Such assets include
information assets and physical assets.
Step 3—Create DFDs: By leveraging the simplicity of such diagrams, an analyst is able to represent
devices, services, and data flows between the assets identified above.
Step 4—Identify constraints for each vulnerability: Each of the identified assets has various security
vulnerabilities which have already been analyzed and can be found in existing vulnerability databases
(e.g., [37,38]).
Step 5—Determine Threats: The analyst develops different attack scenarios, considering the
identified assets and their interconnections. The tool automatically identifies threats, also taking
into account the predefined constraints.
4.2. The Case of the Smart Home Ecosystem
The smart home ecosystem includes multiple assets, depending on the viewpoint. In this work,
we focus on the physical and communication viewpoints, thus we aim at identifying information and
physical assets. These are depicted in Table 1.
Table 1. Identified assets [8].
Information Assets Physical Assets
User credentials IoT smart devices
Information collected by smart devices IoT hubs
Smart home status information IoT gateways
Information about the installed assets Sensors/Actuators
Log information Cloud server
Video, Picture, Voice Information
Location tracking information
Personal information (e.g., health data)
Based on the identified assets and various device and back-end service communication scenarios,
we then developed six distinct Smart Home scenarios, described by the corresponding DFDs,
representing six topologies of varying complexity, so as to approach the dynamic nature of the
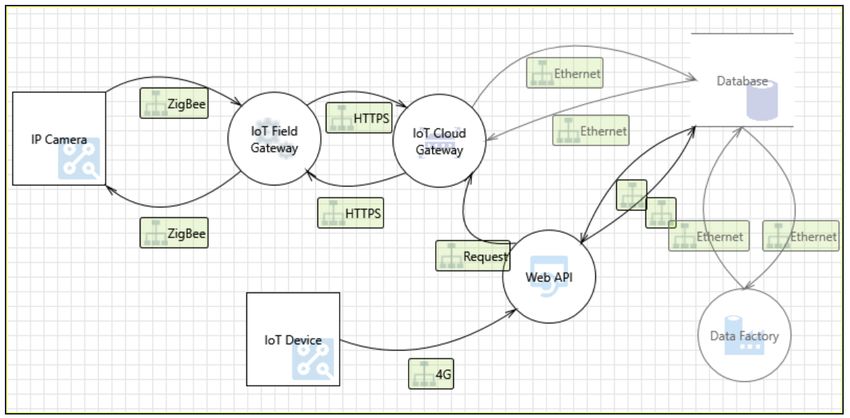
target environment [8]. These are described below and the corresponding DFDs are shown in Figure 1:
Scenario 1—IP camera and IoT gateway: The first scenario represents the connection between an IP
camera and a gateway, as depicted in Figure 1a. The ZigBee protocol is used for communication and
our analysis focuses on threats which could harm either the physical assets or information transmitted
between the devices. We assume that the IP camera is connected directly to the gateway.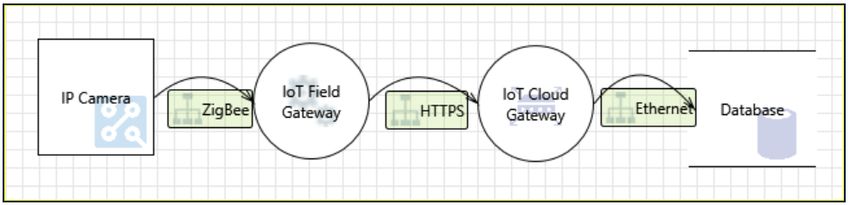
Future Internet 2019, 11, 207                                                                        6 of 19

     Scenario 2—-Unidirectional communication between an IP camera and the cloud: This topology
represents a connection between an IP camera and a cloud server through two gateways.
The communication is established using three different protocols, as can be seen in Figure 1b. In this
scenario, the IP camera sends only a request to the database. The former is connected directly to the
gateway through the ZigBee protocol and the latter is a simple database which uses MySQL 2016.
     Scenario 3—Bidirectional communication between an IP camera and the cloud: The third topology is
similar to the second, but now the IoT device communicates with the cloud bidirectionally. The used
communication protocols are depicted in Figure 1c.
     Scenario 4—Smartphone controlled IP camera: A more complex topology is represented in
the next scenario depicted in Figure 1d. This topology describes the communication between
a smartphone-controlled IP camera and the cloud. The IoT device (smartphone) sends requests
to the cloud API in order to control the IP camera through cellular communication.
     Scenario 5—Smartphone communication with the cloud: The next topology represents the
communication between the smartphone and the cloud as illustrated in Figure 1e. In this topology,
we aim to identify potential threats that could provoke damage to the control requests.
     Scenario 6—Links among smart devices: The last topology targets only smart devices (IP camera,
alarm system and smartphone) and aims to identify potential threats which derive from parallel links
among these devices. In particular, the IP camera is able to communicate using 4G and the ZigBee
protocol. The topology in Figure 1f depicts the interaction of an IP camera with a smartphone and with
an alarm system.
     By applying the STRIDE method to these scenarios, in [8], we identified in detail the relevant
threats. The number of threats identified in each of the six scenarios is depicted in Table 2. The following
conclusions on how the dynamic nature of a smart home environment affects the identified threats can
be drawn [8]:

•     As the complexity of the topology increases, more security threats are identified. In the last two
      scenarios, fewer threats have been identified since the analysis focused on the communication
      between the smartphone and the cloud and on the identification of threats which derive from
      parallel links among specific devices.
•     More complex topologies inherit the threats that the simpler ones face.
•     IoT devices such as IP cameras and smart devices increase the attack surface of the smart home.
      In particular, an attacker can launch elevation of privileges attacks more efficiently by leveraging
      vulnerabilities of an IP camera and its communication protocols, particularly ZigBee.
•     Devices with transitive or parallel connections, such as an IP camera, are more vulnerable to
      cyber-attacks since they inherit the security vulnerabilities of each and every protocol.

                                Table 2. Identified threats for each scenario.

                                      Scenarios    Identified Threats
                                      Scenario 1            13
                                      Scenario 2            27
                                      Scenario 3            46
                                      Scenario 4            48
                                      Scenario 5            23
                                      Scenario 6            16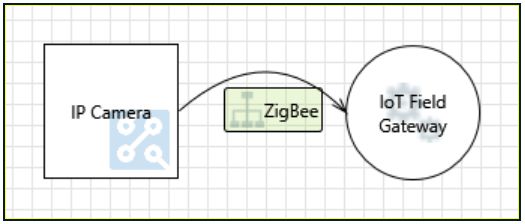
Future Internet 2019, 11, 207                                                                              7 of 19

                                (a)                                            (b)

                                (c)                                            (d)

                                (e)                                             (f)

      Figure 1. Developed Scenarios [8]. (a) IP camera and IoT gateway [8]. (b) Unidirectional communication
      between an IP camera and the cloud [8]. (c) Bidirectional communication between an IP camera and the
      cloud [8]. (d) Smartphone controlled IP camera [8]. (e) Smartphone communication with the Cloud [8].
      (f) Links among smart devices [8].

5. Smart Home Topology Modeling
     To effectively analyze the dependencies between the dynamic properties of a smart home network
and security threats identified previously, we developed a smart home network topology modeling
algorithm. To develop a generator that could provide knowledge and belief about the dynamic
states of a smart home topology, in the form of annotated graphs, we first determined a layer-based
reference architecture mapping based on the viewpoints discussed in Section 3: functional, physical
and communication. The proposed taxonomy is divided in five Layers:

•     Layer 0:    Cloud.
•     Layer 1:    Home Gateway.
•     Layer 2:    IoT Hub.
•     Layer 3:    IoT Devices.
•     Layer 4:    End-User Devices.

     The pseudocode in Algorithm 1 describes the procedural approach used to implement the graph
generation algorithm and the condition needed to be satisfied in order to produce the output graph.
The steps taken by the algorithm are further detailed in Sections 5.2 and 5.3.
Future Internet 2019, 11, 207 8 of 19
Algorithm 1 Graph generation algorithm pseudocode.
if inputVar ≤ maxval and inputVar ≥ minval then
generatedNodes ← N
else
while inputVar ≤ maxval or ≥ minval do
prompt : InsertValidInputValues
end while
end if
if generatedHubNodes ≥ 0 then
for i ← 0; i ≤ H; i + + do
generateHubConnectedNode ← H (i )
end for
end if
generateDe f aultNodes ← Nd
generateDe f aultEdges ← E( H, Nd )
if distanceNode( Ni ) ≤ maxDistance then
generateEdge ← E( Hi , Ni )
else
end if
if distanceNode( Ni ) ≥ maxDistance then
generateNodetoNodeEdge ← E( Ni , Nj )
end if
generatePlot ← P
IoT devices are represented in the graph as homogeneous components, as their typical network
behavior—with a few exceptions—depends on the adopted communication protocol more than it
does on their specific properties. The first step for the algorithm is to generate a vector of n names
Nameip (Name1 ,...,Namen ) for each input parameter ip, where n is equal to the input value associated
with the input parameters described in Table 3.
5.1. Node Generation
Afterwards, all the nodes corresponding to the IoT appliances at Layer 3 of the taxonomy
are generated. For each hub NameH and gateway NameG , a normally distributed number of IoT
devices nIoTH and nIoTG is generated. The values for the mean µ of the normal distribution have
been set between 10 and 25 and for the standard deviation σ to 2, based on the usage share of the
different protocols and the average number of devices that support these protocols. Name vectors
IoTNi (IoTn1 ,...,IoTnm ) and weight vectors IoTWi (IoTw1 ,...,IoTwm ) associated to all m IoT vectors nIoTH
and nIoTG are also generated. The weight vector corresponds to the physical distance between the IoT
device IoTnamea and its associated hub NameH . The algorithm has now generated all the nodes that
compose Layers 0–4 of the taxonomy.
5.2. Edge Generation
Next, the algorithm generates the edges between the nodes. Network generators come in two
families, namely structure-based that attempt to create a hierarchical structure and degree-based
that focus solely on the degree distribution [23]. A degree-based approach was discarded in favor of
a structural approach that took into consideration topological information of different communication
protocols. All clouds NameC , hubs NameH , smartphones NameS and PCs NamePC are connected to
exactly one gateway NameG . The scalability of the dependencies for the connections between all IoT
appliances IoTnamea and their hubs NameH has been reduced to ensure clarity and comprehensibility
of the final graph. For this reason, we opted to adopt partial mesh topology networks as the standard
arrangement for the nodes in a sub-network formed by each hub NameH and its associated appliances
IoTnamea . The weight vectors IoTWi (IoTw1 ,...,IoTwm ) previously generated are now used to determineFuture Internet 2019, 11, 207 9 of 19
whether an IoT device IoTnamea is connected directly to a hub NameH or to a router node IoTnb . If the
weight value IoTw(c) is lower than the maximum range RH supported by the hub’s protocol, then the
device is connected directly to NameH . If IoTw(c) is greater than RH , then the device is connected to
a router node IoTnb , which itself is directly connected to NameH .
Table 3. Topology generator input parameters table.
Input List
Input Parameter Description Conditional Constraints
N. of Clouds (NC) Integer value corresponding to the number 0 ≤ NC ≤ 2
of clouds in the network
N. of Gateways (NG) Integer value corresponding to the number 1 ≤ NG ≤ 8
of gateways in the network
N. of Z-Wave Hubs (NZW) Integer value corresponding to the number 0 ≤ NZW ≤ 2
of Z-Wave hubs in the network
N. of ZigBee Hubs (NZB) Integer value corresponding to the number 0 ≤ NZB ≤ 2
of ZigBee Hubs in the network
Bool. of Insteon Dvcs (BI) Boolean value indicating whether Insteon BI == 1 ∨ == 0
devices are present
N. of Insteon Hubs (NI) Integer value corresponding to the number 0 ≤ NI ≤ 2
of Insteon Hubs in the network
N. of Bluetooth Hubs (NB) Integer value corresponding to the number 0 ≤ NB ≤ 2
of gateways in the network
N. of Thread Hubs (NT) Integer value corresponding to the number 0 ≤ NC ≤ 2
of Thread Hubs in the network
Bool. of We-Mo Dvcs (BWM) Boolean value indicating whether We-Mo BWM == 0 ∨ == 1
devices are present
N. of Smartphones (NS) Integer value corresponding to the number 0 ≤ NS ≤ 6
of Smartphone in the network
N. of PCs (NP) Integer value corresponding to the number 0 ≤ NP ≤ 8
of PCs in the network
5.3. Plot Generation
The final step of the algorithm consists in visualizing the plot of the generated network topology.
The generated plot should correspond to an observable static state of a smart home network.
In addition, the algorithm generates two additional plots. These graphs represent two possible dynamic
changes in the network. There are different dynamic changes that a smart home network topology
could go through over time. One of these changes is the removal of one of its network nodes. The first
additional generated plot shows the change of the network topology after the removal of one of its
nodes. This could happen due to different causes, e.g., the malfunctioning or intermittent availability
of one of the appliances. Figure 2 shows the plot generated with the following input parameters:
Cloud = 1, ZW = 1Gateway = 1SP = 2PC = 2. Figure 3 shows the change in the topology after the
removal of one node from the network of devices.Future Internet 2019, 11, 207 10 of 19
Figure 2. Generated network topology.
Figure 3. Node ZWIoT18 (in red) has been removed from the network topology. The connections the
node had to ZWIoT15 and SP01 are also removed.
The output of the second plot varies greatly depending on which node is removed from the graph.
If a node with high nodal degree is removed, the impact it would have on the network would be greater
than if it had a lower nodal degree. On the contrary, if a node only has a peer-to-peer connection to
another node, its removal would not impact the network as a whole. The third plot generated by the
algorithm highlights the nodal mobility property that characterizes certain devices in smart home
networks. Since the mobility property is very typical of smartphone devices, it was implemented
exclusively for this category of appliances. Figures 4 and 5 highlight the change in position of the
smartphone node SP01, which causes the node to lose the connection it had to some of its previous
neighbors, but also forms new connections to other nodes in the graph.Future Internet 2019, 11, 207 11 of 19
Figure 4. Generated network topology, with node SP01, corresponding to a smartphone device, highlighted.
Figure 5. Node SP01 (highlighted) has moved from its original position. This caused the loss of the
connection from PC02 and simultaneously the creation of a new connection with node TIoT08.
6. Attack Model Graph Representation
The threat analysis presented in Section 4.2 identified different threats that can arise as a result
of malware infection of the smart home’s network. To delve deeper into the study of such threats,
we first developed the smart home network topology modeling algorithm described in Section 5,
and then studied the malware propagation in the Smart Home infrastructure. To correctly study and
visualize the effects that dynamic changes on a network have on specific security threats, we developed
an attack model designed on the smart home networks generated by the topology generator. The attack
model focuses on representing malware propagation. The model developed in this work is based on
the discrete state Markov model presented by Wang et al. [25] with additional considerations about
spatial-temporal dependencies. Figure 6 describes the state-change process of our model.Future Internet 2019, 11, 207 12 of 19
Figure 6. Diagram of the state transitions.
Our model assumes that a recovered node can either remain healthy or become vulnerable again
after a certain time interval. In addition, our model considers the existence of a fifth state, namely
the intermittent state. If a node is in the intermittent state at time t, after an interval of time ∆t,
it may either remain in the intermittent state or transit back to the state it was at t − 1. The rate for
the state-transitions are determined by a set of parameters. Table 4 describes these parameters and
their constraints.
Table 4. Attack model parameters table.
Input List
Parameter Description Conditions
Birthrate (β) Integer value corresponding to the the probability a vulnerable node 0≤β≤1
has of getting infected
Death rate (α) Integer value corresponding to the probability of a quarantined node 0≤α≤1
to recover and be removed from the virus
Detection rate (δ) Integer value corresponding to the probability of the internal defense 0≤δ≤1
mechanisms of each system to detect infections and put the virus into
isolation
Vulnerability rate (γ) Integer value corresponding tothe probability of a recovered node to 0≤γ≤1
return to the vulnerable state
The rates are used to determine the set of conditional probability functions of Equation (1),
where each state is associated with a state (v = vulnerable, i = infected, q = quarantined, h = healthy,
and i = intermittent).
β ∗ n(in f )
P ( X ( t + 1) = v | X ( t ) = v ) = 1 − β − − θ,
n
P( X (t + 1) = i | X (t) = i ) = 1 − δ − θ,
P( X (t + 1) = q| X (t) = q) = 1 − β − α − θ, (1)
P( X (t + 1) = h| X (t) = h) = 1 − γ − θ,
P( X (t + 1) = i | X (t) = v, i, q, i ) = θ.
In addition to the intermittent property, the property of spatial dynamicity has also been added to
specific nodes. These nodes have been assigned a dynamic attribute that allows them to move from their
current location to a different location after an interval of time ∆t. At every iteration, the algorithm
selects whether a dynamic node will be moved from its current position to a new position. Figures 7–10
show sample outputs of the final algorithm.Future Internet 2019, 11, 207 13 of 19
Figure 7. Node-state graph at time t = 0.
Figure 8. Node-state graph at time t = 3. The dynamic node 1 has been selected to move after the next
time interval, hence its current edges are highlighted.Future Internet 2019, 11, 207 14 of 19
Figure 9. Node-state graph at time t = 4. Node 1 has moved and its neighbouring nodes have changed.
Figure 10. Node-state graph at time t = 11.
To analyze the effects of the two properties implemented-intermittency and spatial dynamicity
of nodes-both algorithms were run 50 times with the following inputs: β = 0.2, α = 0.1, δ = 0.2,
and γ θ = 0.2. The number of nodes of the network was set to N = 20 and the nodal degree to d = 3.
These values were selected in order to represent a small connected network, with medium infection
and recovery speed. Table 5 depicts the average number of nodes in each state, after 10 time intervals,
for both models.Future Internet 2019, 11, 207 15 of 19
Table 5. Average results of 50 simulations of the Markov model and the hybrid model.
State Markov Model Average Hybrid Model Average
Infected 10.3 7
Recovered 2.8 2.8
Susceptible 1.9 1.2
Quarantined 5 5.8
Intermittent null 3.2
Table 5 shows that the most significant effect of the presence of intermittent and mobile nodes in
the network is the decrease in the number of nodes infected after an equal interval of time. This can
be interpreted as a slower propagation of the infection. Two factors that may have influenced the
propagation of the malware are:
1. decreased neighborhood of nodes visible to the malware scanning and consequently the
malware spreading; and
2. increased average time for the defense mechanisms to quarantine an infected node before it can
propagate the infection to its neighborhood.
Further testing of the algorithm has shown that increasing the number of intermittent nodes in
the network, or the rate of intermittency, has an inversely proportional effect on the propagation of the
infection, in agreement with the previous hypotheses.
7. Network Topology Simulation
To validate the outputs of the network topology algorithm and the attack model graph
representation developed and described in Sections 5 and 6, we developed a network simulation
of a smart home system. The simulation was implemented with the INET framework version 4.1.0
of OMNeT++ version 5.4.1 [39]. The simulation, based on a pre-existing configuration provided
by the INET framework, consists of a hierarchical mixed wireless/wired network. Two different
network configurations are used to highlight the effect of dynamic and intermittent nodes on malware
propagation in a network. The first network is comprised of three areas, each containing two local
area networks (LANs). Each LAN contains three heterogeneous hosts. The hosts in the LAN connect
to an area router through switches. The three area routers connect to a central backbone router.
The network contains three hierarchical levels, which correspond to the hosts in the LANs, the area
routers, and the backbone router. In addition, two wireless access points are added to the network.
The access points are connected to area1router and area3router, respectively. These access points allow
for wireless hosts to be connected to the network. Two wireless hosts are connected to each access
point. Different Service Set Identifiers (SSIDs) are configured for the members of the two wireless
LANs, so they do not communicate directly with each other. To assign IP addresses hierarchically,
starting from the central router to the single hosts, the following strategy was adopted: the first octet
of the address for all nodes is 10; the second octet denotes the area; the third octet denotes the LAN
within the area; and the fourth octet is the host identifier within a LAN. For example, a host host1
found in area 3 in lan 1 would have the IP address 10.3.1.1. Figure 11 shows the configuration for the
first network simulation.
To visualize malware scanning and malware propagation, localized routing tables for ping
communication are made. These tables determine the routes that packets have to follow when trying to
reach a certain host. Packet reception is interpreted as successful malware scanning. A state variable is
added to all hosts. Whenever the malware scans a certain host, the state variable is updated following
the conditional probability functions of Equation (1). Whenever a host transits between two states,
a message stating which state-transition the host has gone through is printed. The second network
configuration modifies the behavior of certain devices in the network, to account for intermittent
availability and mobility of nodes. First, shut down and startup scenarios have been scripted forFuture Internet 2019, 11, 207 16 of 19
certain nodes in the network.This addition allows the implementation of intermittent availability to
nodes. In particular, area2lan1host3, area2lan2host1 and area3switch2 are scripted to shut down and
start up sequentially after specific time intervals. Nodal mobility is also added to the previously static
area1lan3dynamichost1 and area3lan3dynamichost2. A rectangular moving pattern, with constant speed
and acceleration is added to these two hosts, taking them out of the range of their initial access points
and into the range of another access point during the course of their movement pattern. The results
of running the second configuration of the network simulation confirm that intermittent availability
of nodes affects malware propagation in a way that is inversely proportional; the more intermittent
nodes in a network and the longer these nodes are “hidden” to the malware scanning, the slower the
propagation of the malware. The detection and recovery rate of the network nodes are comparable
in both models, although the slower propagation of the malware allows for the detection system to
offset a rapid expansion. One behavior that is highlighted in the simulation, but is not taken into
account in the network topology generator and the attack model, is the somewhat deterministic
patterns followed by dynamic nodes. This means that the neighborhood of these nodes after short
subsequent instants of time is not random, but usually correspond to adjacent nodes to the current
neighborhood. Consequently, the short-term effect of dynamic mobility of nodes is not as significant
as suggested by the attack model, but its long-term effects may still affect the malware propagation in
a meaningful way.
Figure 11. Simulation network architecture.
8. Conclusions
To facilitate threat analysis for dynamic environments, it is necessary to be able to continuously
identify and analyze different components, systems and communication protocols. In this work,
we conducted a threat analysis for the smart home ecosystem, utilizing the smart home reference
architecture of Ghirardello et al. [31], the STRIDE threat analysis method and Microsoft’s threat
modeling tool, with an eye towards identifying and analyzing potential threats which target both
physical components of a smart home environment and data flows among them. The analysis
considered six smart home instances of varying complexity. We later developed a smart home network
topology generator and a malware propagation graph-based model to effectively evaluate the effects
of the dynamic properties of the environment in specific security threats.Future Internet 2019, 11, 207 17 of 19
Even though the proposed approach has been demonstrated to allow the capture of dynamic
changes of devices and/or back-end services in a smart home environment, it does not come without
limitations. These are mostly related to the threat analysis tool, which has not managed to identify
denial of service threats and cannot handle physical threats that might affect the physical infrastructure.
Furthermore, the existing DFD template does not support all the communication protocols that may
be used in a smart home; hence, our analysis was limited only to the ZigBee, HTTPS and 4G protocols.
Moreover, the analysis of existing communication protocols considered only spoofing, tampering
and elevation of privileges threats, as repudiation and information disclosure threats are not fully
supported. What is more, the currently available template does not allow the examination of transitive
attacks over the network. Specifically, the specific template analyzes each component of the DFD
separately and cannot consider malicious actions which, for example, could occur by a stealthy
malware. Despite these limitations, the approach can be used to provide input to one of the dynamic
risk assessment methods to identify potential risks to the physical and communication viewpoint.
Results from the attack model algorithm show that the presence of dynamic nodes can change
the propagation pattern and rate of a malware, with effects directly proportional to the initial and
final neighborhood size of the mobile nodes. The presence of intermittently available nodes also has
an impact on the network. With a higher number of intermittent nodes in a network, the final rate
of propagation of a malware in otherwise identical conditions is reported to be slower and with
a smaller expansion. A network simulation, to showcase real-time malware propagation in a smart
home network, was conducted to validate the outputs of the models developed. The results of the
simulation confirm that intermittent availability of nodes impact malware propagation. The simulation
also highlights that mobility patterns of dynamic nodes should be taken into consideration when
developing network topology generators and attack models, as they would allow for more realistic
prediction of the neighborhood size and topological position of infected nodes.
As future work, we intend to develop a more flexible template to reflect the smart home ecosystem
in higher fidelity, and use this to carry out a refined threat analysis, to be used as input to the dynamic
risk assessment approach taken in the GHOST project [16]. To this end, we will analyze the security of
the communication protocols and data packets in more detail in order to contribute to the most crucial
part of the Risk Engine, namely risk analysis. The more rigorous threat analysis results will be used for
Contextual Profiling (CP) as described in the GHOST architecture. In particular, the development of the
classification templates and profiles of the typical Smart Home devices will be enhanced, by leveraging
the results herein in the training process.
We also intend to adjust the topology generator algorithm in accordance to the results obtained
by the network simulation, in particular to characterize the behavior of mobile nodes in the generated
networks with more deterministic mobility patterns, based on the structural properties of the topologies.
The results of this study and future studies will be utilized during the training process in order to
improve the accuracy of the results.
Author Contributions: These authors contributed equally to this work.
Funding: This research received no external funding.
Conflicts of Interest: The authors declare no conflict of interest.
References
1. Stuckenschmidt, H. Ontology-based information in dynamic environments. In Proceedings of the 2003
Twelfth IEEE International Workshops on Enabling Technologies: Infrastructure for Collaborative Enterprises
(WET ICE 2003), Linz, Austria, 9–11 June 2003; p. 295.
2. Fabi, V.; Spigliantini, G.; Corgnati, S.P. Insights on smart home concept and occupants’ interaction with
building controls. Energy Procedia 2017, 111, 759–769. [CrossRef]
3. Suryadevara, N.K.; Mukhopadhyay, S.C. Smart Homes: Design, Implementation and Issues; Springer: Cham,
Switzerland, 2015; Volume 14.Future Internet 2019, 11, 207 18 of 19
4. Ali, B.; Awad, A.I. Cyber and Physical Security Vulnerability Assessment for IoT-Based Smart Homes.
Sensors 2018, 18, 817. [CrossRef] [PubMed]
5. Denning, T.; Kohno, T.; Levy, H.M. Computer security and the modern home. Commun. ACM 2013, 56, 94–103.
[CrossRef]
6. Lévy-Bencheton, C.; Darra, E.; Tétu, G.; Dufay, G.; Alattar, M. Security and Resilience of Smart Home
Environments Good Practices and Recommendations; Technical Report; ENISA: Heraklion, Greece, 2015.
[CrossRef]
7. Chen, Z.; Ji, C. Spatial-temporal modeling of malware propagation in networks. IEEE Trans. Neural Netw.
2005, 16, 1291–1303. [CrossRef] [PubMed]
8. Kavallieratos, G.; Gkioulos, V.; Katsikas, S.K. Threat Analysis in Dynamic Environments: The Case of the
Smart Home. In Proceedings of the 2019 15th International Conference on Distributed Computing in Sensor
Systems (DCOSS), Santorini, Greece, 29–31 May 2019; pp. 234–240. [CrossRef]
9. Merrick, J.R.; van Dorp, J.R.; Mazzuchi, T.A.; Harrald, J.R. Modeling risk in the dynamic environment of
maritime transportation. In Proceedings of the 33rd Conference on Winter Simulation, Arlington, VA, USA,
9–12 December 2001; pp. 1090–1098.
10. Poolsappasit, N.; Dewri, R.; Ray, I. Dynamic security risk management using bayesian attack graphs.
IEEE Trans. Depend. Secure Comput. 2012, 9, 61–74. [CrossRef]
11. Puppala, G.; Pasupuleti, S.K. Dynamic Security Risk Assessment in Cloud Computing Using IAG. In Progress
in Computing, Analytics and Networking; Springer: Singapore, 2018; pp. 105–116.
12. Liu, C.; Zhang, Y.; Zeng, J.; Peng, L.; Chen, R. Research on Dynamical Security Risk Assessment for the
Internet of Things inspired by immunology. In Proceedings of the 8th International Conference on Natural
Computation (ICNC), Chongqing, China, 29–31 May 2012; pp. 874–878.
13. Naumov, S.; Kabanov, I. Dynamic framework for assessing cyber security risks in a changing environment.
In Proceedings of the 2016 International Conference on Information Science and Communications
Technologies (ICISCT), Tashkent, Uzbekistan, 2–4 November 2016; pp. 1–4.
14. HMG IA Standard Numbers 1 & 2-Supplement, Standard No. 1 & 2 Supplement Technical Risk Assessment and Risk
Treatment; Technical Report; CESG: London, UK, 2012.
15. Álvarez, A.; González, S.; Díaz, R.; Arce, C.H.; Machnicki, D.; Cernivec, A.; Zitnik, A.; Refsdal, A.;
Biasibetti, A.L.; Poidomani, S.; et al. D5.2-WISER REAL-Time Assessment Infrastructure; Technical Report,
WISER Project; CYBERWISER.eu: London, UK, 2015.
16. Collen, A.; Nijdam, N.; Augusto-Gonzalez, J.; Katsikas, S.; Giannoutakis, K.; Spathoulas, G.; Gelenbe, E.;
Votis, K.; Tzovaras, D.; Ghavami, N. GHOST: Safe-guarding home IoT environments with personalised
real-time risk control. In International ISCIS Security Workshop; Springer: Cham, Switzerland, 2018; pp. 68–78.
17. Pandey , P.; Collen, A.; Nijdam, N.; Anagnostopoulos, M.; Katsikas, S.; Konstantas, D. Towards automated
threat based risk assessment for cyber security in smart homes. In Proceedings of the 18th European
Conference on Cyber Warfare and Security (ECCWS 2019), Coimbra, Portugal, 4–5 July 2019.
18. Schiefer, M. Smart home definition and security threats. In Proceedings of the 2015 9th International
Conference on IT Security Incident Management & IT Forensics, Magdeburg, Germany, 18–20 May 2015;
pp. 114–118.
19. Jacobsson, A.; Boldt, M.; Carlsson, B. A risk analysis of a smart home automation system. Future Gener.
Comput. Syst. 2016, 56, 719–733. [CrossRef]
20. Tong, J.; Sun, W.; Wang, L. An information flow security model for home area network of smart grid.
In Proceedings of the IEEE 3rd Annual International Conference on Cyber Technology in Automation,
Control and Intelligent Systems (CYBER), Nanjing, China, 26–29 May 2013; pp. 456–461.
21. Beckers, K.; Faßbender, S.; Heisel, M.; Suppan, S. A threat analysis methodology for smart home scenarios.
In International Workshop on Smart Grid Security; Springer: Cham, Switzerland, 2014; pp. 94–124.
22. Haddadi, H.; Rio, M.; Iannaccone, G.; Moore, A.; Mortier, R. Network topologies: Inference, modeling,
and generation. IEEE Commun. Surv. Tutor. 2008, 10, 48–69. [CrossRef]
23. Tangmunarunkit, H.; Govindan, R.; Jamin, S.; Shenker, S.; Willinger, W. Network Topology Generators:
Degree-based vs. Structural. SIGCOMM Comput. Commun. Rev. 2002, 32, 147–159. [CrossRef]
24. Al-Mohannadi, H.; Mirza, Q.; Namanya, A.; Awan, I.; Cullen, A.; Disso, J. Cyber-Attack Modeling Analysis
Techniques: An Overview. In Proceedings of the 2016 IEEE 4th International Conference on Future Internet
of Things and Cloud Workshops (FiCloudW), Vienna, Austria, 22–24 August 2016; pp. 69–76.Future Internet 2019, 11, 207 19 of 19
25. Wang, P.F.; Meng, S.; Zhang, H.; Wang, J.C. Markov Model of Malicious Code Propagation. In Proceedings
of the 2010 International Conference on Innovative Computing and Communication and 2010 Asia-Pacific
Conference on Information Technology and Ocean Engineering, Macao, China, 30–31 Janaury 2010;
pp. 260–263.
26. Lin, S.; Miller, B.; Durand, J.; Bleakley, G.; Chigani, A.; Martin, R.; Crawford, M. The Industrial Internet of
Things, Volume G1: Reference Architecture. Ind. Internet Consort. 2017, G1, 10–46.
27. Weyrich, M.; Ebert, C. Reference architectures for the internet of things. IEEE Softw. 2016, 33, 112–116.
[CrossRef]
28. Chauhan, M.A.; Babar, M.A. Using Reference Architectures for Design and Evaluation of Web of Things
Systems: A Case of Smart Homes Domain. Manag. Web Things 2017, 205–228. [CrossRef]
29. Hu, C.; Chen, S.; Guo, L.; Chootong, C.; Hui, L. Home care with IoT support: Architecture design and
functionality. In Proceedings of the 10th International Conference on Ubi-Media Computing and Workshops
(Ubi-Media), Pattaya, Thailand, 1–4 August 2017; pp. 1–6.
30. Internet of Things (IoT)—Reference Architecture; Standard; International Organization for Standardization:
Geneva, Switzerland, 2018.
31. Ghirardello, K.; Maple, C.; Ng, D.; Kearney, P. Cyber Security of Smart Homes: Development of a Reference
Architecture for Attack Surface Analysis; IET: Beijing, China, 2018.
32. Vidalis, S. A Critical Discussion of Risk and Threat Analysis Methods and Methodologies; Technical Report
CS-04-03; School of Computing, University of Glamorgan: Pontypridd, UK, 2004.
33. Information Technology—Security Techniques—Information Security Risk Management; Standard; International
Organization for Standardization: Geneva, Switzerland, 2018.
34. Hussain, S.; Kamal, A.; Ahmad, S.; Rasool, G.; Iqbal, S. Threat Modelling Methodologies: A Survey. Sci. Int.
2014, 26, 1607–1609.
35. Shostack, A. Threat Modeling: Designing for Security; Wiley: Hoboken, NJ, USA, 2014.
36. Kavallieratos, G.; Katsikas, S.; Gkioulos, V. Cyber-Attacks Against the Autonomous Ship. In Computer
Security. SECPRE 2018, CyberICPS 2018; Springer: Cham, Switzerland, 2019.
37. Vulnerabilities, C. Exposures (CVE). Available online: cve.mitre.org (accessed on 20 November 2018).
38. National Vulnerability Database. 2008. Available online: https://nvd.nist.gov/ (accessed on 24 November 2018).
39. OMNeT++, version 5.4.1. Available online: https://omnetpp.org/ (accessed on 24 November 2018).
c 2019 by the authors. Licensee MDPI, Basel, Switzerland. This article is an open access
article distributed under the terms and conditions of the Creative Commons Attribution
(CC BY) license (http://creativecommons.org/licenses/by/4.0/).You can also read