Tier 1 supplier in Aerospace, Defence & Security - Safran

Page created by Rafael Dennis
 
CONTINUE READING
Tier 1 supplier in Aerospace, Defence & Security - Safran
Tier 1 supplier in
             Aerospace, Defence & Security
              Investor roadshows

              / November 2014 /

       0 / Q3
           INVESTOR
              REVENUE
                    ROADSHOWS
                      2011 / OCTOBER
                                / November
                                      21, 2011
                                           2014/ /
Ce document et les informations qu’il contient sont la propriété de Safran. Ils ne doivent pas être copiés ni communiqués à un tiers sans l’autorisation préalable et écrite de Safran.
Tier 1 supplier in Aerospace, Defence & Security - Safran
Tier 1 supplier in Aerospace - Defence - Security

                            2013 revenue* by activities
                                                     Aircraft
                                                     Equipment
                                                                                                                                        FY 2013* (adjusted)
                                                               28%

                                                                                                                                         Revenue                                         €14,363M
Aerospace
                                                                                         9%           Defence                            Recurring op. income                            €1,780M (12.4% of revenue)
Propulsion                           53%            €14.4Bn                                                                              Net income - Group share                        €1,193M (€2.87/share)
                                                                                         10%
                                                                                                      Security                           Free Cash Flow                                  €699M
                                                                                                                                         Net debt position (Dec. 31)                     €1,220M

                               *Restated for the application of IFRS 11

       1 / INVESTOR ROADSHOWS / November 2014 /
Ce document et les informations qu’il contient sont la propriété de Safran. Ils ne doivent pas être copiés ni communiqués à un tiers sans l’autorisation préalable et écrite de Safran.
Tier 1 supplier in Aerospace, Defence & Security - Safran
Leading market positions

                                      Aerospace                                                                                          Defence                                                  Security

                               #1 ww                                                                                    #1 Europe                                                         #1 ww
                                    Single aisle engines*                                                               Optronics                                                        Biometric and ID solutions
                                    Helicopter turbines
                                    Landing gear                                                                       #3 ww                                                             A leader in aviation markets
                                    Wiring                                                                              Inertial navigation systems                                      Detection
                                    Power transmission

                               #2 ww
                                Space Propulsion
                                Engine nacelles
                                Wheels & brakes

                               #4 ww
                                Military engines

                                                                    ~80% of revenue coming from civil activities
*Through CFM International (50-50 JV with General Electric)

       2 / INVESTOR ROADSHOWS / November 2014 /
Ce document et les informations qu’il contient sont la propriété de Safran. Ils ne doivent pas être copiés ni communiqués à un tiers sans l’autorisation préalable et écrite de Safran.
Tier 1 supplier in Aerospace, Defence & Security - Safran
/ Key themes /
                           Summary of Q3 and 9m 2014 revenue
                           Positive trends in civil aftermarket
                           Investing in our future
                           2014 outlook

       3 / INVESTOR ROADSHOWS / November 2014 /
Ce document et les informations qu’il contient sont la propriété de Safran. Ils ne doivent pas être copiés ni communiqués à un tiers sans l’autorisation préalable et écrite de Safran.
Tier 1 supplier in Aerospace, Defence & Security - Safran
LEAP first flight
   Launching the next phase of testing
    LEAP first flight on a modified 747 flying testbed on October 6
    Very successful first flight: engine behaved well
    The configuration currently being tested is a fully integrated
     propulsion system (IPS*)
    LEAP-1A/-1C well on track for engine certification in 2015
   Preparing for production readiness
           CFM has a world-class supply chain
           LEAP ramp-up supported by CFM56 success
           Investments in new and enhanced manufacturing facilities and
            technology
                                                                                                                                                                                             LEAP engine takes to the skies on
   Close to 2,000 firm orders and commitments received YTD                                                                                                                                         October 6, 2014

           Bringing total backlog to more than 7,700 engines
           70%+ market share for future medium-range commercial airliners

                                     LEAP certification program progressing according to plan
* The IPS is unique to the LEAP-1C. CFM provides the engine as well as the nacelle and thrust reverser developed by Nexcelle (JV between Safran and GE). These
elements, including the pylon provided by COMAC, were designed in conjunction with each other to offer improved aerodynamics, lower weight and easier maintenance

          4 / INVESTOR ROADSHOWS / November 2014 /
   Ce document et les informations qu’il contient sont la propriété de Safran. Ils ne doivent pas être copiés ni communiqués à un tiers sans l’autorisation préalable et écrite de Safran.
Tier 1 supplier in Aerospace, Defence & Security - Safran
Q3 2014 and 9m 2014 financial highlights
                                                                                                                                                                                      +5.2%
                                                                                                                                                                                              10,797
                                                                                                                                                                 10,268

                                                                             +6.8%
                                                        3,361                                     3,589

                                           (€M)                                                                                                      (€M)

                                                      Q3 2013                                  Q3 2014                                                          9m 2013                       9m 2014

              Strong revenue growth in Q3 driven by continuing momentum in Propulsion. With a 5.2% increase in the
               9m 2014 period, Safran is well on track to achieve its full year revenue guidance of mid single digit
               growth.

              Propulsion continued to benefit from services growth (+15.9%), notably in civil aftermarket. Aircraft
               Equipment growth is driven by increasing OE sales. Revenue declined slightly in Defence. Security
               recorded another quarter of organic growth (+6.3%) fuelled by Identification activities.

              Civil aftermarket was up 11.9% in USD terms in Q3 driven by higher spares revenue from CFM56 and
               GE90 engines despite a high comparison base in Q3 2013. YTD growth was 10.3%, driven by first
               overhaul activity on recent CFM56 and GE90 engines, compared to a high level of business in 9m 2013
               continuing in Q4 2013.
       5 / INVESTOR ROADSHOWS / November 2014 /
Ce document et les informations qu’il contient sont la propriété de Safran. Ils ne doivent pas être copiés ni communiqués à un tiers sans l’autorisation préalable et écrite de Safran.
Tier 1 supplier in Aerospace, Defence & Security - Safran
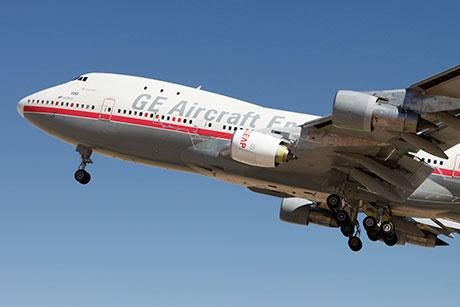
Q3 2014 revenue by activity
                                                                                                                                                                                 Main growth drivers
                                                                                                                                                                                         Continuing momentum in Propulsion, particularly
                                                                                                                                                                                          in services (+15.9% in €):

                                                                  Q3 2013                                                                                                                    Services: 11.9% growth in civil aftermarket (in $)
 Adjusted data                                                                                                            Change                     Change                                   driven by higher spare parts sales of CFM56 and
                                                                                               Q3 2014                                                                                        GE90 engines. Good contribution of military
 (in Euro million)
                                                                  Restated                                                reported                   organic
                                                                                                                                                                                              services and helicopter support activities.

                                                                                                                                                                                             Original equipment: slightly higher volumes and
 Aerospace propulsion                                                 1,771                       1,944                       9.8%                      8.9%                                  favourable mix in CFM56 and high thrust
                                                                                                                                                                                              engines. Increase in military engines deliveries
                                                                                                                                                                                              (M88, TP400)
 Aircraft equipment                                                       982                     1,021                       4.0%                      4.7%
                                                                                                                                                                                         Equipment: OE driven growth, notably thanks to
                                                                                                                                                                                          the ramp up of the 787 (LG and wiring) and higher
 Defence                                                                  258                          256                   (0.8)%                    (4.3)%                             A380 nacelles volumes

 Security                                                                 349                          368                    5.4%                      6.3%                             Security: strong growth in Identification
                                                                                                                                                                                          (Morphotrust in the US, Government Solutions in
                                                                                                                                                                                          Chile and in Europe)
 Others                                                                         1                             -                   na                        na
                                                                                                                                                                                 Offsetting impacts

 Total revenue                                                        3,361                        3,589                      6.8%                      6.3%                             Lower helicopter turbine volumes

                                                                                                                                                                                         Lower revenue in Enterprise Solutions
                                                                                                                                                                                          (smartcards)
                                                                                                                                                                                         Softness in Optronics

       6 / INVESTOR ROADSHOWS / November 2014 /
Ce document et les informations qu’il contient sont la propriété de Safran. Ils ne doivent pas être copiés ni communiqués à un tiers sans l’autorisation préalable et écrite de Safran.
Tier 1 supplier in Aerospace, Defence & Security - Safran
9M 2014 revenue by activity

                                                                                                                   9m 2013                                                   Change       Change
                                                  Adjusted data                                                                                9m 2014
                                                 (in Euro million)
                                                                                                                    restated                                                 reported     organic

                                                  Aerospace propulsion                                                 5,442                       5,707                         4.9%      4.4%

                                                  Aircraft equipment                                                   2,927                       3,158                         7.9%      9.3%

                                                  Defence                                                                  824                         840                       1.9%      1.0%

                                                  Security                                                             1,073                       1,090                         1.6%      5.4%

                                                  Others                                                                         2                           2                      na      na

                                                  Total revenue                                                      10,268                       10,797                         5.2%      5.6%

       7 / INVESTOR ROADSHOWS / November 2014 /
Ce document et les informations qu’il contient sont la propriété de Safran. Ils ne doivent pas être copiés ni communiqués à un tiers sans l’autorisation préalable et écrite de Safran.
Tier 1 supplier in Aerospace, Defence & Security - Safran
Aerospace OE* / Services revenue split

                                                                                       Q3 2013                                                   Q3 2014                                    % change
                                       Revenue
                                  Adjusted data
                                   (in Euro million)                           OE                    Services                            OE                    Services                   OE     Services

                                    Propulsion                                888                          883                          921                        1,023                  3.7%    15.9%
                                   % of revenue                             50.1%                        49.9%                        47.4%                        52.6%

                                    Equipment                                 698                          284                          731                          290                  4.7%    2.1%
                                   % of revenue                             71.1%                        28.9%                        71.6%                        28.4%

                                                                                        9m 2013                                                   9m 2014                                   % change
                                       Revenue
                                   Adjusted data
                                   (in Euro million)                            OE                     Services                           OE                     Services                 OE     Services

                                    Propulsion                               2,817                        2,625                        2,820                        2,887                 0.1%    10.0%
                                   % of revenue                              51.8%                        48.2%                        49.4%                        50.6%

                                    Equipment                                2,088                           839                       2,278                          880                 9.1%    4.9%
                                   % of revenue                              71.3%                        28.7%                        72.1%                        27.9%

                                                                                                                                                                                                       (*) All revenue except services

       8 / INVESTOR ROADSHOWS / November 2014 /
Ce document et les informations qu’il contient sont la propriété de Safran. Ils ne doivent pas être copiés ni communiqués à un tiers sans l’autorisation préalable et écrite de Safran.
Tier 1 supplier in Aerospace, Defence & Security - Safran
Quantities of major aerospace programs

                                                                                       Q3 2013                         Q3 2014                                 %                      9m 2013     9m 2014    %
           Number of units delivered

          CFM56 engines                                                                          373                             382                              2%                      1,145    1,174      3%

          High thrust engines                                                                    146                             155                              6%                       450       503     12%

          Helicopter engines                                                                     225                             170                       (24)%                           713       531    (26)%

          M88 engines                                                                                  2                               6                            x3                      16        18     13%

          TP400                                                                                        7                            14                              x2                      18        26     44%

          787 landing gear sets                                                                     13                              29                         x2.2                         44        88         x2

          A380 nacelles                                                                             20                              27                         35%                          72        84     17%

          A330 thrust reversers                                                                     58                              38                     (34)%                           124       122     (2)%

          A320 thrust reversers                                                                  138                             111                       (20)%                           399       369     (8)%

          Small nacelles (biz & regional jets)                                                   143                             179                           25%                         400       487     22%

       9 / INVESTOR ROADSHOWS / November 2014 /
Ce document et les informations qu’il contient sont la propriété de Safran. Ils ne doivent pas être copiés ni communiqués à un tiers sans l’autorisation préalable et écrite de Safran.
/ Key themes /
                           Summary of Q3 and 9m 2014 revenue
                           Positive trends in civil aftermarket
                           Investing in our future
                           2014 Outlook

     10 / INVESTOR ROADSHOWS / November 2014 /
Ce document et les informations qu’il contient sont la propriété de Safran. Ils ne doivent pas être copiés ni communiqués à un tiers sans l’autorisation préalable et écrite de Safran.
9m 2014: positive trends in Civil aftermarket

  Civil aftermarket up 10.3%* YTD
     Q1 +12.4%; Q2 +6.5%; Q3 +11.9%
     Q3 2014 was driven by higher spares revenue from CFM56 and GE90 engines
       despite a high comparison base in Q3 2013

  Growth drivers
     More, higher value shop visits on recent CFM56
     Strong increase in GE90 aftermarket
     Catch-up of deferred maintenance as airlines’ financial health improves

  Aftermarket recoupling to airline activity
     Confirms CFM56 fleet potential for spares revenue to double from 2010 dip
       before 2020e
     Positive global outlook for the airline industry in 2014 according to IATA

*In USD
                                                                       Continuing momentum in civil aftermarket

      11 / INVESTOR ROADSHOWS / November 2014 /
 Ce document et les informations qu’il contient sont la propriété de Safran. Ils ne doivent pas être copiés ni communiqués à un tiers sans l’autorisation préalable et écrite de Safran.
Forecasting spare parts business opportunity:
the new “behaviour” model
      Dedicated project decided
       in 2011
        Analysis concluded that
         maintenance behaviour could differ
         from one airline to another,                                                                                                                                                                             Air traffic forecast
         impacting new spare parts sales
        Segment behaviour also varies                                                                                                                       Economics

         according to economic context and
                                                                                                                                                                                                 Airlines maintenance behaviour
         air traffic

      New model based on airlines
                                                                                                                                                                    Customer
       segmentation
        Differentiate segments according to                                                                          Maintenance contracts
         maintenance behaviour
        Simulate airlines’ reaction to
         changing macro-economic                                                                                                                                             Theoretical aging
         environment
                                                                                                                                                                                                            Engine constraints

      12 / INVESTOR ROADSHOWS / November 2014 /
 Ce document et les informations qu’il contient sont la propriété de Safran. Ils ne doivent pas être copiés ni communiqués à un tiers sans l’autorisation préalable et écrite de Safran.
CFM56: strong prospects until 2025 and beyond

                                                                                     CFM56 spare parts revenue to peak by around 2025E

                                                                CFM56 active installed fleet to peak by 2018E
                                                                at ~26,500 engines (~31,000 deliveries)

      13 / INVESTOR ROADSHOWS / November 2014 /
 Ce document et les informations qu’il contient sont la propriété de Safran. Ils ne doivent pas être copiés ni communiqués à un tiers sans l’autorisation préalable et écrite de Safran.
Forecasting spare parts
Outcome of the new model (CFM56 spare parts forecast)

                                        Expected CFM56 spare parts
                                              revenue profile

                                                                                                                                                                 CFM56 spare parts revenue to increase
                                                                                                                                                                  consistently and to peak by around 2025E
                                                                                                                           3x
                   2010 dip                                                2x                                                                                    Revenue should double from 2010 dip before
                         x                                                                                                                                        2020E

                                                                                                                                                                 1st generation CFM56 spare parts potential to fade
                                                                                                                                                                  out within 5 years from now
  2007               2010               2013               2016               2019               2022               2025               2028

                                       The new model confirms 2025 horizon
                            “Behaviour” model adds increased visibility on the short term

      14 / INVESTOR ROADSHOWS / November 2014 /
 Ce document et les informations qu’il contient sont la propriété de Safran. Ils ne doivent pas être copiés ni communiqués à un tiers sans l’autorisation préalable et écrite de Safran.
Service agreements
A variety of aftermarket options tailored to needs
     T&M: Time & Material
       CFM is paid at the time of the actual shop visit on the basis
        of an agreed-upon scope of material and labour
         income, expenses and cash impact coincide

     MSA: Material Service Agreement
       CFM guarantees commercial conditions of parts supply
        to airline/MRO providers

     RPFH: Rate Per Flight Hour
       CFM receives a fixed sum per flight hour based on estimated cost to
        perform engine maintenance to meet performance and availability                                                                                                                   Service programmes aiming to
                                                                                                                                                                                          support airlines on a predictable
        guarantees                                                                                                                                                                        cost per engine flight hour
         decoupling of revenue & cash-in with costs & cash-out                                                                                                                           basis, to enable accurate
                                                                                                                                                                                          forecasting of operating costs,
       ESPO (Engine Service Per Overhaul): fraction of revenue booked                                                                                                                    reduced cost of ownership, and
        progressively and remainder booked at the time of SV                                                                                                                              improved asset utilisation

       ESPH (Engine Service Per Hour): revenue booked progressively

     15 / INVESTOR ROADSHOWS / November 2014 /
Ce document et les informations qu’il contient sont la propriété de Safran. Ils ne doivent pas être copiés ni communiqués à un tiers sans l’autorisation préalable et écrite de Safran.
Slow transition in business model

                                   Active installed fleet of engines
                                          in 2020E (estimate)

                 30 000
                                                                                                                          T&M
                                       ~25,000                                                                                                               Strong adoption of LEAP customers of
                 25 000                                                                                                   RPFH
                                                                                                                                                              RPFH but LEAP fleet will represent ~10% of
                                                                                                                                                              combined CFM fleet (by 2020E)
                 20 000

                                                                                                                                                             CFM56 is mostly based on
                 15 000
                                                                                                                                                              Time & Material
                 10 000
                                                                                                                                                             Therefore, no material change expected
                    5 000                                         ~2,700                    ~3,000                                                            from RPFH accounting
                                                                                                                                                              by 2020E
                            0
                                         CFM56                       GE90                      LEAP

                                        2014 to 2025: P&L will remain dominated by current model
                                                      Impact of RPFH will be gradual

      16 / INVESTOR ROADSHOWS / November 2014 /
 Ce document et les informations qu’il contient sont la propriété de Safran. Ils ne doivent pas être copiés ni communiqués à un tiers sans l’autorisation préalable et écrite de Safran.
/ Key themes /
                           Summary of Q3 and 9m 2014 revenue
                           Positive trends in civil aftermarket
                           Investing in our future
                           2014 Outlook

     17 / INVESTOR ROADSHOWS / November 2014 /
Ce document et les informations qu’il contient sont la propriété de Safran. Ils ne doivent pas être copiés ni communiqués à un tiers sans l’autorisation préalable et écrite de Safran.
CFM56 lives longer, LEAP sells better
             # deliveries
                                                                                                                                                                                Increasing assembly rates for
                                                                                                                                                                                 narrowbodies

                                                                                                                                                     1,800+
                                                                                                                                                                                Faster LEAP ramp up
                                                                                                                                                                                          Outstanding commercial success:
                    1,550

                                                                                                                                                                                           more than 7,700 engines in backlog vs
                                                                                                                                                                                           5,700 at 31 Dec. 2013
                                                                                                                                                                                          1,800 LEAP in 2020, 100 engines per
                                                                                                                                                                                           year more than 2013 CMD forecast

                                                                                                                                                                                Higher CFM56 volumes over 2015-20
                                                                                                                                                                                          Strong backlog of 4,800 engines reflects
                                                                                                                                                                                           sustaining demand and healthy order
                                                                                                                                                                                           intake rate YTD
                                                                                                                                                                                          Increasing market share on A320ceo
                                                                                                                                                                                          More than 400 additional CFM56
                                                                                                                                                                                           engines to be delivered in 2015-20
                              (e)                  (e)                  (e)                  (e)                   (e)                  (e)                   (e)                          compared to 2013 CMD forecast

                                                   Capturing positive momentum of narrowbody segment

      18 / INVESTOR ROADSHOWS / November 2014 /
 Ce document et les informations qu’il contient sont la propriété de Safran. Ils ne doivent pas être copiés ni communiqués à un tiers sans l’autorisation préalable et écrite de Safran.
Increased 2014 R&D and capex targets

                      CFM56                                                                                                LEAP                                                               GE9X
                                                                                                         Programme
                                                                                                         Development
                    Higher                                                                                                                                                                    New
                                                                                                         Acceleration
                   Volumes                                                                                 + Higher                                                                        Opportunities
                                                                                                       Production Rates

                                  Increased R&D, capex to meet accelerated targets and opportunities
                                  fully justified by the programmes’ outstanding commercial success.
                                               Cash consuming investments peaking in 2014.

      19 / INVESTOR ROADSHOWS / November 2014 /
 Ce document et les informations qu’il contient sont la propriété de Safran. Ils ne doivent pas être copiés ni communiqués à un tiers sans l’autorisation préalable et écrite de Safran.
Cash allocation in line with Group strategy

                                    Research & Development
                                       Create a distinctive difference through technological innovation (long term)
                                       Spending reflects winning some attractive new business (medium term)
        Business

                                    Capital expenditure
                                       Modernize existing sites and strengthen the international scope

                                    Acquisitions
                                       Accelerate or establish positions in critical areas at justified price
        Shareholders

                                    Dividend payments
                                       Grow cash returns to shareholders
                                       40% payout of adjusted net income since 2007

      20 / INVESTOR ROADSHOWS / November 2014 /
 Ce document et les informations qu’il contient sont la propriété de Safran. Ils ne doivent pas être copiés ni communiqués à un tiers sans l’autorisation préalable et écrite de Safran.
Increasing cash returns to shareholders
              Dividend
              per share
              (€)
              Final Dividend
              distribution
              (€M)                                                                                                                                                  1.12

                                                                                                                                        0.96
              Interim
              dividend
                                                                                                                                                                                               2013 dividend: €1.12 per share
              distribution
              (€M)
                                                                                                                                                                                                     €0.48 interim dividend already
                                                                                                          0.62                                                       267
                                                                                                                                        271                                                           paid in 2013 (€200M)
                                                                            0.50
                                                0.38                                                                                                                                                 €0.64 paid in june 2014
                                                                                                           154                                                                                        (€267M)
                    0.25
                                                                              202
                      72                         152                                                        102                         129                          200
                      32
                   2008                         2009                         2010                         2011                         2012                        2013
Total
dividend     104                                152                          202                          256                          400                          467
distribution
(€M)

              More than €1.5 billion returned to shareholders from 2008 to 2013

       21 / INVESTOR ROADSHOWS / November 2014 /
  Ce document et les informations qu’il contient sont la propriété de Safran. Ils ne doivent pas être copiés ni communiqués à un tiers sans l’autorisation préalable et écrite de Safran.
/ Key themes /
                           Summary of Q3 and 9m 2014 revenue
                           Positive trends in civil aftermarket
                           Investing in our future
                           2014 Outlook

     22 / INVESTOR ROADSHOWS / November 2014 /
Ce document et les informations qu’il contient sont la propriété de Safran. Ils ne doivent pas être copiés ni communiqués à un tiers sans l’autorisation préalable et écrite de Safran.
2014 key assumptions

          Healthy increase in aerospace OE deliveries
             Propulsion : CFM56, high thrust; Equipment : Boeing 787, A330, A350, regional jets...

          Civil aftermarket growth in the low to mid-teens percentage
              Driven by recent CFM56 and GE90 engines

          Increase of self-funded R&D of the order of € 50 M to € 100 M compared to 2013, with a
           lower level of capitalisation
              Intensification and acceleration of LEAP testing and certification, GE9X commencing,
                Silvercrest stabilising, helicopter turbines higher

          Increase of tangible capex of the order of € 70 M to € 100 M compared with 2013
              Intensification and acceleration of LEAP testing and certification, capacity increases

          Profitable growth for the security business
              Characterised by significant exposure to translation effect

          On-going Safran+ plan to enhance the cost structure and reduce overhead

      23 / INVESTOR ROADSHOWS / November 2014 /
 Ce document et les informations qu’il contient sont la propriété de Safran. Ils ne doivent pas être copiés ni communiqués à un tiers sans l’autorisation préalable et écrite de Safran.
FY 2014 outlook

                 The full-year 2014 adjusted revenue and adjusted EBIT outlook is confirmed:

               Adjusted revenue expected to increase by a percentage in mid single digits
                at an estimated average rate of USD 1.30 to the Euro.

               Adjusted recurring operating income expected to increase by a percentage
                approaching the mid teens at a hedge rate of USD 1.26 to the Euro.
                            The hedging policy isolates adjusted recurring operating income from current EUR/USD
                            variations except for the part generated in USD by activities located in the US, subject to the
                            translation effect when converted into Euro.

               Regarding free cash flow, cash flow linked to business performance will be
                consistent with objectives, while significant uncertainty remains concerning
                the rhythm of payments (including advance payments) by State-customers in
                the fourth quarter.

      24 / INVESTOR ROADSHOWS / November 2014 /
 Ce document et les informations qu’il contient sont la propriété de Safran. Ils ne doivent pas être copiés ni communiqués à un tiers sans l’autorisation préalable et écrite de Safran.
/ Annexe /
                          Additional information

     25 / INVESTOR ROADSHOWS / November 2014 /
Ce document et les informations qu’il contient sont la propriété de Safran. Ils ne doivent pas être copiés ni communiqués à un tiers sans l’autorisation préalable et écrite de Safran.
Fx hedging: $19.7bn Hedge portfolio* (Oct, 16 2014)
          Yearly Exposure: $6.5bn to $7.0bn - Higher expected level of net USD exposure
          for 2015-18 due to strong growth of businesses with exposed USD revenue
                                                                                                                                                                             2016
                2014 & 2015 fully hedged                                                                                                                                      $5.5bn achieved at $1.25 (including knock out option
   7                                                                                                                                     ($bn)                                 strategies) to rise to $6.7bn at $1.25 through
                                                                                                                                                                               accumulators as long as €/$
Fx hedging: benefiting margins over 2014-17

                                                          Estimated impact on recurring operating income
                                                                     of targeted €/$ hedge rates

                                                  €/$                                                                                                                                      EBIT impact
                                               hedge                                                                                                                                       vs. previous
                                                 rate                                                                                                                                      year (in €M)

      27 / INVESTOR ROADSHOWS / November 2014 /
 Ce document et les informations qu’il contient sont la propriété de Safran. Ils ne doivent pas être copiés ni communiqués à un tiers sans l’autorisation préalable et écrite de Safran.
H1 2014 financial highlights

 Growing adjusted revenue thanks to most                                                               Strong increase in profitability: adjusted                                          Decrease in Free Cash Flow due to
          Aerospace activities                                                                               recurring operating income                                                       increased R&D and CAPEX
                                                                                                                at 13.6% of revenue
                                   +4.4%
                                                   7,208
                                                                                                                                      +16.5%              981
                   6,907
                                                                                                                          842
                                                                                                                                                                                                      167
                                                                                                                                                                                                               (75)%

                                                                                                                                                                                                                       41
         (€M)                                                                                                (€M)                                                                             (€M)
                  H1 13                            H1 14                                                              H1 13                            H1 14                                         H1 13          H1 14
                restated*                                                                                           restated*                                                                      restated*

   Adjusted net profit (group share) at €1.52
   per share (vs €1.58 in H1 2013 including                                                                                                                                                Moderate net debt (25% gearing)
    €0.31 from the sale of Ingenico shares)
                                       (4)%                                                                                                                                                       June 30, Dec. 31, June 30,
                        658                            632                                                                                                                                         2013*    2013*     2014

                                                                                                                                                                                           (€M)

            (€M)
                   H1 13                             H1 14
                                                                                                                                                                                                  (1,317)      (1,220)      (1,797)
                 restated*                                                         (*) 2013 has been restated to reflect the changes induced by IFRS11

      28 / INVESTOR ROADSHOWS / November 2014 /
 Ce document et les informations qu’il contient sont la propriété de Safran. Ils ne doivent pas être copiés ni communiqués à un tiers sans l’autorisation préalable et écrite de Safran.
Aerospace Propulsion

                                                                                                                                                  H1 2013                                           Organic
                                                                 (In €M)                                                                                                   H1 2014         Change
                                                                                                                                                  restated                                          Change
                                                                 Revenue                                                                            3,671                     3,763        +2.5%    +2.3%
                                                                 Recurring operating income                                                            631                      745        +18.1%
                                                                                                                  % of revenue                    17.2%                      19.8%         +2.6pt
                                                                       One-off items                                                                   (15)                        (1)
                                                                 Profit (loss) from op.                                                                616                      744
                                                                                                                  % of revenue                    16.8%                    19.8%

                          Growing revenue
                                Increased volume and better mix in civil OE
                                Favourable trends in civil aftermarket
                                Positive contribution from helicopter turbine support contracts thanks to additional contribution of RTM322
                                 programme and gradual recovery in EC225 support activities
                          Excellent profitability mainly driven by civil aftermarket
                                Aftermarket (recent CFM56 and GE90 engines, helicopter turbine support contracts)
                                Impact of improved mix of civil engines OE
                                Positive currency effect

      29 / INVESTOR ROADSHOWS / November 2014 /
 Ce document et les informations qu’il contient sont la propriété de Safran. Ils ne doivent pas être copiés ni communiqués à un tiers sans l’autorisation préalable et écrite de Safran.
Aircraft Equipment

                                                                                                                                                  H1 2013                                            Organic
                                                                 (In €M)                                                                                                   H1 2014         Change
                                                                                                                                                  restated                                           Change
                                                                 Revenue                                                                            1,945                     2,137        +9.9%     +11.6%
                                                                 Recurring operating income                                                            174                     202         +16.1%
                                                                                                                  % of revenue                       8.9%                     9.5%         +0.6 pt
                                                                       One-off items                                                                      (3)                          -
                                                                 Profit (loss) from op.                                                                171                      202
                                                                                                                  % of revenue                       8.8%                     9.5%

                       OE driven revenue growth
                             Increase in OE deliveries on Boeing 787 (landing gear and wiring systems) as well as in large nacelles (A380,
                              A330) and small nacelles.
                             Higher service revenue notably in carbon brakes and in nacelles

                        Significant improvement in profitability
                             Favourable volume impact on wiring systems and on nacelles
                             Carbon brakes: high returns as a result of a larger installed base and continued air traffic growth
                             Positive currency effect

      30 / INVESTOR ROADSHOWS / November 2014 /
 Ce document et les informations qu’il contient sont la propriété de Safran. Ils ne doivent pas être copiés ni communiqués à un tiers sans l’autorisation préalable et écrite de Safran.
Defence

                                                                                                                                                  H1 2013                                             Organic
                                                                 (In €M)                                                                                                   H1 2014         Change
                                                                                                                                                  restated                                            Change
                                                                 Revenue                                                                               566                      584        +3.2%      +3.4%
                                                                 Recurring operating income                                                               45                       44      (2.2)%
                                                                                                                  % of revenue                       8.0%                     7.5%         (0.5) pt
                                                                       One-off items                                                                         2                        2
                                                                 Profit (loss) from op.                                                                   47                       46
                                                                                                                  % of revenue                       8.3%                     7.9%

                       Mid-single digit growth in Avionics and stability in Optronics revenue
                             Avionics: solid growth notably in navigation equipment
                             Optronics: delivery of the FELIN infantry combat system to two regiments of the French Army, at the same
                              rhythm as last year

                       Satisfactory level of profitability despite increased R&D expenses to maintain leading positions
                             Avionics: favourable volumes in navigation as well as productivity improvements
                             Optronics: maintenance and upgrade activity on FELIN equipment

      31 / INVESTOR ROADSHOWS / November 2014 /
 Ce document et les informations qu’il contient sont la propriété de Safran. Ils ne doivent pas être copiés ni communiqués à un tiers sans l’autorisation préalable et écrite de Safran.
Security

                                                                                                                                                  H1 2013                                           Organic
                                                                 (In €M)                                                                                                   H1 2014         Change
                                                                                                                                                  restated                                          Change
                                                                 Revenue                                                                               724                      722        (0.3)%   +5.0%
                                                                 Recurring operating income                                                               65                     65          -
                                                                                                                  % of revenue                       9.0%                     9.0%           -
                                                                       One-off items                                                                          -                    (4)
                                                                 Profit (loss) from op.                                                                   65                       61
                                                                                                                  % of revenue                       9.0%                     8.4%

                  Resumption                       of organic growth in Identification
                                 MorphoTrust delivered a good performance, driven by the on-going nationwide implementation of the federal
                                  Unified Enrolment System (UES) and TSA Pre✓™ programme
                                 Continuing momentum in Chile: close to 3 million passports and ID cards issued

                  Detection:      revenue up on higher volumes and increased contribution from services; good level of
                      profitability
                  Business      solutions: mixed performance for both telecom and banking markets as higher volumes were
                      largely offset by pricing pressures
                  Negative   translation effect from foreign currencies offset by cost reductions yielding profitability
                      improvements

      32 / INVESTOR ROADSHOWS / November 2014 /
 Ce document et les informations qu’il contient sont la propriété de Safran. Ils ne doivent pas être copiés ni communiqués à un tiers sans l’autorisation préalable et écrite de Safran.
Free Cash Flow

                                                                                                                                  H1 2013
           (in €M)                                                                                                                                         H1 2014
                                                                                                                                  restated

           Adjusted net profit                                                                                                         658                        632                       Slight increase in
                                                                                                                                                                                             Depreciation &
           Depreciation, amortization and provisions                                                                                   286                        376                        Amortisation at €(298)M
                                                                                                                                                                                            Provisions slightly higher
           Others                                                                                                                       68                        132

           Cash from operating activities                                                                                            1,012                      1,140                      Increase in working capital
                                                                                                                                                                                           requirements to cope with
           Change in WC                                                                                                              (218)                      (319)                      rising production rates in
                                                                                                                                                                                           aerospace markets
           Capex (tangible assets)                                                                                                   (227)                      (299)
                                                                                                                                                                                           Higher R&D and Capex
           Capex (intangible assets)                                                                                                 (400)                      (481)
                                                                                                                                                                                           investments
           Free cash flow                                                                                                              167                         41

      33 / INVESTOR ROADSHOWS / November 2014 /
 Ce document et les informations qu’il contient sont la propriété de Safran. Ils ne doivent pas être copiés ni communiqués à un tiers sans l’autorisation préalable et écrite de Safran.
Research & Development

                                                                                                                H1 2013
     (In €M)                                                                                                                               H1 2014                  Change
                                                                                                                Restated
     Total R&D                                                                                                      (848)                     (982)                    (134)

     External funding                                                                                                 261                       273                       12

     Total self-funded cash R&D                                                                                     (587)                     (709)                    (122)                Self-funded cash R&D effort above
     as a % of revenue                                                                                              8.5%                      9.8%                    1.3 pt                 9% of sales

     Tax credit                                                                                                        63                        73                       10                Ramp-up of LEAP continues, A350
                                                                                                                                                                                             and helicopters higher, Silvercrest
     Total self-funded cash R&D after tax credit                                                                    (524)                     (636)                    (112)                 stabilising
     Gross capitalized R&D                                                                                            290                       355                       65                Increase of capitalized costs: +€65M
     Amortised R&D                                                                                                   (37)                       (39)                     (2)
                                                                                                                                                                                            Silvercrest fully expensed
     P&L R&D in recurring EBIT                                                                                      (271)                     (320)                     (49)                 since 1 April 2014

     as a % of revenue                                                                                             3.9 %                      4.4 %                   0.5 pt

      34 / INVESTOR ROADSHOWS / November 2014 /
 Ce document et les informations qu’il contient sont la propriété de Safran. Ils ne doivent pas être copiés ni communiqués à un tiers sans l’autorisation préalable et écrite de Safran.
Net debt position

         (in €M)
                                                                                                                                                                                           Cash flow from operations
                                                                                                                                                                                            equals 1.2x EBIT
             Net debt at                                                                                                                                              Net debt at
            Dec 31, 2013*                                                                                                                                            June 30, 2014         Increase in WC requirements
                                           Cash flow                Change                                                                                                                  to cope with rising production
                                           from ops                  in WC                                                                                                                  rates in aerospace markets
                                                                                                R&D
                                                                       (319)                    and                                                                                        2013 final dividend of €266M
                                                                                               Capex                                                                                        (€0.64 per share) to parent
                                                                                                                                                                                            holders
                   (1,220)                   1,140                                                                                                                         (1,797)
                                                                                                                                                                                           “Acquisitions & Others”
                                                                                                (780)                                                                                       include:
                                                                                                                    Dividends**
                                                                                                                                                                                                 Eaton: €(197)M
                                                                                                                                             Acquisitions
                                                                                                                          (276)               & others
                                                                                                                                                                                                 Safran Aerospace
                                                                                                                                                                                                  Composites Inc., Safran
                                                                                                                                                   (342)                                          Aero Composites SAS…
                                               €41M Free Cash Flow

       *Restated for the application of IFRS11
       ** Includes €(10)M of dividends to minority interests

      35 / INVESTOR ROADSHOWS / November 2014 /
 Ce document et les informations qu’il contient sont la propriété de Safran. Ils ne doivent pas être copiés ni communiqués à un tiers sans l’autorisation préalable et écrite de Safran.
Balance sheet highlights

                                                                                                                                   Dec 31,                                                  Shareholders’ equity   up
                                                                                                                                                            June 30,
             (In €M)                                                                                                                2013                                                     by €419M
                                                                                                                                                              2014
                                                                                                                                  restated
             Goodwill                                                                                                               3,399                        3,322
             Tangible & Intangible assets                                                                                            7,083                       7,800                      OWC   increased by €293M
             Investments in joint ventures and associates                                                                                680                         687                     at €1,030M (7.0% of LTM revenue)
             Other non current assets                                                                                                    585                         624
             Operating Working Capital                                                                                                   737                     1,030
                                                                                                                                                                                            Provisions   grew slightly
             Net cash (debt)                                                                                                      (1,220)                     (1,797)

             Shareholders’ equity - Group share                                                                                      6,635                       7,054
             Minority interests                                                                                                          178                         182
             Non current liabilities (excl. net cash (debt))                                                                         2,074                       2,221
             Provisions                                                                                                              2,958                       3,084
             Other current liabilities / (assets) net                                                                                 (581)                       (875)

      36 / INVESTOR ROADSHOWS / November 2014 /
 Ce document et les informations qu’il contient sont la propriété de Safran. Ils ne doivent pas être copiés ni communiqués à un tiers sans l’autorisation préalable et écrite de Safran.
Consolidated and adjusted income statements
                                                                                                                                            Currency hedging                                  Business combinations
                                                                                                                                                                                            Amortization
                    H1 2014 reconciliation                                                            Consolidated      Re-                                       Deferred                  of intangible PPA impacts -    Adjusted
                    (In €M)                                                                              data      measurement                                    hedging                     assets -    other business     data
                                                                                                                    of revenue                                   loss / gain               Sagem/Snecma combinations
                                                                                                                                                                                               merger
                    Revenue                                                                                   6,972                        236                            -                      -              -           7,208
                    Other operating income / expense                                                         (6,408)                        (7)                         15                      74             81          (6,245)
                    Share in profit from joint ventures                                                          18                           -                           -                      -              -            18
                    Recurring operating income                                                                  582                        229                          15                      74             81            981
                    Other non-recurring operating income and
                                                                                                               (10)                           -                           -                      -              -            (10)
                    expenses
                    Profit from operations                                                                      572                        229                          15                      74             81            971
                    Cost of debt                                                                               (21)                           -                           -                      -              -            (21)

                    Foreign exchange gains (losses)                                                             455                       (229)                       (206)                      -              -            20

                    Other financial income and expense                                                         (10)                           -                           -                      -              -            (10)
                    Financial income (loss)                                                                     424                       (229)                       (206)                      -              -            (11)
                    Income tax expense                                                                        (335)                           -                         81                      (29)          (30)          (313)
                    Share in profit from associates                                                               7                           -                           -                      -              -             7
                    Profit from continuing operations                                                           668                           -                       (110)                     45             51            654
                    Profit (loss) for the period attributable to
                                                                                                               (18)                           -                         (3)                     (1)             -            (22)
                    non-controlling interests
                    Profit for the period attributable to
                                                                                                                650                           -                       (113)                     44             51            632
                    owners of the parent

      37 / INVESTOR ROADSHOWS / November 2014 /
 Ce document et les informations qu’il contient sont la propriété de Safran. Ils ne doivent pas être copiés ni communiqués à un tiers sans l’autorisation préalable et écrite de Safran.
Acquisitions: objectives & criteria
                                                 Buy “installed base”
                                                                                                                                                                                   Buy “technology assets”
                                                 & “customer access”

                                                                                                                                      HLP                           Electrical Power Systems

                                                      Colombia/Peru                                                                                                RTM322 programme

                              M&A financial criteria
                                    Cover cost of capital within 3 years (RoCE)
                Performance

                                                                                                                                                                                                     Post-tax cost of capital of 8%
                                    A deal should be EPS accretive in year 1 ideally. If not, in year 2                                                                                             (aerospace & defence)
                                                                                                                                                                                                     and 9.5% (security)
                                    ROI in the range of 10 to 12%

                                    Net debt/EBITDA around 2.0x. 2.5x max at peak for a limited period of time
             Balance
              sheet

                                    Interest cover ratio at 6x (= EBIT / Interest expense)

      38 / INVESTOR ROADSHOWS / November 2014 /
 Ce document et les informations qu’il contient sont la propriété de Safran. Ils ne doivent pas être copiés ni communiqués à un tiers sans l’autorisation préalable et écrite de Safran.
The More Electric Aircraft – an irreversible trend

                                                           Boeing 737                                                      Airbus A380                          Boeing 787                EGTS*          Next gen
                                                                                                                                                                                                          aircraft

                                                                1967                                                               2007                                 2009              2016-17         2025
                                                        Fuel pump                                                                            Fuel pump                                              Fuel pump
                                                        Landing gear                                                                         Landing gear
                                                                                                                                                                                                      E-Flight controls
                                                        Nacelle                                                                              Nacelle
           Pneumatic                                                                                                                                                                                  E-Landing gear
                                                                                                                                                                                                      E-Nacelle
            Hydraulic                                                                                                                            Wing anti-icing                                     EGTS
                                                           Wing anti-icing                                                                                                                           Wing anti-icing
                                                           Engine start and controls                                                            Engine start and controls
                                                                                                                                                 Brakes                                              Engine start and
          Mechanical                                       Brakes
                                                                                                                                                 Thrust reverser                                      controls
                                                           Thrust reverser                                                                                                                           Brakes
                                                           Flight controls                                                                      Flight controls
                                                                                                                                                                                                      Thrust reverser

                                                           Cabin equipment                                                                      Cabin equipment                                       Cabin equipment
                                                           Lighting                                                                             Lighting                                              Lighting
               Electric                                    IFE                                                                                  IFE                                                   IFE
                                                           Avionics                                                                             Avionics                                              Avionics

                                                                                                                                                                                             Electrical equipment

                                                                                       A key strategic long term market
      * The Electric Green Taxiing System allows aircraft to taxi autonomously without use of the main engines

     39 / INVESTOR ROADSHOWS / November 2014 /
Ce document et les informations qu’il contient sont la propriété de Safran. Ils ne doivent pas être copiés ni communiqués à un tiers sans l’autorisation préalable et écrite de Safran.
Affirming our strategy over the electrical energy chain

                Consolidation of all electrical power activities within Labinal Power Systems                                                                                                Long-term outlook

                                                                               A world leader in electrical                                        Strong installed base &
                                                                                power systems with combined                                          recurring aftermarket revenues             Competitive
                                                                                revenues c. € 1.4 billion in 2014                                                                                positioning in
          +                                                                                                                                                                                      aerospace electrical
                                                                                                                            Power generation                                                     systems

         +
                                         Acquisition                                                                                                                                            Capture benefits of
                                         closed in                                                                                                                             Primary &
Electrical Power systems
                                                                                    Electrical                                                                                secondary          closer integration of
                                         March 2013                                equipment                                                                                  distribution       electrical systems and
        +                                                                                                                                                                                        wiring, with aircraft
                                                                                                                                                                                                 engines and gearboxes

        +
                                                                                                                                                                                                Lead innovation in the
                                                                                                                                                                                                 electrification of aircraft
         +                                                                                                                                                                     Systems           equipment
                                                                                          Wiring                                                                              integration

                                                                                                                                                                                                Broader offering:
         +                                                                                                                         Support &                                                     higher shipset value
                                                                                                                                    Services
       PDMS                             Acquisition
                                        closed in May                          Complete offering in power                                          12,000 people in 12 countries
                                        2014                                    systems

      40 / INVESTOR ROADSHOWS / November 2014 /
 Ce document et les informations qu’il contient sont la propriété de Safran. Ils ne doivent pas être copiés ni communiqués à un tiers sans l’autorisation préalable et écrite de Safran.
Equity shareholding

                                   As of Dec. 31, 2013                                                                                                                                     As of October 30, 2014

    Public                                                                                      French State                                            Public                                                      French State
     62.8%                                                                                             22.4%                                            63.3%                                                         22.0%

                                                                                                        Employees
                                                                                                           14.7%                                                                                                     Employees
                                                                                                                                                                                                                       14.6%

                                                                                         Treasury shares                                                                                                      Treasury shares
                                                                                                    0.1%                                                                                                            0.1%

      41 / INVESTOR ROADSHOWS / November 2014 /
 Ce document et les informations qu’il contient sont la propriété de Safran. Ils ne doivent pas être copiés ni communiqués à un tiers sans l’autorisation préalable et écrite de Safran.
Definition

  Civil                   aftermarket (expressed in USD)
               This non-accounting indicator (non audited) comprises spares and MRO
                (Maintenance, Repair & Overhaul) revenue for all civil aircraft engines for Snecma
                and its subsidiaries and reflects the Group’s performance in civil aircraft engines
                aftermarket compared to the market.

      42 / INVESTOR ROADSHOWS / November 2014 /
 Ce document et les informations qu’il contient sont la propriété de Safran. Ils ne doivent pas être copiés ni communiqués à un tiers sans l’autorisation préalable et écrite de Safran.
Disclaimer

           The forecasts and forward-looking statements described in this document are based on
           the data, assumptions and estimates considered as reasonable by the Group as at the
           date of this document. These data, assumptions and estimates may evolve or change
           as a result of uncertainties related in particular to the economic, financial, competitive,
           tax or regulatory environment. The occurrence of one or more of the risks described in
           the registration document (document de référence) may also have an impact on the
           business, financial position, results and prospects of the Group and thus affect its ability
           to achieve such forecasts and forward-looking statements. The Group therefore neither
           makes any commitment, nor provides any assurance as to the achievement of the
           forecasts and forward-looking statements described in this document

      43 / INVESTOR ROADSHOWS / November 2014 /
 Ce document et les informations qu’il contient sont la propriété de Safran. Ils ne doivent pas être copiés ni communiqués à un tiers sans l’autorisation préalable et écrite de Safran.
44 / INVESTOR ROADSHOWS / November 2014 /
Ce document et les informations qu’il contient sont la propriété de Safran. Ils ne doivent pas être copiés ni communiqués à un tiers sans l’autorisation préalable et écrite de Safran.
You can also read