Timberland Investments Beyond the United States - Forest Investment AssocIAtes Reg istered Investment Adviser - Forest Investment ...
←
→
Page content transcription
If your browser does not render page correctly, please read the page content below

F o r e s t I n v e s t m e n t A s s o c iat e s
         R eg i st e re d I nve s t m e n t A dvis e r

   Timberland Investments
   Beyond the United States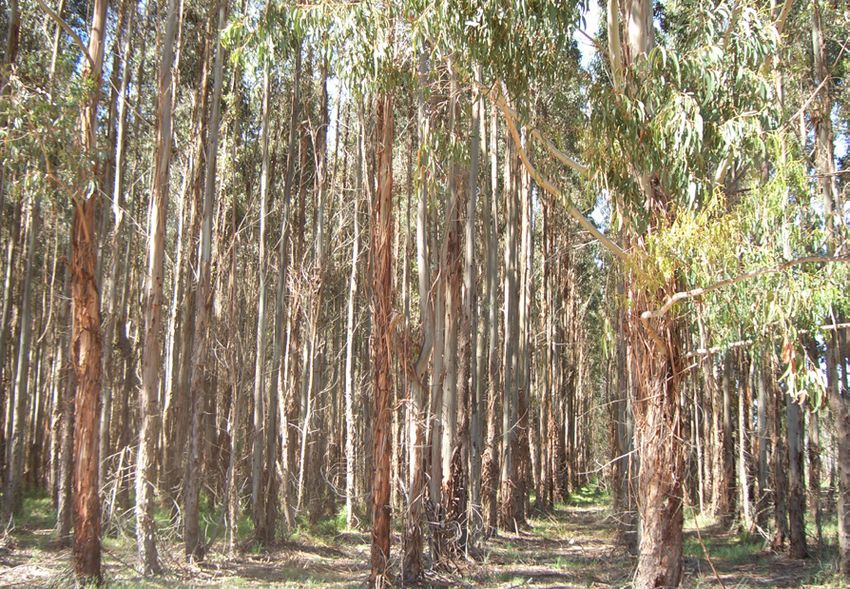
Table of Contents

Executive Summary................................................................................... 1
Benefits of Non-U.S. Timberland................................................................... 2
Evolution of an Asset Class........................................................................... 3
  Maturing Market in the U.S...................................................................... 3
  Growth in Investments Overseas................................................................ 4
World Macroeconomic Trends...................................................................... 5
  Rising Middle Class................................................................................ 5
  Supply-Demand Imbalance....................................................................... 7
     China’s Timber Deficit.......................................................................... 7
     China’s Imports.................................................................................. 8
     India’s Imports................................................................................... 9
Adding Diversification to a Global Timberland Portfolio......................................10
  Investment Environment in Australia and New Zealand....................................10
  Investment Environment in Other Mature Markets.........................................13
Enhancing Timberland Portfolio Returns with Emerging Market Exposure...............14
  Feeding the Tigers – Strategic Supply Sources................................................14
     Southeast Asia...................................................................................14
     South America..................................................................................15
    Africa.............................................................................................16
     Brazilian Timberland...........................................................................17
Understanding the Risks............................................................................19
  Country Risk.......................................................................................19
  Currency Risk.....................................................................................20
Execution - Turning Strategy into Action.........................................................21
  Strategic Overview...............................................................................21
  Investment Strategy: Mature Markets..........................................................21
  Investment Strategy: Emerging Markets.......................................................22
     Southeast Asia...................................................................................23
     South America..................................................................................24
    Africa.............................................................................................24
  Investment Strategy: Brazil......................................................................25
  Developing Strategic Relationships.............................................................25
Conclusion.............................................................................................27
Supporting Resources...............................................................................28
About the Authors....................................................................................29

                                                       F o r e s t I n v e s t m e n t A s s o c iat e s
                                                                  Re g i s t e re d I nve s t m e n t A dv i s e r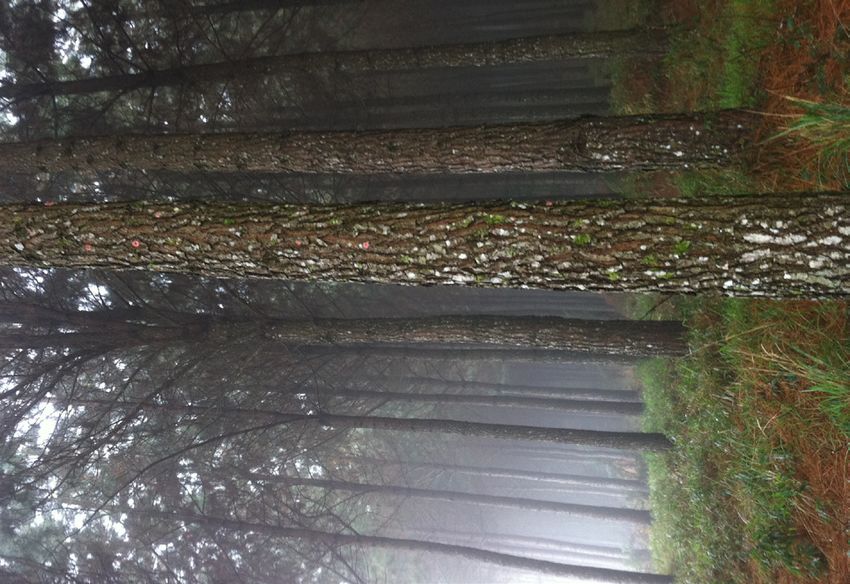
Executive Summary

The dynamics of institutional timberland
investing have changed over the past 30 years.
Timberland investments have been widely
acknowledged for their low correlations
to other assets, counter-cyclical hedging
properties and extending the efficient
frontier of portfolios. With the maturation
of U.S.-based timberland investments and
the growth of consumption in emerging
economies, it is Forest Investment Associates’
(FIA) opinion that timberland investors
should consider adapting their strategies to
the current dynamic of timberland investing
by strategically distributing capital across the
global timberland investment spectrum.
                                                   Sixteen-year-old teak plantation in Costa Rica
The U.S. will remain a major component
of global timberland portfolios; however,          capital availability. The track record in        variety in species, and industrial land ownership
the importance of global wood flows and            these countries is strong as indicated by the    coupled with the country’s highly developed
their resulting effect on the opportunity          relatively long-tenured investment history.      forest plantation capabilities facilitate a stand-
set for timberland investors has never been                                                         alone strategy for timberland investors in
more important. The rise of the middle             Both the Organisation for Economic               Brazil. Of any country in the world, Brazil has
class in countries such as Brazil, China, India    Cooperation and Development (OECD)               the capacity to rival the U.S. timberland market
and Indonesia propagates a corresponding           and the McKinsey Global Institute predict        in depth, transactions and eventual assets under
consumption of wood products. Non-                 that a majority of the world’s future            management. However, investing in Brazil
U.S. investments in a globally diversified         economic growth will be in today’s emerging      does not come without pitfalls. The country
timberland portfolio offer investors two           economies. Most of this growth will occur        consistently ranks as one of the toughest
primary benefits: enhanced returns and             in demand-rich but timber-poor emerging          countries in which to conduct business, and the
diversification. We suggest that enhanced          countries, especially China and India. Direct    2010 attorney general opinion severely restricts
returns are achievable in emerging markets         investment in these countries can be quite       foreign capital from taking title to real estate.
while diversification benefits, earning modest     difficult and investors may not be fully         Despite its challenges, Brazil should rank as a
premiums to U.S. timberland investments, are       compensated for risk exposure. FIA contends      priority for timberland investors.
available to investors in the more mature non-     that identifying geographically strategic
U.S. timberland markets.                           countries with the combination of favorable      FIA proposes three main approaches for
                                                   growing conditions, business environment         timberland investors to augment an allocated
Mature non-U.S. markets such as Australia,         and logistics is the right move. Malaysia,       or existing U.S. timberland portfolio: 1)
Chile, New Zealand and Uruguay are                 Cambodia, Indonesia,Vietnam and Laos             gaining timber market diversification through
important countries to timberland investors.       make up our strategic shortlist of Southeast     exposure to mature non-U.S. markets, 2) sup-
The investment objective is not to achieve         Asian countries well positioned to meet wood     plying the rapid growth in emerging econo-
outsized returns but to diversify cash flows       demand in China and India.                       mies, and 3) participating in the evolution of
while receiving slight premiums to U.S                                                              Brazil’s domestic forest industry. Based on risk
timberland returns. These markets have             Unlike emerging economies in Asia, Brazil        tolerance and expected return, an investor
significant capital deployed in the timberland     has a plantation-based forest products sector    can customize a mix of strategies to optimize
sector, thereby compressing discount rates         which is globally cost competitive and well      portfolio returns and achieve the objectives of
for new acquisitions given the depth of            established. The diversity of end-use markets,   the timberland investment program.

                                                                                                    F o r e s t I n v e s t m e n t A s s o c iat e s
                                                                          1                                   Re g i s t e re d I nve s t m e n t A dv i s e r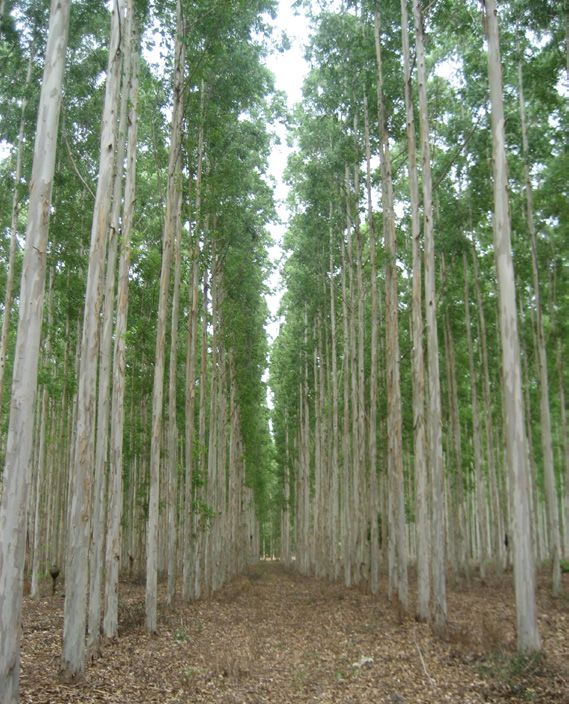
Benefits of Non-U.S. Timberland

                                        Eucalyptus plantation in the Green Triangle region of Australia

                                                          Benefits of Non-U.S. Timberland
 Including non-U.S.                                       Including non-U.S. investments in a globally    diversification while higher risk profiles in
                                                          diversified timberland portfolio offers         emerging markets offer investors higher
 investments in a globally                                investors the benefits of diversification and   potential returns. Sophisticated investors
                                                          the opportunity to earn enhanced returns.       can earn premium risk-adjusted returns
 diversified timberland                                   Focusing on the risk/return profile of          by building globally diversified timberland
                                                          specific countries allows investors to build    portfolios which are focused on supplying
 portfolio offers investors the                           a customized portfolio tailored to their        raw material to burgeoning demand centers
                                                          individual risk tolerances. Lower risk          and positioned to take advantage of world
 benefits of diversification                              profiles in mature markets offer portfolio      macroeconomic trends.
 and the opportunity to earn
 enhanced returns.

    F o r e s t I n v e s t m e n t A s s o c iat e s
             R e g i s t e re d I nvestm en t A dviser                           2
Evolution of an Asset Class

 Evolution of an Asset Class
 Maturing Market in the U.S.                                        in the South,TIMOs raised substantial amounts
 Institutional timberland investing began in the                    of capital and sought out new acquisitions.
 early 1980s when a few pioneering investors
 began acquiring timberland in the southern                         The primary source of acquisitions continued to
 United States. The region’s long history of                        be traditional forest product companies. While
 productive forest management and high level                        TIMOs raised billions in new capital, many
 of private ownership by vertically integrated                      companies fundamentally changed their strategy.
 forest products companies presented                                First and foremost, forest products companies
 early timberland investment management                             recognized TIMOs as effective managers
 organizations (TIMOs) a fertile field for                          capable of competently managing the forest
 acquisition opportunities. Early investors                         assets and acting as a supply source for their
 earned annual returns between 10% and                              industrial operations. They also realized that by
 15%. However, as the asset class became                            using capital from tax-exempt clients,TIMOs
 more accepted in portfolio asset allocations,                      could value their land at a premium over the
 competition increased and returns began to                         traditional C-corp structure which exposed
 decline. Investors began to look beyond the                        their stockholders to unfavorable tax and
 South to other regions including the Pacific                       accounting treatment. Many companies became
 Northwest and select areas of the Northeast                        motivated sellers and liquidated their land bases
 and Lake States where they could diversify                         providing TIMOs ample opportunity to acquire
 their holdings and potentially earn higher                         high-quality timberlands. This dynamic resulted
 returns. By the early 2000s,TIMOs operated                         in a shift in land ownership with vertically
 in all major timberland regions of the U.S. with                   integrated forest products companies no longer
 a few managers active in other countries such                      maintaining their position as the dominant
 as New Zealand. Building upon their success                        industrial forestland owner (Figure 1).
                        6,000

                        5,000
                                                                                                                             1995
                                                                                                                             2009
Thousands of Hectares

                        4,000

                                                             F o r e s t I n v e s t m e n t A s s o c iat e s
                        3,000

                        2,000

                        1,000

                           -
                                    IP      WY      GP      MWV     Abitibi   Temple   Smurfit-Stone   LP   Sappi NA   PCA          Stora NA
                                                                    Bowater   Inland

                                Figure 1. North American industrial timberland ownership comparison (1995 vs. 2009).
                                 Source: Goldman Sachs

                                                                                                                             F o r e s t I n v e s t m e n t A s s o c iat e s
                                                                                               3                                          Re g i s t e re d I nve s t m e n t A dv i s e r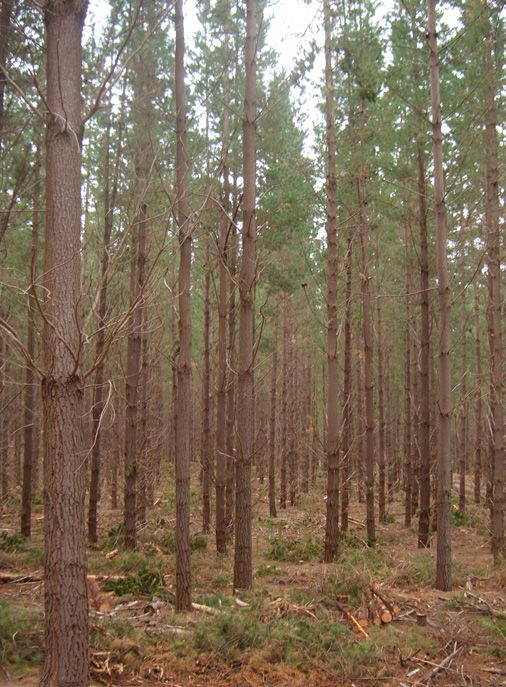
Evolution of an Asset Class
Growth in Investments Overseas regions, especially those in the developing
Investments outside the U.S. have been world, continue to emerge as their forest
growing rapidly over the past five years industries develop and their governments
and comprise more than a quarter of all take steps to encourage foreign investment in
timberland investments made by U.S. rural industries. Astute managers recognize
managers (Figure 2). While the U.S. will the market inefficiencies of many of these
continue to be core to global timberland regions as similar to past conditions in the
investments, much of the future growth of U.S. Brazil’s forestland ownership, dominated
the industry will occur beyond its borders. today by vertically integrated forest products
Investors looking beyond the U.S. will find a companies, mirrors the state of the U.S.
favorable deal environment, not unlike early forestland ownership in the late 1990s, while
investors branching out beyond the South the shift from natural forest management to
two decades ago. While some managers have plantation management in Southeast Asia is
been operating overseas for more than 10 remarkably similar to the U.S. forest industry
years, the opportunity set still has substantial in the 1930s and 1940s.
room for expansion. New countries and
50
45
International Domestic US
40
35
30
F o r e s t I n v e s t m e n t A s s o c iat e s
Assets ($ Billions)
25
20
15
10
5
0
82
83
85
86
88
89
90
91
92
93
95
96
98
99
00
01
02
03
05
06
08
09
10
11
84
87
94
97
04
07
20
19
19
19
19
19
19
19
19
19
19
19
19
19
19
20
20
20
20
20
20
20
20
20
19
19
19
19
20
20
Figure 2. Assets under management by U.S.-based TIMOs.
Year Source: FIA internal research
Source: FIA internal research
F o r e s t I n v e s t m e n t A s s o c iat e s
R e g i s t e re d I nvestm en t A dviser 4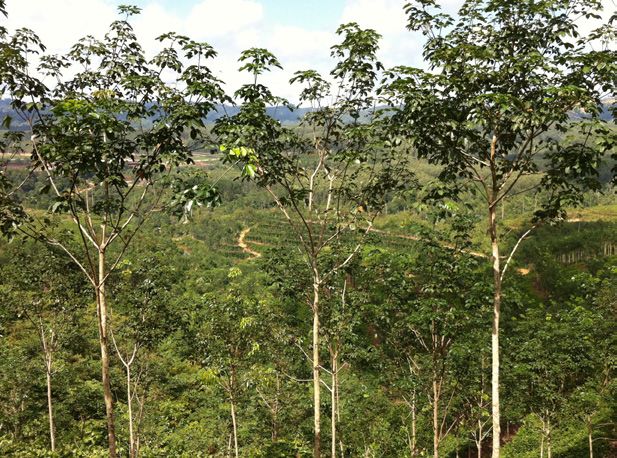
World Macroeconomic Trends

World Macroeconomic Trends
Two world macroeconomic trends will impact           Currently, Asia accounts for roughly one-
global timberland investment and drive the           quarter of today’s middle class population, but
industry’s growth going forward: a growing           by 2020 more than half of the world’s middle           Improved living conditions
middle class in emerging economies and               class could be in Asia and account for over
wood supply/demand imbalance. Improved               40% of middle class consumption.                       are highly correlated to
living conditions are highly correlated to an
increased use of forest products as consumers        New middle class consumers will increase               an increased use of forest
have more discretionary income. However,             their per capita wood use in many ways as they
many of these emerging economies lack                move into new houses or apartments, which              products as consumers have
the natural resources to supply increasing           will be built using everything from lumber for
demand. As a result, other countries with            concrete forms to finished wood products for           more discretionary income.
more natural resources are positioning               doors and flooring. In China alone, Resource
themselves to meet wood product demand in            Information Systems, Inc. (RISI) predicts that
growing economies. For example, China runs           new residential construction will increase
a significant timber deficit which will cause it     from an average of 675 million m² per year
to rely heavily on imports.                          from 2006 through 2010 to 975 million m²
                                                     per year from 2011 through 2015 (a 44.5%
Rising Middle Class                                  increase). Additionally, they will also buy
The size of the middle class will increase           wooden furniture for their homes. Paper
globally as world economic output grows.             consumption will increase as goods packaged
A report by the OECD predicts it could               in paper are more widely sold. The use of
double over the next 20 years with much              sanitary items such as napkins, toilet tissue and
of the growth centered in Asia (Table 1).            paper towels will increase also.

                                                   2009                            2020                            2030
                                     Middle Class                      Middle Class                      Middle Class
                                                      % of World                        % of World                          % of World
                                      Population                        Population                        Population
                                                      Middle Class                      Middle Class                        Middle Class
                                      (millions)                        (millions)                        (millions)
 North America                                 338            18%                 333          10%               322                       7%
 Europe                                        664            36%                 703          22%               680                      14%
 Central & South America                       181            10%                 251           8%               313                       6%
 Asia Pacific                                  525            28%               1,740          53%             3,228                      66%
 Sub-Saharan Africa                             32             2%                  57           2%               107                       2%
 Middle East & North Africa                    105             6%                 165           5%               234                       5%
 World                                       1,845           100%               3,249         100%             4,884                     100%
Table 1. Population of the middle class, actual (2009) and projected (2020 and 2030).
 Source: OECD

                                                                                                          F o r e s t I n v e s t m e n t A s s o c iat e s
                                                                            5                                      Re g i s t e re d I nve s t m e n t A dv i s e r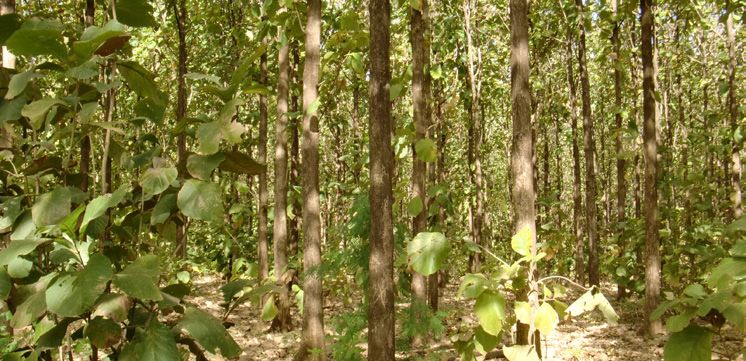
World Macroeconomic Trends
Emerging countries, especially in Asia (and only 61%, compared to 82% in China. The
China and India in particular), will be the rate will increase over time as more people
world’s new centers of growth, raising their enter the labor force which is predicted to
shares of global income and their importance grow 1.7% per year while the population
in the global economy (Figure 3). grows just 1.2% per year (RISI).
While India has seen slower income growth A report by the McKinsey Global Institute
than China, current demographics show further highlights the importance of today’s
incomes are positioned to take off. Currently, emerging economies to future world growth.
India has a labor force participation rate of The report focuses on identifying which urban
1,400
1,200
China India
Index of gross national income
1,000
800
F o r e s t I n v e s t m e n t A s s o c iat e s
600
400
200
0
80
82
84
86
88
90
92
94
96
98
00
02
04
06
08
19
19
19
19
19
19
19
19
19
19
20
20
20
20
20
Figure 3. Change in gross national income in China and India (Real, 1980 = 100)
Source: WorldBank data
F o r e s t I n v e s t m e n t A s s o c iat e s
R e g i s t e re d I nvestm en t A dviser 6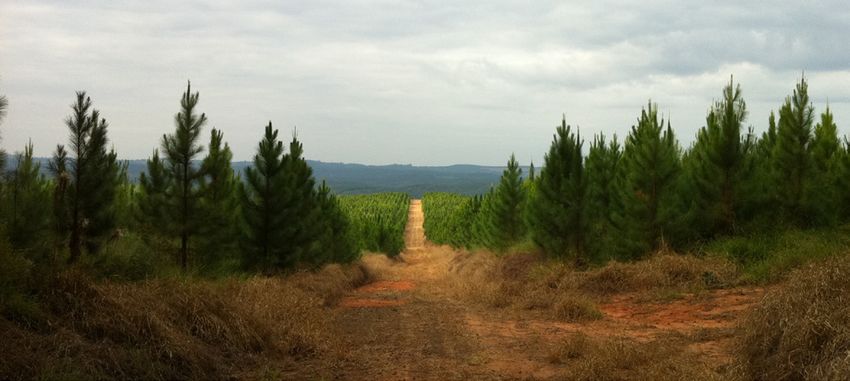
World Macroeconomic Trends

areas will experience the largest increases in                raw materials and finished products to meet
population and economic growth. A total of                    growing consumer demand.
423 city centers in developing countries are
expected to account for 45% of world GDP                      China’s Timber Deficit
growth in the next 15 years (Figure 4).                       Recent investments made in China’s forest
                                                              estate have been focused on conservation
Supply-Demand Imbalance                                       rather than timber production in response to
A second macroeconomic trend is China’s,                      devastating floods in the late 1990s. According
as well as many emerging economies,                           to RISI, while the total forest area has increased
continued imports of all types of wood and                    by 28 million hectares (18%) since 1998, the
wood products. To develop our platform                        area of timber producing forest decreased by
for investing outside the U.S., FIA analyzed                  35 million hectares and now makes up just
global wood flows with a focus on supplying                   35% of forested areas.

        Mega - and middleweight developing world cities:                            Mega - and middleweight developed cities:
                  45 percent of global growth                                              16 percent of global growth
                                                                                                                             10                100
                                                                                                   4         2       1
                                                                                          10
                                                                        28        74
                                           F o r e s t I n v e s t m e n t A s s o c iat e s
                                                    3          1
                                 5         2
             3         2
   29

  China     South South-       Latin    Eastern   Middle      Sub-     Devel-     Total    United   West-     North-   Austral-    Devel-      Global
 Region2    Asia3  east        Amer-    Europe    East and   Saharan    oping    Devel-    States    ern       east      asia       oped       Growth
                   Asia4        ica       and      North      Africa   Regions    oping     and     Europe     Asia                Regions
  ––––––– Asia –––––––                  Central    Africa               S&R5     Regions   Canada                                   S&R6
                                         Asia
  225        38        21        66       29        30         14                           98       48         23        8                    Number of cities in the City 600

Figure 4. Number of cities generating contributions to GDP growth by geography1.
 Source: McKinsey Global Institute Cityscope 1.0

1 Predicted real exchange rate 100% of projected GDP Growth through 2025 = $54.9 trillion
2 Includes cities in China (including Hong Kong and Macau) and Taiwan
3 Includes cities in Afghanistan, Bangladesh, India, Pakistan and Sri Lanka
4 Includes cities in Cambodia, Indonesia, Laos, Malaysia, Myanmar, Papua New Guinea, Philippines, Singapore,Thailand and Vietnam
5 S&R = small cities and rural areas.
NOTE: Numbers may not sum due to rounding.

                                                                                                                              F o r e s t I n v e s t m e n t A s s o c iat e s
                                                                                           7                                                 Re g i s t e re d I nve s t m e n t A dv i s e r
World Macroeconomic Trends

                                                              This lack of productive industrial timber          while Chinese industries are building their
                                                              supply has engendered a huge reliance              own ships. Between 2011 and 2014, 14
                                                              on imports of both raw materials and               new pulp mills will be opened in China,
                                                              finished products. RISI estimates “timber          increasing future demand for chips. The
                                                              supply deficit” by looking at the amount           total planned capacity for these mills will
                                                              of imported wood each year (Figure 5).             exceed 3.5 million tons with two having
                                                              Through 2015, China will increase imports          700,000 tons-per-year capacity each. In
                                                              of all major products.                             addition to importing chips for its own pulp
                                                                                                                 mills, China will also increase its imports of
                                                              China’s Imports                                    pulp. Countries with developed pulp and
                                                              The expanding pulp and paper industry is           paper industries and low costs of production,
                                                              rapidly increasing its imports. To facilitate      especially Latin American countries such as
                                                              hardwood chip imports, large Chinese               Brazil and Chile, will be competitive suppliers
                                                              pulp mills have built their own docks              of pulp to paper companies in China.

                                           200
                                                        n   Woodchips
                                           180          n   Pulp
                                           160
                                                        n   Wood Panels
                                                        n   Lumber
                                           140          n   Logs

                                           120
                             Millions m3

                                                                             F o r e s t I n v e s t m e n t A s s o c iat e s
                                           100

                                            80

                                            60

                                            40

                                            20

                                             0
                                                         1995                   2000                   2005                  2010                 2015
                                                 Figure 5. China’s actual and projected timber supply deficit as estimated by RISI
                                                  Source: RISI

   F o r e s t I n v e s t m e n t A s s o c iat e s
            R e g i s t e re d I nvestm en t A dviser                                  8
World Macroeconomic Trends
China will continue to increase imports of softwood logs, especially from New Zealand.
both logs and lumber1. A large percentage of Wood-based industries have continued to
this material will be used as shipping crates expand and India’s largest port, located in the
or in housing construction, but a significant Kutch District, has sparked rapid growth in the
share will also be processed into finished industry. Today, the region around the port has
products. Low labor costs allow China approximately 500 sawmills, 70 plywood and
to compete as a manufacturer of finished veneer mills, two fiberboard plants and one
products such as plywood and wooden paper laminate plant. While tropical hardwood
furniture in the global marketplace. Although logs will continue to be imported, much of
China was once a net importer of plywood, the future import growth is expected to come
it now exports plywood made from a from softwood logs.
combination of imported and domestic logs.
Ownership of timberland in India is
India’s Imports fragmented and dominated by small
India has been slower to develop its infrastruc- landowners, prohibiting domestic sources
ture and lags behind China in total volume from adequately supplying local mills. Due
imported. Historically, India has focused on to its tariff structure (which has been as high
importing hardwood logs as certain species, as 40% on processed wood), India imports
such as teak and sandalwood, are highly sought more logs than lumber. India’s small import
after and have many local uses (Figure 6). It market will not likely surpass China, but it is
is, however, the fastest growing market for expected to grow significantly.
2,500
n Tropical Hardwoods
n Non Tropical Hardwoods
2,000
n Softwood Logs
1,500
Thousands m3
F o r e s t I n v e s t m e n t A s s o c iat e s
1,000
500
0
01
02
03
04
05
06
07
08
09
20
20
20
20
20
20
20
20
20
Figure 6. Indian log imports by type.
Source: UN FAO
1
In reality, some of the lumber imports will actually be logs processed just enough to avoid export duties on raw materials.
F o r e s t I n v e s t m e n t A s s o c iat e s
9 Re g i s t e re d I nve s t m e n t A dv i s e rAdding Diversification to a Global Timberland Portfolio
Adding Diversification to a Global
Timberland Portfolio
Global diversification exposes an investor to markets, the low and even negative correlations
a variety of timber and end-use markets. demonstrate that including multiple markets in
Countries with developed forest industries, a portfolio can reduce volatility in returns and
such as New Zealand and Australia, offer provide opportunities to take advantage of spot
Global diversification exposes more stability in a portfolio than emerging markets or strong timber sales in one region
markets and serve as excellent diversification while deferring harvests in another region
an investor to a variety of to an existing timberland portfolio of U.S. and experiencing a downturn.
emerging market investments. While still of-
timber and end-use markets. fering exposure to growing economies through Investment Environment in
exports, these countries exhibit a lower risk Australia and New Zealand
profile through lower sovereign risk and more The investment environment for timberland in
developed timber markets (Figure 7). both Australia and New Zealand is based on a
strong foundation of proven forest industries,
While Figure 7 tracks only the most valuable low sovereign risk and access to both export
softwood sawtimber product in each region or and domestic markets. These countries also
country, the series can be used as a proxy for boast established private property rights and
overall timber markets. Showing four mature substantial liquidity due to the activity of
Correlations of key log price indices in U.S. and Australasia denominated in local currency
140
International Log Prices Index (December 1995 = 100) (Real $2011)
International Log Prices Index (December 1995 = 100) (Real $2011)
US South US PNW Australia New Zealand
120
100
80
F o r e s t I n v e s t m e n t A s s o c iat e s
60
40
Correlations
US South US PNW Australia New Zealand
US South - 0.28 -0.29 0.12
20 US PNW 0.28 - -0.21 0.33
Australia -0.29 -0.21 - -0.27
New Zealand 0.12 0.33 -0.27 -
0
95
7
7
8
9
00
1
02
4
4
5
6
07
8
09
1
1
8
5
1
8
6
3
0
96
03
10
00
07
-1
-1
-9
-9
-9
l-9
-0
-0
-0
-0
l-0
-0
-9
-0
-0
-0
-9
-0
-1
n-
b-
n-
b-
n-
n-
n-
n-
p-
p-
ar
ct
ar
pr
ar
pr
ct
ay
ct
ay
ec
ec
ov
ov
ug
ug
ug
Ju
Ju
Fe
Fe
Ju
Ju
Ju
Ja
Ja
Ja
Se
Se
O
O
O
M
M
M
D
D
A
A
M
M
N
N
A
A
A
Figure 7. Correlations of key log price indices in U.S. and Australasia denominated in local currency.
Sources: US South:TimberMart South, Southwide PST, US PPI Commodities (1982=100); US PNW: Log Lines (R1,3,5,6), Six month average
of #2 Douglas fir; Australia: KPMG APLP Index,Weighted Av.of Intermediate Domestic Sawlog, ABS Final (Stage 3) Commodities (excl. exports);
New Zealand: NZ MAF Grade A Export Logs Average Price, NZSIOC PPI All Products
F o r e s t I n v e s t m e n t A s s o c iat e s
R e g i s t e re d I nvestm en t A dviser 10Adding Diversification to a Global Timberland Portfolio
international investors. Currently, Australia
and New Zealand account for more than
USD $7 billion in direct investment from
TIMOs. A scarcity of domestic capital
interested in timberland investments in these
countries has opened the door further for
foreign investors.
Recent activity in Australia has centered on the
privatization of state assets and the decline of
Managed Investment Scheme (MIS) companies.
Australian state governments, which own semi-
private forestry companies, began privatizing
high-quality assets to raise money, starting with
Victoria in 1998. No other state took action
until 2009 when Queensland sold its assets.
South Australia is beginning a sale process in
2012, and it is expected that New South Wales
will follow suit.
MIS companies in Australia were the main
source of domestic timberland investments for
over a decade. Based on a model of govern-
ment tax incentives, they raised more than
AUD $5 billion in capital in a very short time.
However, the rush to put capital to work led
to the establishment of many new planta-
tions on low-quality sites.The resulting poor
production and lower-than-predicted yields, Radiata pine plantation in South Australia after a
recent second thin
combined with high amounts of leverage by
the management companies and changes in the
tax regimes, sent nearly all MIS companies into for export use as wood chips to China and
receivership and caused their assets to be sold Japan. Australia is a source of high-quality
to satisfy creditors. wood chips, but the chips are currently the
most expensive on the market because they
Australia has well-developed markets for both are priced in Australian dollars2. While quality
hardwood and softwood timber. Nearly all and sustainably grown eucalyptus chips are in
plantations established by MIS companies strong demand, continued strengthening in the
were short rotation hardwood pulpwood Australian dollar is causing some buyers to look
stands consisting of fast-growing eucalyptus at more cost-effective alternatives.
2
Most of the global wood chip trade is conducted in US dollars.
F o r e s t I n v e s t m e n t A s s o c iat e s
11 Re g i s t e re d I nve s t m e n t A dv i s e rAdding Diversification to a Global Timberland Portfolio
Australia has a strong domestic demand for plantations and create stronger demand for
softwood sawtimber and a large supply deficit existing assets. Australia imports roughly 15%
already exists as illustrated in Figure 8. of its domestic softwood demand from as far
away as Eastern Europe.
The green line represents the mainly
static softwood log supply for the next 30 New Zealand is one of the most mature
years. The tan and orange lines in Figure markets outside the United States, attracting
8 show Australian Bureau of Statistics investors from the U.S., Japan and China.
(ABS) population projections converted U.S.-based investors have been significant
into sawn lumber demand using per capita players since the 1990s and today control a
consumption estimates (tan line shows large share of the forest resource. With a small
“pessimistic” projection with low per capita population and a large forest resource, most of
wood consumption and orange line shows the wood harvested is exported. Radiata pine,
“optimistic” projection with higher per capita the primary softwood species in New Zealand,
wood consumption). Limited opportunities to is widely used and accepted in both Australian
establish new softwood plantations mean this and Asian markets. Korea has been the most
deficit will grow in the future. But increased regular consumer of New Zealand logs, but
timber prices could improve expected returns China and India have both increased their
leading to more investments in new softwood imports significantly.
10
–– High Population Growth Timber Demand –– Low Population Growth Timber Demand –– Softwood Sawtimber Supply
9
8
2,500,000 m3
7
Volume in Millions m3
6 950,000 m3
700,000 m3
5
F o r e s t I n v e s t m e n t A s s o c iat e s
4
One Radiata Pine Rotation
3
2
1
04
06
08
10
12
14
16
18
20
22
24
26
28
30
32
34
36
38
40
42
44
46
48
50
52
54
20
20
20
20
20
20
20
20
20
20
20
20
20
20
20
20
20
20
20
20
20
20
20
20
20
20
Figure 8. Actual and projected softwood sawnwood supply versus demand in Australia.
Source: Poyry, ABS, Forestry, NSW
F o r e s t I n v e s t m e n t A s s o c iat e s
R e g i s t e re d I nvestm en t A dviser 12Adding Diversification to a Global Timberland Portfolio
Investment Environment in Uruguay and Chile have established industries
Other Mature Markets and offer more opportunities for diversifica-
While Australia and New Zealand are the tion in South America. Uruguay has an almost Chile has the most favorable
most important countries to consider for fully invested forestland market that stems
global diversification in mature markets, from off-shore investments made as early as and mature macroeconomic
the history and vast natural resources of the 1960s. Although market depth is limited,
Europe and Scandinavia also merit attention. the announced Stora/Arauco pulp mill will profile of any country in South
However, there are limitations to expansion still generate domestic demand for timber.
caused by a climate more conducive to Woodchip and log exports from Uruguay America and is the world’s
slower growing species and a fragmented typically supply Europe and a growing market
land ownership. The resulting log shortages in Morocco. fourth largest pulp exporter.
at home are causing large companies to
look globally for wood supply. Scandinavian Chile has the most favorable and mature
countries are net importers of wood from macroeconomic profile of any country in
Baltic countries such as Estonia and Latin South America and is the world’s fourth largest
America. The strong domestic demand pulp exporter. Its climate presents excel-
derives from the region’s large pulp and paper lent growing conditions for both softwood
industry. Sweden and Finland are currently and eucalyptus, which has become the main
the fourth and fifth largest pulp producers in source of exports. Forest ownership in Chile
the world. is heavily concentrated with two domestic
companies, Arauco and CMPC, owning over
Europe also has one of the world’s few half of the plantation estate. Chile is second
established bioenergy markets. This market only to New Zealand in terms of market share
primarily exists in the form of wood pellets of exports to Japan and several Japanese paper
imported from North America, but recently companies and trading houses have a presence
it has experienced increased production from in the country.
domestic sources. However, this industry is
heavily reliant on government subsidies which
could disappear quickly.
F o r e s t I n v e s t m e n t A s s o c iat e s
13 Re g i s t e re d I nve s t m e n t A dv i s e rEnhancing Timberland Portfolio Returns with Emerging Market Exposure
Enhancing Timberland Portfolio Returns
with Emerging Market Exposure
Finding opportunities for enhanced returns Feeding the Tigers – Strategic
requires accepting more risk in a portfolio Supply Sources
by investing in regions such as Southeast
Asia, Latin America, or potentially Africa. Southeast Asia
Recognizing a significant share of the world’s Southeast Asia is currently the largest
consumer growth will occur in countries source of timber exports into China. One
such as China, India, Indonesia and Brazil, key product used to illustrate the growing
FIA evaluated which geographies will be the importance of Southeast Asia is hardwood
sources of raw materials for these countries. chips (Figure 9). Many parts of the region
As previously highlighted, the popularly have year-round growing seasons and a wide
termed “Tiger” countries China and India will range of fast-growing species which are well
continue to focus on imports from strategic suited for paper production as well as sawn
supply sources located across the globe. On timber products. In the past, Southeast Asia
the other hand, Brazil and potentially Indo- has relied on the unsustainable harvesting of
nesia can meet their own demand and export primary forests for timber production.
excess supply.
5.0
4.5
n Other
n Thailand
4.0 n Indonesia
3.5 n Australia
Million Bone Dry Metric Tons
n Vietnam
3.0
2.5
F o r e s t I n v e s t m e n t A s s o c iat e s
2.0 Re g i s t e re d I nve s t m e n t A dv i s e r
1.5
1.0
0.5
0.0
2003 2004 2005 2006 2007 2008 2009 2010
Figure 9. China’s hardwood chip imports by originating country.
Source: RISI
F o r e s t I n v e s t m e n t A s s o c iat e s
R e g i s t e re d I nvestm en t A dviser 14Enhancing Timberland Portfolio Returns with Emerging Market Exposure
The history of forest assets in the region of transporting logs to southeastern China, via
tells a story of over-harvesting, poor either rail or ship, actually makes Russian logs
management and minimal concern for more expensive in these regions compared to
future productivity. Many countries that logs imported from other countries.
saw their natural forests depleted in the past
are encouraging investments in sustainable South America
plantation management as they seek to revive Also worth noting are the emerging Latin
their forest industries. An investor with a American countries that continue to develop
longer time horizon will be able to make their economies and forest industries.
early investments in a growing industry and Colombia is South America’s fourth largest
recognize gains as the market matures. country with an interesting logistical
advantage of having access to the Atlantic
FIA narrowed down which countries are the Ocean via the Caribbean Sea as well as direct
most suitable for timberland investment by access to the Pacific Ocean. With total
evaluating risk elements such as land tenure, population approaching 48 million people
imputed country risk, operational/execution with a median age of around 28 years, the
risk, legal, tax, labor and investment structure. demographics of Colombia are attractive from
a macroeconomic perspective. With a high
When contemplating timber supply in Asia, literacy rate and positive improvements in
Russia can’t be ignored. Russia has the largest education, Colombia has significant potential
softwood resource in the world and has been to accelerate its economic growth. GDP
a major supplier of logs to China, but several is projected to have grown by 5% to 6% in
limitations may cause it to irreversibly lose 2011 with 4% inflation. The recently signed
market share as importing countries identify Free Trade Agreement with the U.S. will be a Eighteen-year-old teak plantation in
new sources of supply. Russia’s log export positive factor once implemented mid-2012. Sabah, Malaysia
tax, designed to increase domestic process-
ing, has received prominent worldwide media The country is rich with natural resources
attention as the tax has increased over the past including precious metals, gems and proven
several years and is expected to increase in oil reserves. Agriculture represents around
the future. Also, the lack of infrastructure in 8.9% of the total GDP of Colombia. The
Russia makes harvesting and exporting logs forest sector is only a small portion of total
difficult. Most logs are transported to neigh- GDP; however, the potential for expansion
boring countries via railroad with only a small is significant. According the MADR3
percentage being shipped by sea. The majority approximately 17 million hectares are
of Russian imports enter China through one of suitable for forest plantations while only
two rail heads in northeastern China and are 1.5% of that area is currently managed
processed in facilities in this region. The cost commercial timberland.
3
Ministerio de Agricultura y Desarrollo Rural (Colombia’s Department of Agriculture)
F o r e s t I n v e s t m e n t A s s o c iat e s
15 Re g i s t e re d I nve s t m e n t A dv i s e rEnhancing Timberland Portfolio Returns with Emerging Market Exposure
While Colombia’s recent history may be Africa attracts USD $200 million in forest
primarily associated with drug related investments every year. Africa continues to
violence, kidnappings and guerilla warfare, be a strategic supply source of logs and wood
Africa’s total forest cover the past five years have brought stability and chips for many countries as well, especially
safety to the country mostly attributable to China and India. Log buyers in the two
is estimated at 674 million the policies adopted during the presidency countries have tried to avoid competition
of Alvaro Uribe (2006 to 2009). Since his where possible by essentially dividing the
hectares representing nearly inauguration in 2010, President Juan Manuel continent. The African Development
Santos has indicated continued support of Bank has also been active since the 1970s
a quarter of the continent’s his predecessor’s policies and has remained directly investing in projects emphasizing
on-course. The combination of government sustainable management and rehabilitation of
land area and 17% of the incentives and supportive agencies, such as degraded natural forests. The establishment
ProExport Colombia, creates a favorable of sustainable plantations has also been cited
world’s forest cover. opportunity for bare land investments for by the World Bank as an excellent way to
either softwood or hardwood production. improve economic conditions in rural areas.
Africa For more than 30 years, South Africa has
Africa’s total forest cover is estimated at 674 been a stable producer of high-quality wood
million hectares representing nearly a quarter chips which have been highly sought after in
of the continent’s land area and 17% of the Japan. While exports have decreased, the
world’s forest cover. However, the forests forest estate of more than 1.2 million hectares
are continuously threatened by agricultural still supports a viable domestic industry.
expansions, increased fuel wood collection, Traditionally softwoods, mainly various pine
unsustainable management regimes, livestock species, dominated plantations but genetic
grazing, and urbanization and industrialization. and management improvements have allowed
Weak oversight of forest managers, especially forestland owners to increase the scale of
foreign managers, and a lack of awareness hardwood plantations. Yields for eucalyptus
have exacerbated the problem. Since 1990, averaging between 15 m3 and 20 m3 per
3.75 million hectares of forest have been year rival other traditional producers such
lost annually mainly in the larger forests in as Chile and Australia. The shift to pulp logs
the Congo Basin and Upper Guinea. Most and shorter rotations is leading to a deficit of
countries continue to rely mainly on natural sawlogs. A report by Crickmay and Associates
harvests of tropical hardwood logs and estimates that the sawlog deficit in South
environmental degradation is prevalent. Africa will expand from 2.3 million m3 per
year in 2005 to 4.3 million m3 by 2019. Large
Large-scale land acquisition has historically sawlogs will be needed as development moves
been difficult in Africa, but the African Union out of cities and into rural areas. For example,
has been active in producing guidelines transmission poles will be highly sought after
for land lease and tenure systems. Foreign to carry electricity into rural areas across
investment will be very important and Africa creating a need for a specialty product.
according to the African Development Bank
F o r e s t I n v e s t m e n t A s s o c iat e s
R e g i s t e re d I nvestm en t A dviser 16Enhancing Timberland Portfolio Returns with Emerging Market Exposure
Brazilian Timberland Brazil offers a range of both planted and
With large and growing agricultural, mining, bare land opportunities in softwood and
manufacturing and service sectors, Brazil’s hardwood plantations. We divide the country
growing economy ranks highest in total GDP into three unique regions: 1) Southern
among all South American countries. As it Brazil, characterized by mostly established
evolves into the geopolitical leader of South plantations, 2) the emerging central region
America, foreign direct investments will which provides bare land opportunities,
be needed to augment domestic capital to and 3) the frontier regions of the northeast
develop its infrastructure and realize its full which are raw and undeveloped with little
economic growth potential. Unlike China, to no existing forest industry. From FIA’s
Brazil is an emerging country with a timber perspective, achieving acceptable risk
resource and domestic industry large enough adjusted returns in Brazil’s natural forests is an
to meet its growing wood demand. extremely difficult proposition. A diversified
portfolio of plantation investments can be
A country of continental size, 15% of the constructed where risk exposure can be
world’s fertile land belongs to Brazil. The customized by state, end use market, species,
scalability is attractive and its growth rates geography and operational model.
for both hardwoods and softwoods are elite
among countries with significant industrial One of the most attractive characteristics
tree plantations. Forest productivity in Brazil of the current investment environment in
significantly exceeds that of other global Brazil is its similarity to the conditions of
competitors (Figure 10). the U.S. timberland markets in the 1980s
and 1990s. The majority of Brazil’s existing
45
Hardwood Softwood
40
35
30 F o r e s t I n v e s t m e n t A s s o c iat e s
25
m 3/ha/year
20
15
10
5
0
Sweden Indonesia Australia Chile USA Portugal Finland South Africa Brazil
Figure 10. Forest productivity between softwoods and hardwoods in Brazil and selected countries.
Source: ABRAF 2010 yearly report
F o r e s t I n v e s t m e n t A s s o c iat e s
17 Re g i s t e re d I nve s t m e n t A dv i s e rEnhancing Timberland Portfolio Returns with Emerging Market Exposure
timber plantations are owned by vertically
integrated producers such as Fibria, Suzano
and Klabin. Much like their U.S. counterparts
20 years ago, they are beginning to understand
that they do not need to own property and
institutional investors can be counted on to
supply wood. Many are considering selling
assets to make capital investments in their
mills to facilitate expansion. However, this
shift in mentality has been slow and is not fully
accepted. Among all non-U.S. countries with
existing forest industries, Brazil has the highest
likelihood to develop a deep timberland
investment market similar to that of the U.S.
over the next 20 years.
While doing business in Brazil has
complexities similar to other emerging
economies, these can be navigated. As the
Brazilian economy matures, the investment
environment for timberland will improve,
resulting in increased market efficiency,
lower barriers to entry and subsequently
compressing expected returns over the
next decade. One of the biggest challenges
facing non-Brazilian timberland investors is
successfully complying with the August 2010
attorney general ruling restricting foreign
capital from investing in real estate. This is a
real and absolute constraint and must be dealt
with transparently.
Twelve-year-old Loblolly pine in Santa Catarina, Brazil
F o r e s t I n v e s t m e n t A s s o c iat e s
R e g i s t e re d I nvestm en t A dviser 18Understanding the Risks
Understanding the Risks
Country Risk investors earn an appropriate return for the
Country risk, or sovereign risk, is the possibility risks involved. Utilizing existing sources, such
for loss in an investment caused by uncertainties as those compiled in Table 2, helps compare
in the social, political and economic climates relative investment risks between countries.
of a country. Evaluation and management of These independent measures are helpful tools
country risk begins by carefully screening each when gauging economic stability, corruption,
country to determine its investment climate. business climate and other key factors but may
Each country presents unique risks such as not be comprehensive enough for assessing
title issues in Brazil or indigenous land claims deal specific timberland risk.
in parts of Indonesia. Given the differences in
each country’s social, political, regulatory, and When considering specific timberland
economic conditions, careful consideration investment opportunities outside the U.S.,
must be given to structure investments to an investor must analyze many of the same
comply with local laws and regulations. factors as U.S. investments to evaluate risk,
Ultimately, it will be necessary to ensure that including silvicultural history, depth of
Damodaran2 Damodaran Fitch3 World Bank4
Country CPI1 Score CPI Rank Total RP Country RP Foreign Currency Rating Ease of Doing
**equity premiums long-term short-term Business Rank
United States 7.1 24 6.00% 0.00% AAA F1+ 4
New Zealand 9.5 1 6.00% 0.00% AA F1+ 3
Australia 8.8 8 6.00% 0.00% AA+ F1+ 15
Chile 7.2 22 7.05% 1.05% A F1 39
Sweden 9.3 4 6.00% 0.00% AAA F1+ 14
Finland 9.4 2 6.00% 0.00% AAA F1+ 11
Uruguay 7 25 9.60% 3.60% BB B 90
Brazil 3.8 73 8.63% 2.63% BBB- F3 126
South Africa 4.1 64 7.73% 1.73% BBB+ F2 35
Costa Rica 4.8 50 9.00% 3.00% BB B 121
Malaysia 4.3 60 7.73% 1.73% - - 18
Latvia 4.2 60 9.00% 3.00% BB+ B 21
Estonia 6.4 29 7.28% 1.28% BBB+ F2 24
Argentina 3 100 15.00% 9.00% B B 113
Colombia 3.4 80 9.00% 3.00% BB+ B 42
Russia 2.4 143 8.25% 2.25% BBB F3 120
China 3.6 75 7.05% 1.05% A+ F1 91
Cambodia 2.1 164 13.50% 7.50% - - 138
Vietnam 2.9 112 12.00% 6.00% B+ B 98
Laos 2.2 154 - - - - 165
Mozambique 2.7 120 - - B B 139
Congo (Brazzaville) 2 163 - - - - 181
Uganda 2.4 142 - - B B 123
Zambia 3.2 91 - - - - 84
Zimbabwe 2.2 154 - - - - 171
Tanzania 3 100 - - - - 127
Madagascar 3 100 - - - - 137
Table 2. Sample analysis of various country rankings (Dec. 2010).
Source: FIA internal research
1 Corruption Perception Index reported by Transparency International
2 Calculated by Damodaran F o r e s t I n v e s t m e n t A s s o c iat e s
3 Fitch Complete Sovereign Rating History 19 Re g i s t e re d I nve s t m e n t A dv i s e r
4World Bank International Finance CorporationUnderstanding the Risks
local timber markets, health of area mills, projected investment return on a hypotheti-
export opportunities, timber price history, cal investment in Brazil (Table 3). At the start
accessibility to markets (i.e., existing of the investment period, the exchange rate
infrastructure and road system), suitability of was 1.8 BRL per USD and the investment was
a project to terrain, soil types, rainfall, and the projected to earn a 10% real return over the
potential for disease or pest outbreaks in the 10-year holding period. If the Brazilian real
area. Local regulations are also an important weakened significantly (or if the dollar appreci-
factor with respect to environmental policies ated) the day after the investment was made and
and land ownership and use. remained depressed over the life of the invest-
ment, the property would still show a positive
Among investors, it is commonly believed return. For example, if the real weakened by
that all investments outside the U.S. 33% to a level of 2.4 BRL per USD, the invest-
inherently carry more risk. But in reality, ment would still show a 5.7% real return, illus-
U.S. investments can have as much or even trating how biological growth over the 10-year
more regulatory risk. For example, the holding period can hedge currency movements.
recent 9th Circuit Court ruling on non-point Conversely, if the real strengthened significantly
source pollution could have a detrimental or the dollar depreciated, biological growth
effect on timber harvests and increased would magnify the impact. If the real appreci-
regulation of forest activity has nearly ated 33% to a rate of 1.2 BRL per USD, the
terminated commercial forestry in California. investor’s return would jump to nearly 17%.
Currency Risk It is impossible to identify or quantify all of the
Currency risk is a major factor in international potential outcomes of an investment attributed
investments and the impact of exchange rates to currency movement. Any number of
on investment performance is difficult to pre- secondary outcomes could result from currency
dict. The long-term nature of timberland in- movements that will affect timberland. For
vestments makes traditional hedging strategies example, a weaker Brazilian real could increase
either impossible or very expensive, especially the demand for Brazilian wood products
in countries with volatile currencies or large worldwide, in turn leading to higher timber
interest rate spreads. However, biological prices in Brazil and generating higher returns
growth of trees is, in a sense, a natural hedge, for the investment. Rather than trying to
which mitigates the impact of unfavorable identify every possible outcome, investors and
currency movements. As trees age, they will timberland managers should remain vigilant in
grow into bigger and more valuable end prod- monitoring exchange rates and the underlying
ucts. This natural volume growth provides a causes when making decisions regarding cash
way to offset loss from unfavorable currency flows, dispositions, or short term hedging
movements that no other asset can offer. opportunities. As an example, it may be feasible
and available to lock in an exchange rate if
As part of FIA’s research on currency risk an investor knows in advance that he will be
in timberland investments, we analyzed the receiving a cash flow in the future from a timber
impact of changes in exchange rates on the sale or when liquidating the investment.
Expected Real IRR with Sensitivity to Exchange Rates
Purchase Price in USD Exchange Rate of BRL to USD
Purchase Price in BRL (1.8 BRL to USD) 0.8 1.20 1.50 1.80 2.10 2.40 4.0
$46,000,000 $25,555,556 21.8% 16.6% 12.8% 10.0% 7.6% 5.7% -1.1%
Table 3. Return sensitivity for a hypothetical Brazilian timberland investment as affected by movement
in the Brazilian real immediately following acquisition.
F o r e s t I n v e s t m e n t A s s o c iat e s
R e g i s t e re d I nvestm en t A dviser 20Execution - Turning Strategy into Action
Execution - Turning Strategy into Action
Strategic Overview
Based on our analysis of macroeconomic
trends and global wood flows, FIA developed
three key strategies to building global tim-
berland portfolios: 1) gaining timber market
diversification through exposure to mature
markets, 2) supplying the rapid growth in
emerging economies, and 3) participating
in the evolution of Brazil’s domestic forest
industry. While these approaches are con-
nected under the same investment theme,
each presents opportunities to add diversifica-
tion and/or earn enhanced returns.
Investment Strategy: Mature Markets
Investing in mature markets offers opportuni-
ties to diversify exposure to various timber
markets. While many of these countries have
viable domestic industries, they can offer
investors exposure to export markets as well.
The most distinguishable factor between
investments targeted for enhanced returns and
those targeted for diversification is the lower
risk and resulting lower expected return. For
example, New Zealand and Chile are both
active exporters, but the depth of the timber-
land market and strength of existing investors Thinned spruce in Estonia
has compressed discount rates. Investments
made for their diversification benefits and focused on developments in Australia,
access to existing or domestic markets should attractive opportunities may present
be less risky and have lower expected returns themselves. Given that New Zealand offers
than riskier investments which rely heavily on lower risk access to both emerging Asian
exports. Even discount rates in Australia are economies and the sizable Australian economy,
noticeably higher for hardwood investments it is important to follow developments and act
centered on exports compared to softwood quickly on reasonably priced opportunities.
investments targeted for the domestic market. Australia is currently the more attractive
opportunity given the prospects for
Competition for acquisition opportunities privatization of state assets and the failed MIS
in New Zealand has compressed discount companies in receivership. Targeting quality
rates below levels which accurately account softwood plantations in Australia offers the
for risks of a market heavily dependent on potential to achieve superior, risk-adjusted
exports. However, with investor attention
F o r e s t I n v e s t m e n t A s s o c iat e s
21 Re g i s t e re d I nve s t m e n t A dv i s e rExecution - Turning Strategy into Action
returns. The supply shortage of softwood for exports, but investment opportunities will
sawtimber in Australia will be positive for be limited and more difficult to source. The
timber prices in the future. Potential state competitive environment in Chile is especially
Emerging markets offer the privatizations by South Australia and New problematic due to Arauco and CMPC’s
South Wales could also provide attractive and oligopoly in the market.
best opportunities for earn- scalable investment opportunities. Many
hardwood plantations were established by Investment Strategy: Emerging Markets
ing enhanced returns as MIS companies on land better suited for A manager should construct a global timber-
softwoods, and these failed plantations could land portfolio to take advantage of changing
they have the most exposure be converted back to softwood production. wood demand by identifying countries with
raw material supply and favorable investment
to fast growing economies. Despite challenging market conditions and climates. Emerging markets offer the best
potentially slower than predicted growth on opportunities for earning enhanced returns as
some assets, hardwood plantations in Aus- they have the most exposure to fast growing
tralia could provide opportunities for higher economies; however, emerging markets pose
expected returns as a source of wood chips unique complications which must be addressed.
into Asian markets. Japan has been a stable
importer of wood chips while other countries Direct investment in most emerging markets
with expanding pulp industries will likely look can be difficult because of both perceived and
to Australia as well. The collapse of the MIS actual risk factors. Problems with land-tenure
industry provides opportunities to acquire security and, in some areas, fragmentation
these assets at attractive valuations. Despite of the land ownership make it challenging
the poor performance of many recently estab- to build an investment grade land base.
lished plantations, opportunities may exist to Large areas of forestland are often owned by
acquire older plantations on productive sites governments or communities, making freehold
located in close proximity to ports. land acquisition less likely than leases and joint
ventures. Rather than selling a fee simple
Many European countries have viable markets interest, governments grant concessions or
and timberland assets but are tied to the Euro, land use rights to investors. These concessions
and recent economic troubles have diminished usually grant the right to operate the property
the appeal of direct investments in this region. as a forest asset within certain guidelines and
From a cost perspective, the existing forest range from very secure and liquid in Malaysia
base in European countries is less favorable to tenuous in Africa.
than other less expensive parts of the world.
Scandinavia has a combination of abundant A scarcity of existing assets means many poten-
natural resources and a well-established tial investment opportunities will be long-
industry possibly opening the door for term, greenfield investments. Investors could
investment. Direct investments in the Baltics be required to obtain government approvals
could be attractive on an opportunistic basis, and to build the asset and infrastructure from
but limitations to investment in this region the ground up. This process could last several
make assembling scale difficult. years resulting in capital drawdowns over
longer time periods ranging from just a couple
Finally, established South American markets years to over five years. Greenfield invest-
such as Chile and Uruguay present excellent ments have the opportunity to earn higher
opportunities for diversification given their returns, but the extra risks must be weighed
existing domestic markets and opportunities carefully in valuations.
F o r e s t I n v e s t m e n t A s s o c iat e s
R e g i s t e re d I nvestm en t A dviser 22You can also read